Characteristics
CTOP.py is an Open Source tool for System Monitoring created by me, Carles Mateo.
Current stable version is v.0.8.9 updated on 2022-07-03.
Current branch under development is v.0.8.10 updated on 2022-07-13.
It is written in Python 3, with no external libraries (everything is read from the Linux Kernel, /proc…). Support for Python 2.7 was added.
You can clone it from gitlab:
https://gitlab.com/carles.mateo/ctop
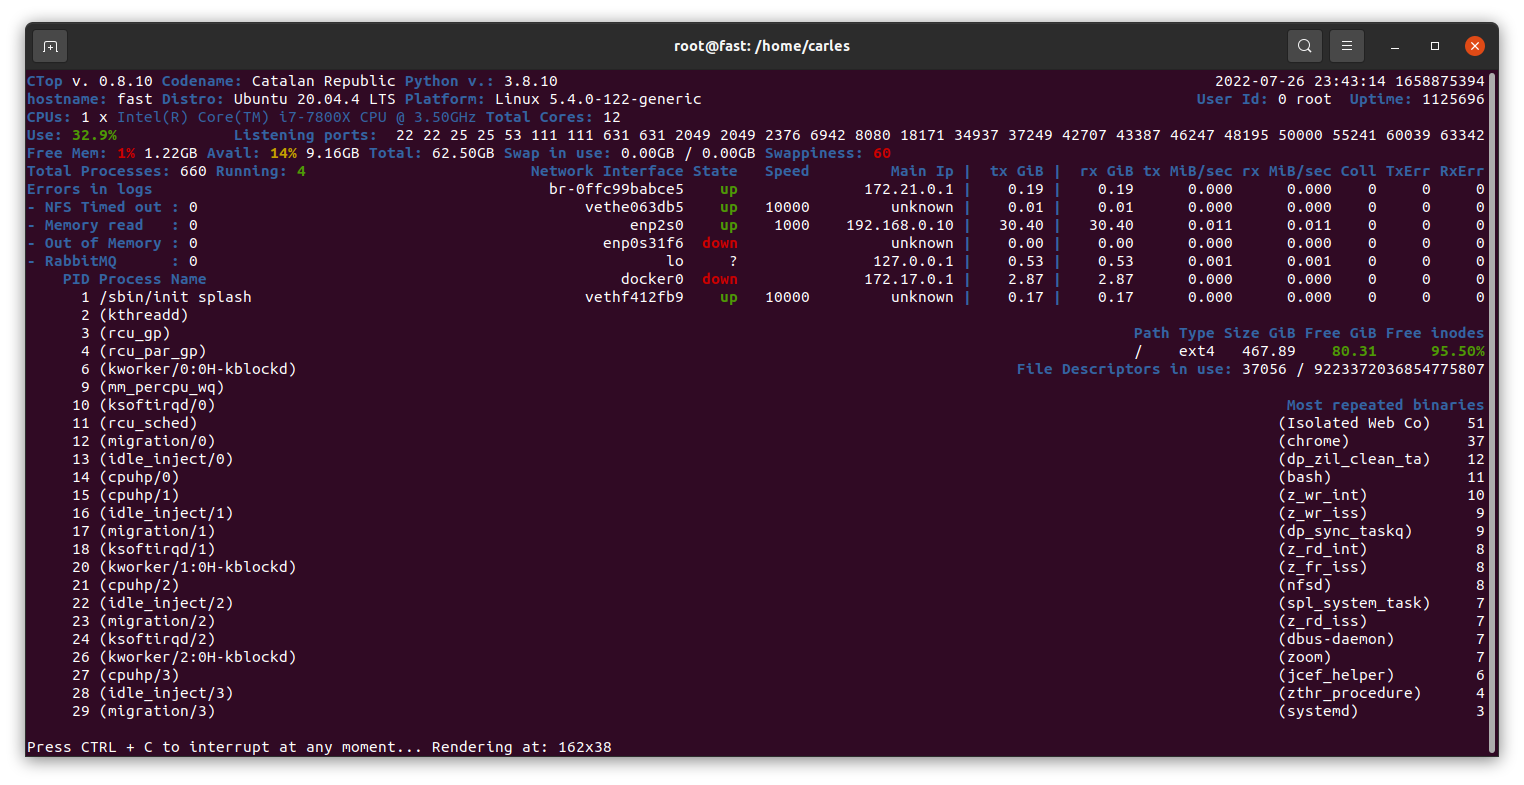
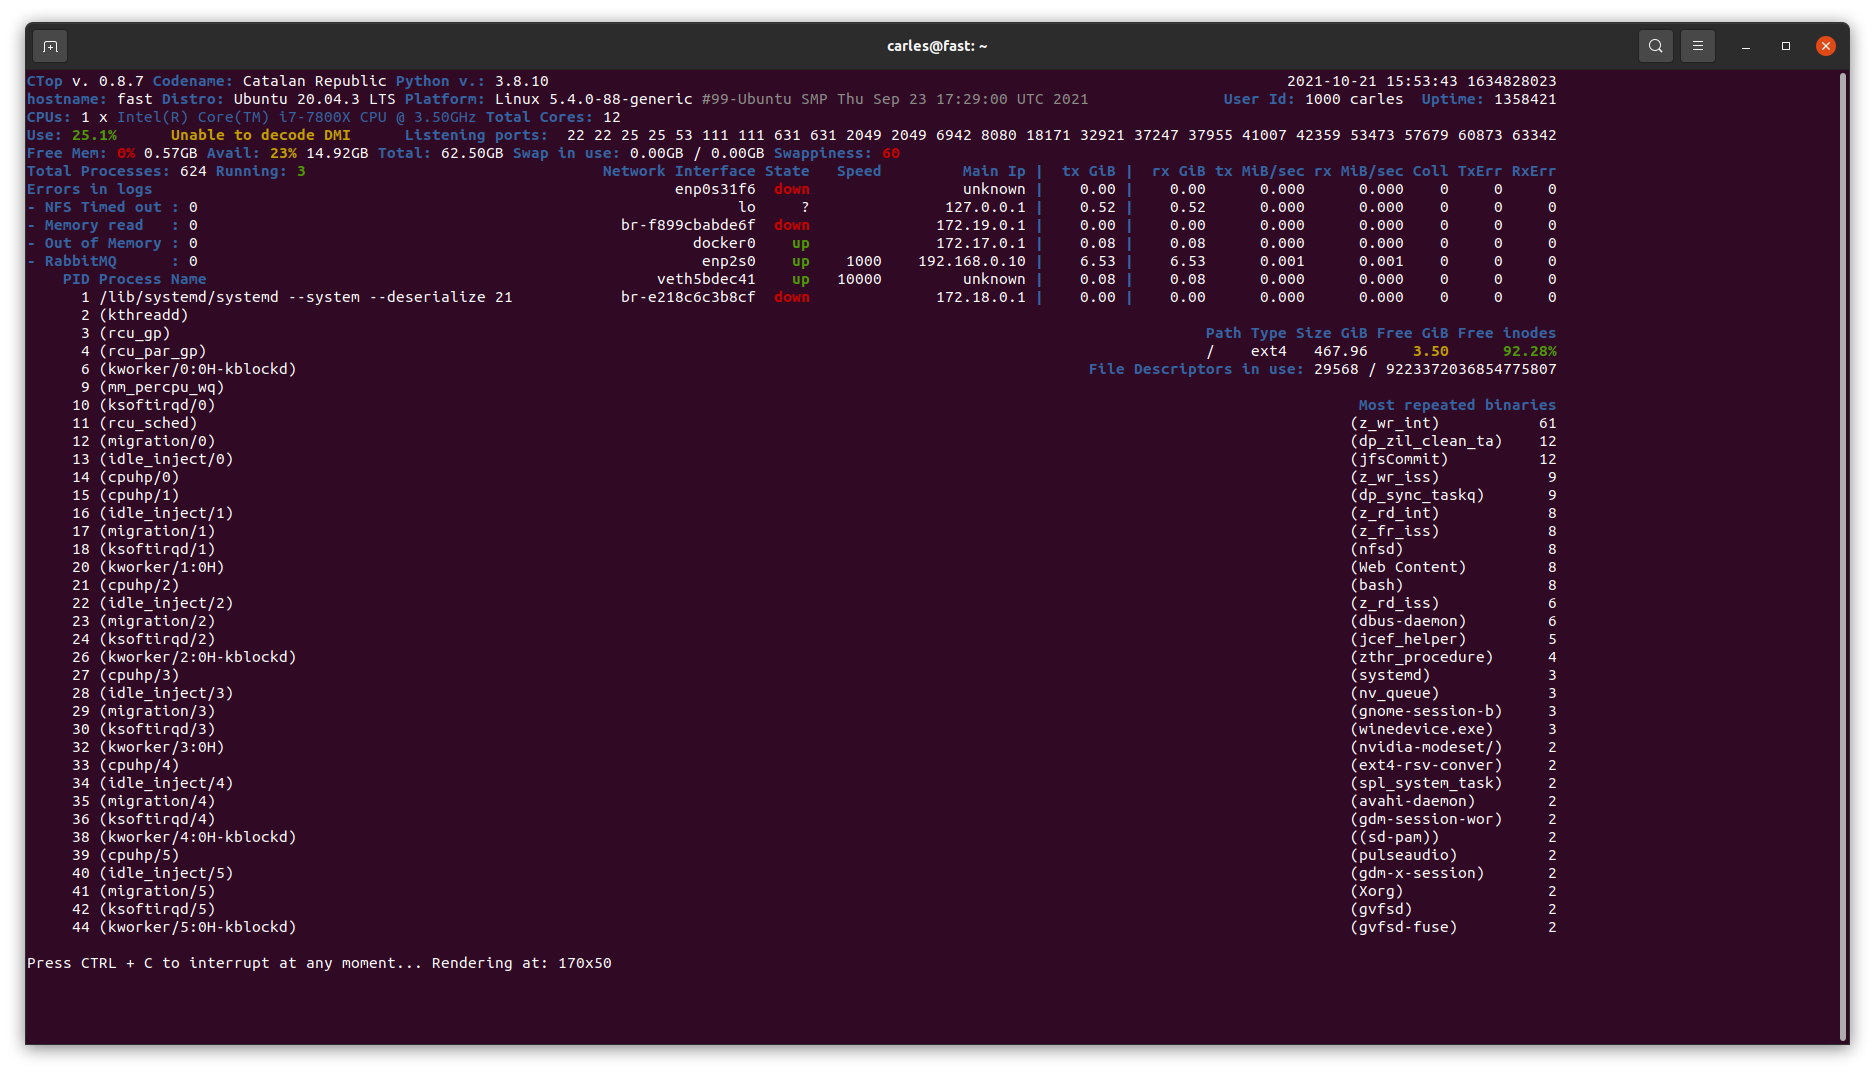
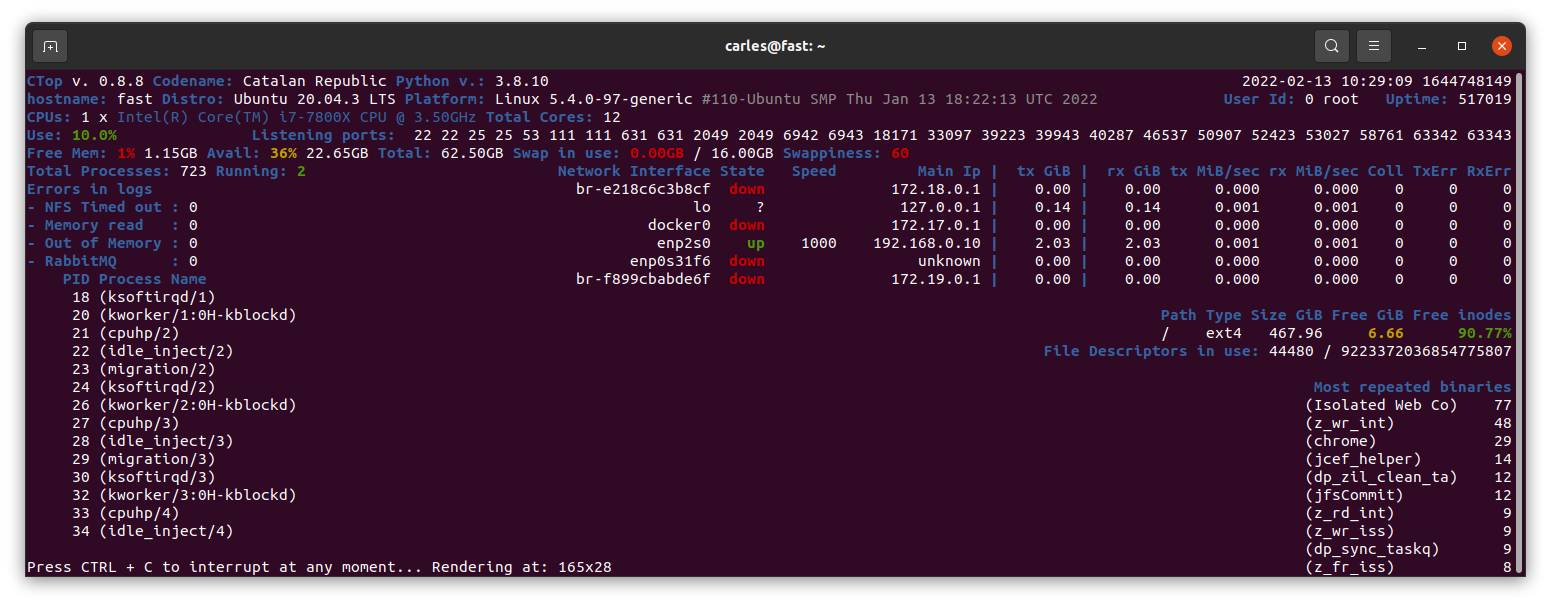
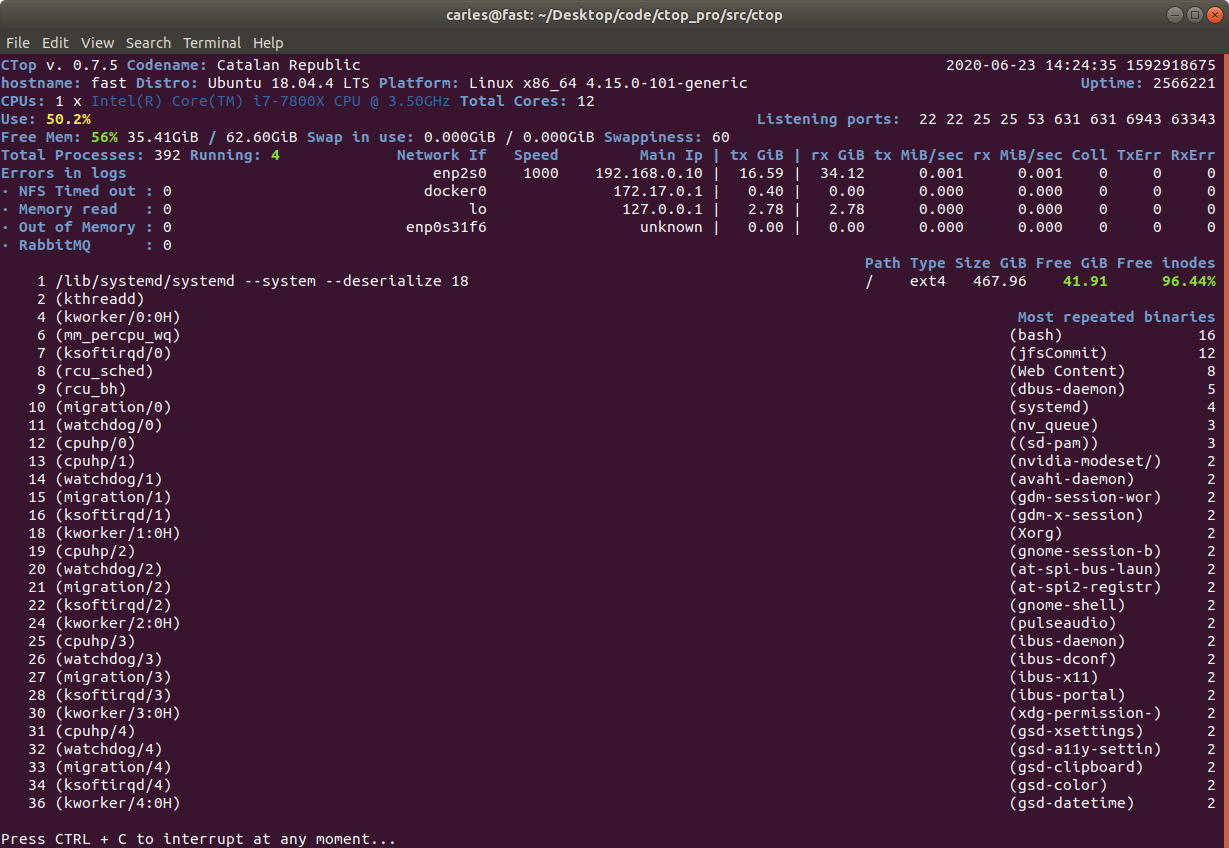
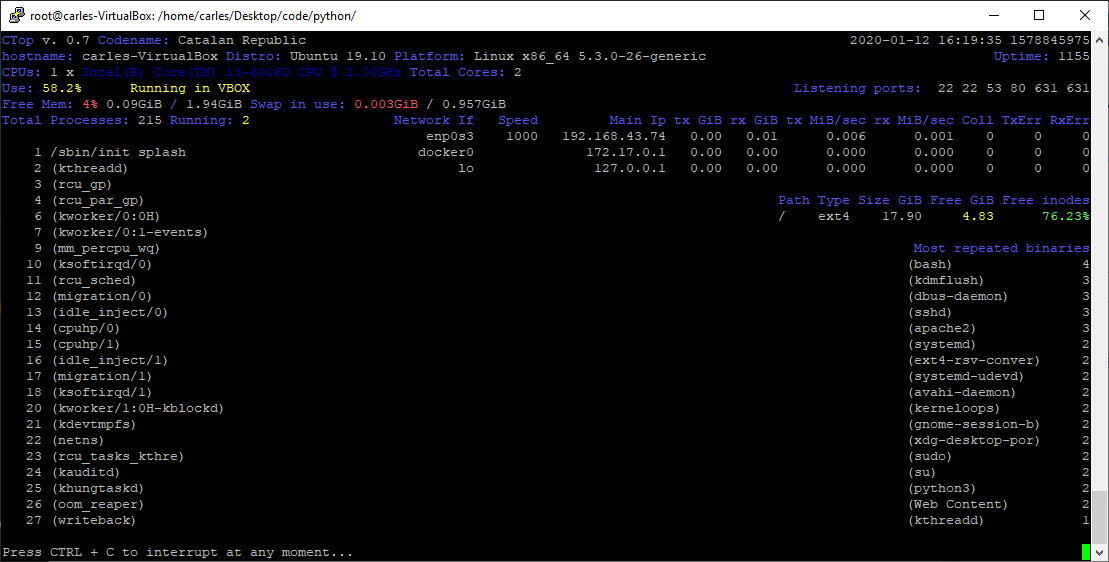
The idea is to provide all the info that we need to troubleshoot a system in a single view (or to do with an screenshot).
The tool uses only Python 3 and no external libraries.
Every metric is read from Linux Kernel (/proc /sys /dev…) so it can be used as a tool to learn about Linux Internals, and Python and Unit Testing as well.
Provides the functionality of utilities like:
- ip addr / ifconfig list to see the main Ip for the interfaces
- uname -a to see the Kernel version
- uptime
- iftop to see real-time bandwidth usage
- top, htop for the CPU usage, process list, memory usage
- df -h to see the free space in / and the free inodes
- free -h to see the memory and swap information
- netstat or lsof to see the list of listening TCP Ports
- whoami
- hostname
- cpuinfo
- meminfo
It detects when it is running in The Cloud, OpenStack, VMware, VirtualBox, Docker… and prints is. Very helpful to identify which kind of CSP we are connecting via ssh.
https://gitlab.com/carles.mateo/ctop/-/blob/master/README.md
Version 0.8.0 added compatibility with Python 2, for older Systems.
Find the source code in: https://gitlab.com/carles.mateo/ctop
Clone it with:
git clone https://gitlab.com/carles.mateo/ctop.git
ctop.py uses only these built-in modules, so it’s ideal to run in all the farm of Servers and Docker Containers:
- os
- sys
- time
- shutil (for getting the Terminal width and height)
The purpose of this tool is to help to troubleshot and to identify problems with a single view to a single tool that has all the typical indicators.
It provides in a single view information that is typically provided by many programs:
Other cool things it does is:
- Identifying if you’re inside an Amazon VM, Google GCP, OpenStack VMs, Virtual Box VMs, Docker Containers or lxc.
- Compatible with Raspberry Pi (tested on 3 and 4, on Raspbian and Ubuntu 20.04LTS)
- Uses colors, and marks in yellow the warnings and in red the errors, problems like few disk space reaming or high CPU usage according to the available cores and CPUs.
- Redraws the screen and adjust to the size of the Terminal, bigger terminal displays more information
- It doesn’t use external libraries, and does not escape to shell. It reads everything from /proc /sys or /etc files.
- Identifies the Linux distribution
- Supports Plugins loaded on demand.
- Shows the most repeated binaries, so you can identify DDoS attacks (like having 5,000 apache instances where you have normally 500 or many instances of Python)
- Indicates if an interface has the cable connected or disconnected
- Shows the Speed of the Network Connection (useful for Mellanox cards than can operate and 200Gbit/sec, 100, 50, 40, 25, 10…)
- It displays the local time and the Linux Epoch Time, which is universal (very useful for logs and to detect when there was an issue, for example if your system restarted, your SSH Session would keep latest Epoch captured)
- Displays the File Descriptors in use and the maximum allowed
- No root required
- Displays recent errors like NFS Timed outs or Memory Read Errors.
- You can enforce the output to be in a determined number of columns and rows, for data scrapping.
- You can specify the number of loops (1 for scrapping, by default is infinite)
- You can specify the time between screen refreshes, for long placed SSH sessions
- You can specify to see the output in b/w or in color (default)
- Provided Unit Tests made with pytest framework and Jenkins integration
Plugins allow you to extend the functionality effortlessly, without having to learn all the code. I provide a Plugin sample for starting lights on a Raspberry Pi, depending on the CPU Load, and playing a message “The system is healthy” or “Warning. The CPU is at 80%”.
Limitations:
- It only works for Linux, not for Mac or for Windows. Although the idea is to help with Server’s Linux Administration and Troubleshot, and Mac and Windows do not have /proc
- The list of process of the System is read every 30 seconds, to avoid adding much overhead on the System, other info every second
- It does not run in Python 2.x, requires Python 3 (tested on 3.5, 3.6, 3.7, 3.8, 3.9)
Rules for writing a Comment