If you are getting an error like this when you try to provision using rsync or running commands from SSH from a Docker Instance from a worker node in Jenkins, having your SSH Key as a variable in Jenkins, here is a way to solve it.
These are the kind of errors that you’ll be receiving:
Load key "ssh_yourserver": invalid format

web@myserver.carlesmateo.com: Permission denied (publickey).

rsync: connection unexpectedly closed (0 bytes received so far) [sender]

rsync error: unexplained error (code 255) at io.c(235) [sender=3.1.3]

script returned exit code 255
So this applies if you copied your .pem file as text and pasted in a variable in Jenkins.
You’ll find yourself with the load key invalid format error.
I would suggest to use tokens and Vault or Consul instead of pasting a SSH Key, but if you need to just solve this ASAP that’s the trick that you need.
First encode your key with base64 without any wrapping. This is done with this command:
Note that in this case I’m ignoring Strict Host Key Checking, which is not the preferred option for security, but you may want to use it depending on your strategy and characteristics of your Cloud Deployments.
Note also that I’m indicating as User Known Hosts File /dev/null. That is something you may want to have is you provision using Docker Containers that immediately destroyed after and Jenkins has not created the user properly and it is unable to write to ~home/.ssh/known_hosts
I mention the typical errors where engineers go crazy and spend more time fixing.
Equitas Health helps thousands of HIV-positive in Ohio, Dayton and Columbus.
Thousands more are reached with our prevention, testing, and other services. We are excited about embracing our expanded mission as a strategic step to further that legacy and its reach by providing care for all – with a focus on a safe and open space and highest quality healthcare for the LGBTQ community and others who are medically underserved.
I did my donation following a post by Terra Field, a former colleague at Blizzard and later leading Netflix’s Trans *ERG, but I didn’t see that she organized a gofund campaign, so I donated again :)
As I saw that there is a lack of clarity in the articles about this theme.
I also provided two alternatives ways, one pure Python3 and the other Bash based (grep awk tr)
Books
The books I publish in LeanPub have two prices, the suggested price, which is the price I consider the right price for the book, and the minimum price, which is the minimum price I authorized a reader can pay to have it.
You can buy it for the minimum price. You know better than anyone your economy.
So when a reader buys one of my books for the suggested price, instead of the minimum price, it’s really showing how they appreciate may work.
So thanks for all the support and appreciation you show!. :)
One of the motives I chose Leanpub platform is because I think is fair. No DRM, no BS. And the reader can ask for a refund within 45 days if they don’t like the book. It also makes very happy seeing that I don’t have any refunds. I appreciate it as a token of the usefulness of my work. Thanks. :)
Updates to Docker Combat File book (v.16 2021-11-24)
I added a nice trick to reverse engineering the original Dockerfile from a running Image.
I also added another typical copy and paste error into the Troubleshoot section.
Automating and Provisioning Amazon AWS (EC2, EBS, S3, CloudWatch) with boto3 (Amazon’s SDK for Python 3) and Python 3 book
I’m writing a book about how to automate your Amazon AWS tasks using Amazon’s AWS Python 3 SDK boto3, provisioning new instances, stopping, starting, creating volumes, creating/deleting buckets in S3, uploading/downloading files from S3…
It is currently 20% completed. With 43 pages it shows EC2 section already.
I’ve working in carleslibs v.1.0.3. I added MenuUtils class, which allows to assemble menus super quickly, that execute the code referenced in the menu array. Ideal for building CLI applications very fast.
I also added KeyboardUtils class, which allows to ask the user for String within certain lengths allowing or not spaces and/or underscores, and ask user for Integer values within a certain min and max, having 0 for go back.
The plan is to release the new version of carleslibs as soon as I’ve tested it properly.
sudo apt install python2 python3 python3-pip
# Install boto for Python 2 for Ansible (alternative way if pip install boto doesn't work for you)
python2 -m pip install boto
# Install Ansible
sudo apt install ansible
If you want to use Dynamic Inventory
So you can use the Python 2 ec2.py and ec2.ini files, adding them as to the /etc/ansible with mask +x, to use the Dynamic Inventory.
Then use the calls inside the shell script, or assuming that the previous file was named credentiasl.sh use source credentials.sh
ec2.py is written in Python 2, so probably will fail for you as it is invoked by python and your default interpreter will be Python 3.
So edit the first line of /etc/ansible/ec2.py and add:
#!/bin/env python2
Once credentials.sh is sourced, then you can just invoke ec2.py to get the list of your Instances in a JSON format dumped by ec2.py
/etc/ansible/ec2.py --list
You can get that JSON file and load it and get the information you need, filtering by group.
You can call:
/etc/ansible/ec2.py --list > instances.json
Or you can run a Python program that escapes to shell and executes ec2.py –list and loads the Output as a JSON file.
I use my carleslibs here to escape to shell using my class SubProcessUtils. You can install them, they are Open Source, or you can code manually if you prefer importing subprocess Python library and catching the stdout, stderr.
import json
from carleslibs import SubProcessUtils

if __name__ == "__main__":
    s_command = "/etc/ansible/ec2.py"

    o_subprocess = SubProcessUtils()
    i_error_code, s_output, s_error = o_subprocess.execute_command_for_output(s_command, b_shell=True, b_convert_to_ascii=True, b_convert_to_utf8=False)
    if i_error_code != 0:
        print("Error escaping to shell!", i_error_code)
        print(s_error)
        exit(1)

    json = json.loads(s_output)

    d_hosts = json["_meta"]["hostvars"]

    for s_host in d_hosts:
        # You'll get a ip/hostnamename in s_host which is the key
        # You have to check for groups and the value for the key Name, in order to get the Name of the group
        # As an exercise, print(d_hosts[s_host]) and look for:
        # @TODO: Capture the s_group_name
        # @TODO: Capture the s_addres
        if s_group_name == "yourgroup":
             # This filters only the instances with your group name, as you want to create an inventory file just for them
             # That's because you don't want to launch the playbook for all the instances, but for those in your group name in the inventory file.
             a_hostnames.append(s_address)

    # After this you can parse you list a_hostnames and generate an inventory file yourinventoryfile
    # The [ec2hosts] in your inventory file must match the hosts section in your yaml files
    # You'll execute your playbook with:
    # ansible-playbook -i yourinventoryfile youryamlfile.yaml
So an example of a yaml to install Apache2 in Ubuntu 20.04 LTS spawned instances , let’s call it install_apache2.yaml would be:
---
- name: Update web servers
  hosts: ec2hosts
  remote_user: ubuntu

  tasks:
  - name: Ensure Apache is at the latest version
    apt:
      name: apache2
      state: latest
      update_cache: yes
    become: yes
As you can see the section hosts: in the YAML playbook matches the [ec2hosts] in your inventory file.
You can choose to have your private key certificate .pem file in /etc/ansible/ansible.cfg or if you want to have different certificates per host, add them after the ip/address in your inventory file, like in this example:
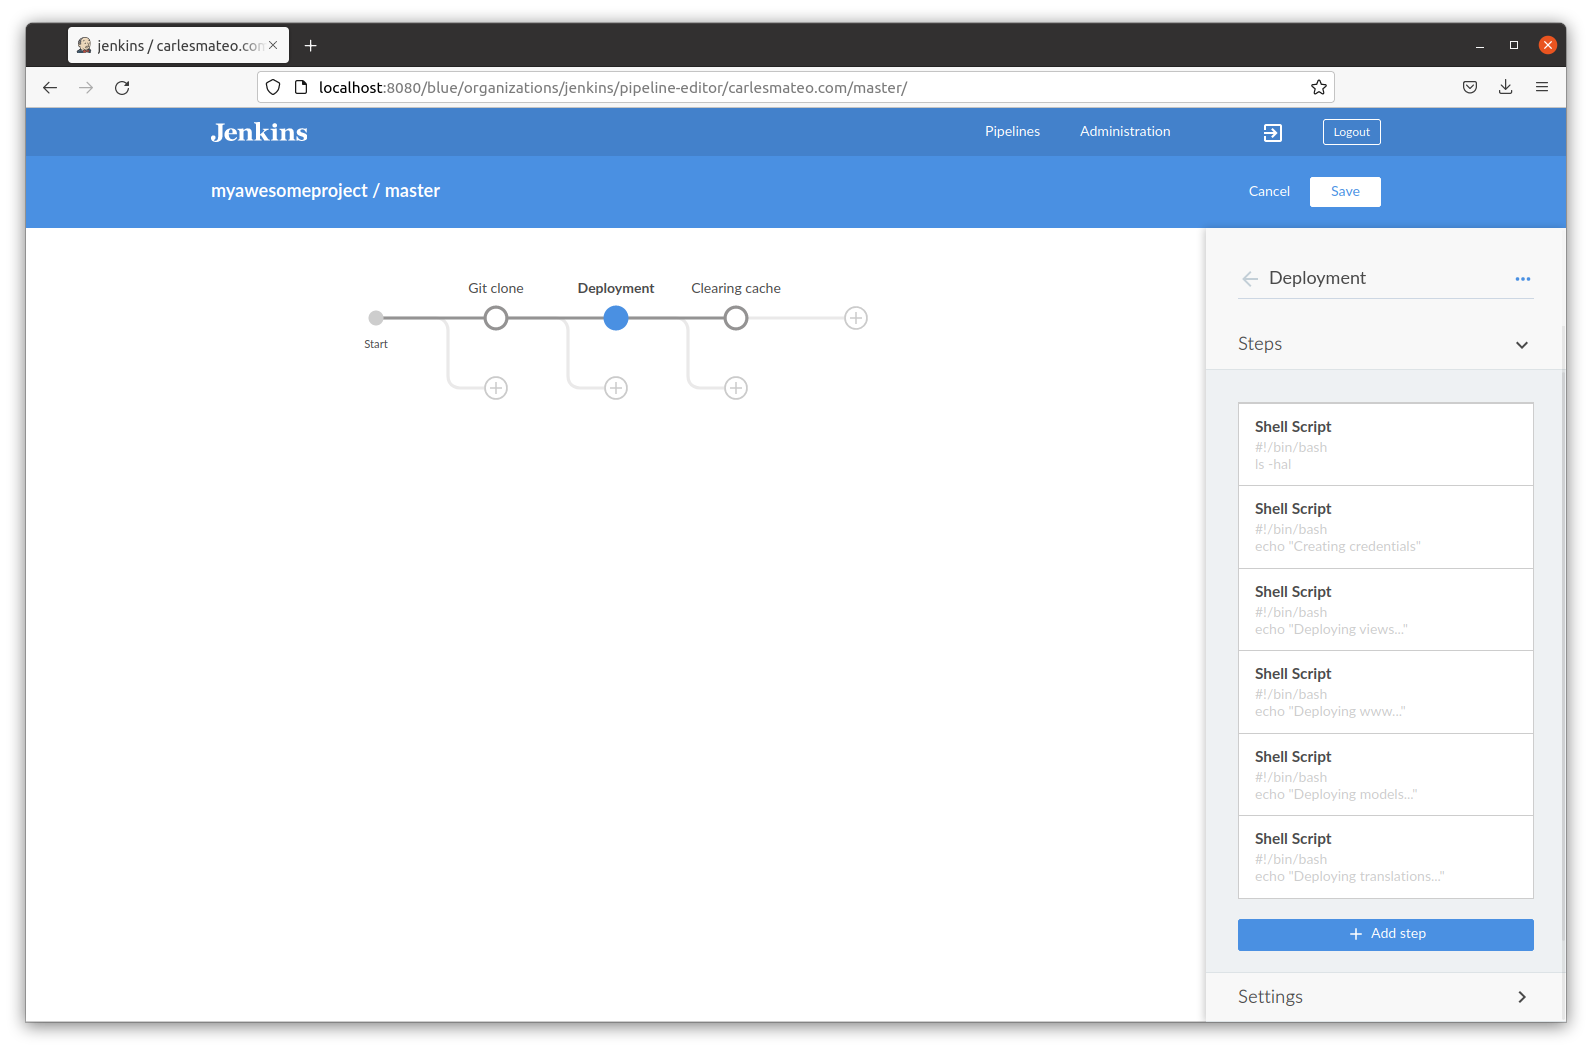
The first method is to use add_host to print in the screen the properties form the ec2 Instances provisioned.
The trick is to escape to shell, executing ansible-playbook and capturing the output, then parsing the text looking for the ‘public_ip:’
This is the Python 3 code I created:
class AwesomeAnsible:

    def extract_public_ips_from_text(self, s_text=""):
        """
        Extracts the addresses returned by Ansible
        :param s_text:
        :return: Boolean for success, Array with the Ip's
        """

        b_found = False
        a_ips = []

        i_count = 0
        while True:
            i_count += 1
            if i_count > 20:
                print("Breaking look")
                break
            s_substr = "'public_ip': '"
            i_first_pos = s_text.find(s_substr)
            if i_first_pos > -1:
                s_text_sub = s_text[i_first_pos + len(s_substr):]
                # Find the ending delimiter
                i_second_pos = s_text_sub.find("'")
                if i_second_pos > -1:
                    b_found = True
                    s_ip = s_text_sub[0:i_second_pos]
                    a_ips.append(s_ip)
                    s_text_sub = s_text_sub[i_second_pos:]
                    s_text = s_text_sub
                    continue

            # No more Ip's
            break

        return b_found, a_ips
Then you’ll use with something like:
        # Catching the Ip's from the output
        b_success, a_ips = self.extract_public_ips_from_text(s_output)
        if b_success is True:
            print("Public Ips:")
            s_ips = ""
            for s_ip in a_ips:
                print(s_ip)
                s_ips = s_ips + self.get_ip_text_line_for_inventory(s_ip)
            print("Adding Ips to group1_inventory file")
            self.o_fileutils.append_to_file("group1_inventory", s_ips)
            print()
The get_ip_text_line_for_inventory_method() returns a line for the inventory file, with the ip and the key to use separated by a tab (\t):
    def get_ip_text_line_for_inventory(self, s_ip, s_key_path="ansible.pem"):
        """
        Returns the line to add to the inventory, with the Ip and the keypath
        """
        return s_ip + "\tansible_ssh_private_key_file=" + s_key_path + "\n"
Once you have the inventory file, like this below, you can execute the playbook for your group of hosts:
You can run this Bash Shell Script to get only the public ips when you provision to Amazon AWS EC2 the Instances from your group named group1 in this case:
I set again the credentials because as this Bash Shell Script is invoked from Python, there are not sourced.
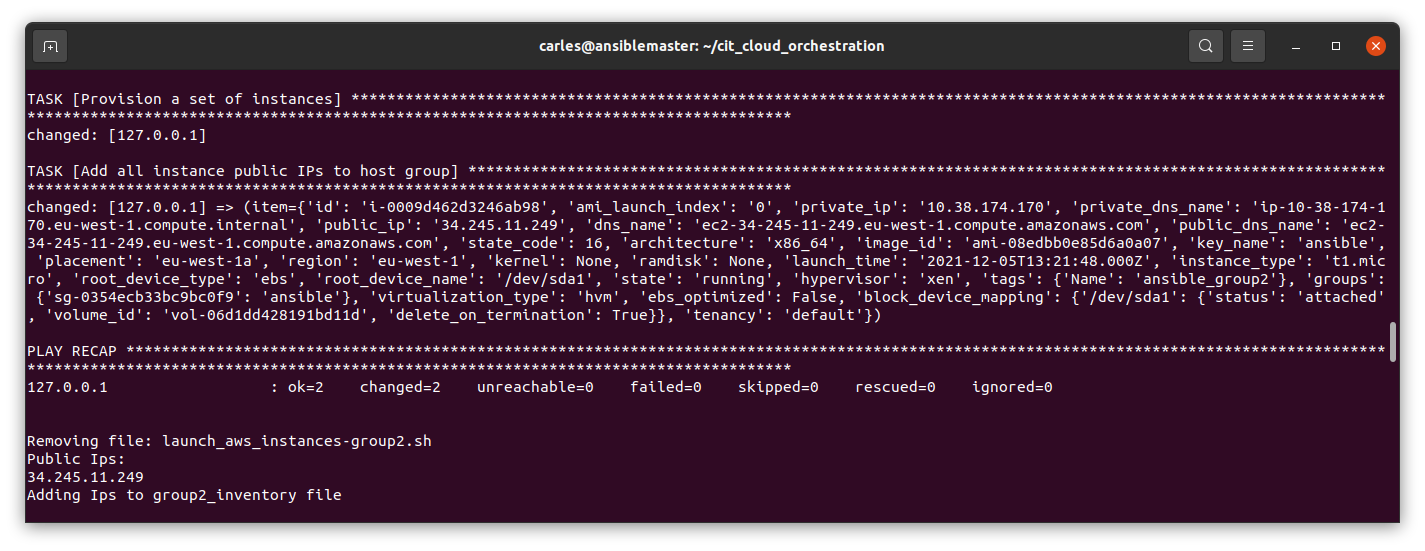
The trick in here is that the launch_aws_instances-group1.yaml file has a task to add the hosts to Ansible’s in memory inventory, and to print the information.
That output is what I scrap from Python and then I use extract_public_ips_from_text() showed before.
So my launch_aws_instances-group1.yaml (which I generate from Python customizing the parameter) looks like this:
In this case I use t1.micro cause I provision to EC2-Classic and not to the default VPC, otherwise I would use t2.micro.
So I have a Security Group named ansible created in Amazon AWS EC2 console as EC2-Classic, and not as VPC.
In this Security group I opened the Inbound HTTP Port and the SSH port for the Ip from I’m provisioning, so Ansible can SSH using the Key ansible.pem
The Public Key has been created and named ansible as well (section key_name under ec2).
The Image used is Ubuntu 20.04 LTS (free tier) for the region eu-west-1 which is my wonderful Ireland.
For the variables (vars) I use the MT Notation, so the prefixes show exactly what we are expecting s_ for Strings i_ for Integers and I never have collisions with reserved names.
It is very important to use the count_tag and instance_tags with the name of the group, as the actions will be using that group name. Remember the idempotency.
The task with the add_host is the one that makes the information for the instances to be displayed, like in this screenshot.
#!/bin/bash

# By Carles Mateo - https://blog.carlesmateo.com
# Compress older than two days files.
# I use for logs and core dumps. Normally at /var/core/

# =======================================================0
# FUNCTIONS
# =======================================================0


function quit {
    # Quits with message in param1 and error code in param2
    s_MESSAGE=$1
    i_EXIT_CODE=$2

    echo $s_MESSAGE
    exit $i_EXIT_CODE
}

function add_ending_slash {
    # Check if Path has ending /
    s_LAST_CHAR_PATH=$(echo $s_PATH | tail -c 2)

    if [ "$s_LAST_CHAR_PATH" != "/" ];
    then
        s_PATH="$s_PATH/"
    fi
}

function get_list_files {
    # Never follow symbolic links
    # Show only files
    # Do not enter into subdirs
    # Show file modified more than X days ago
    # Find will return the path already
    s_LIST_FILES=$(find -P $s_PATH -maxdepth 1 -type f -mtime +$i_DAYS | tr " " "|")
}

function check_dir_exists {
    s_DIRECTORY="$1"
    if [ ! -d "$s_DIRECTORY" ];
    then
        quit "Directory $s_DIRECTORY does not exist." 1
    fi
}

function compress_files {
    echo "Compressing files from $s_PATH modified more than $i_DAYS ago..."
    for s_FILENAME in $s_LIST_FILES
    do
        s_FILENAME_SANITIZED=$(echo $s_FILENAME | tr "|" " ")
        s_FILEPATH="$s_PATH$s_FILENAME_SANITIZED"
        echo "Compressing $s_FILENAME_SANITIZED..."
        # Double quotes around $s_FILENAME_SANITIZED avoid files with spaces failing
        gzip "$s_FILENAME_SANITIZED"
        i_ERROR=$?
        if [ $i_ERROR -ne 0 ];
        then
            echo "Error $i_ERROR happened"
        fi
    done

}


# =======================================================0
# MAIN PROGRAM
# =======================================================0

# Check Number of parameters
if [ "$#" -lt 1 ] || [ "$#" -gt 2 ];
then
    quit "Illegal number of parameters. Pass a directory and optionally the number of days to exclude from mtime. Like: compress_old.sh /var/log 2" 1
fi

s_PATH=$1

if [ "$#" -eq 2 ];
then
    i_DAYS=$2
else
    i_DAYS=2
fi

add_ending_slash

check_dir_exists $s_PATH

get_list_files

compress_files
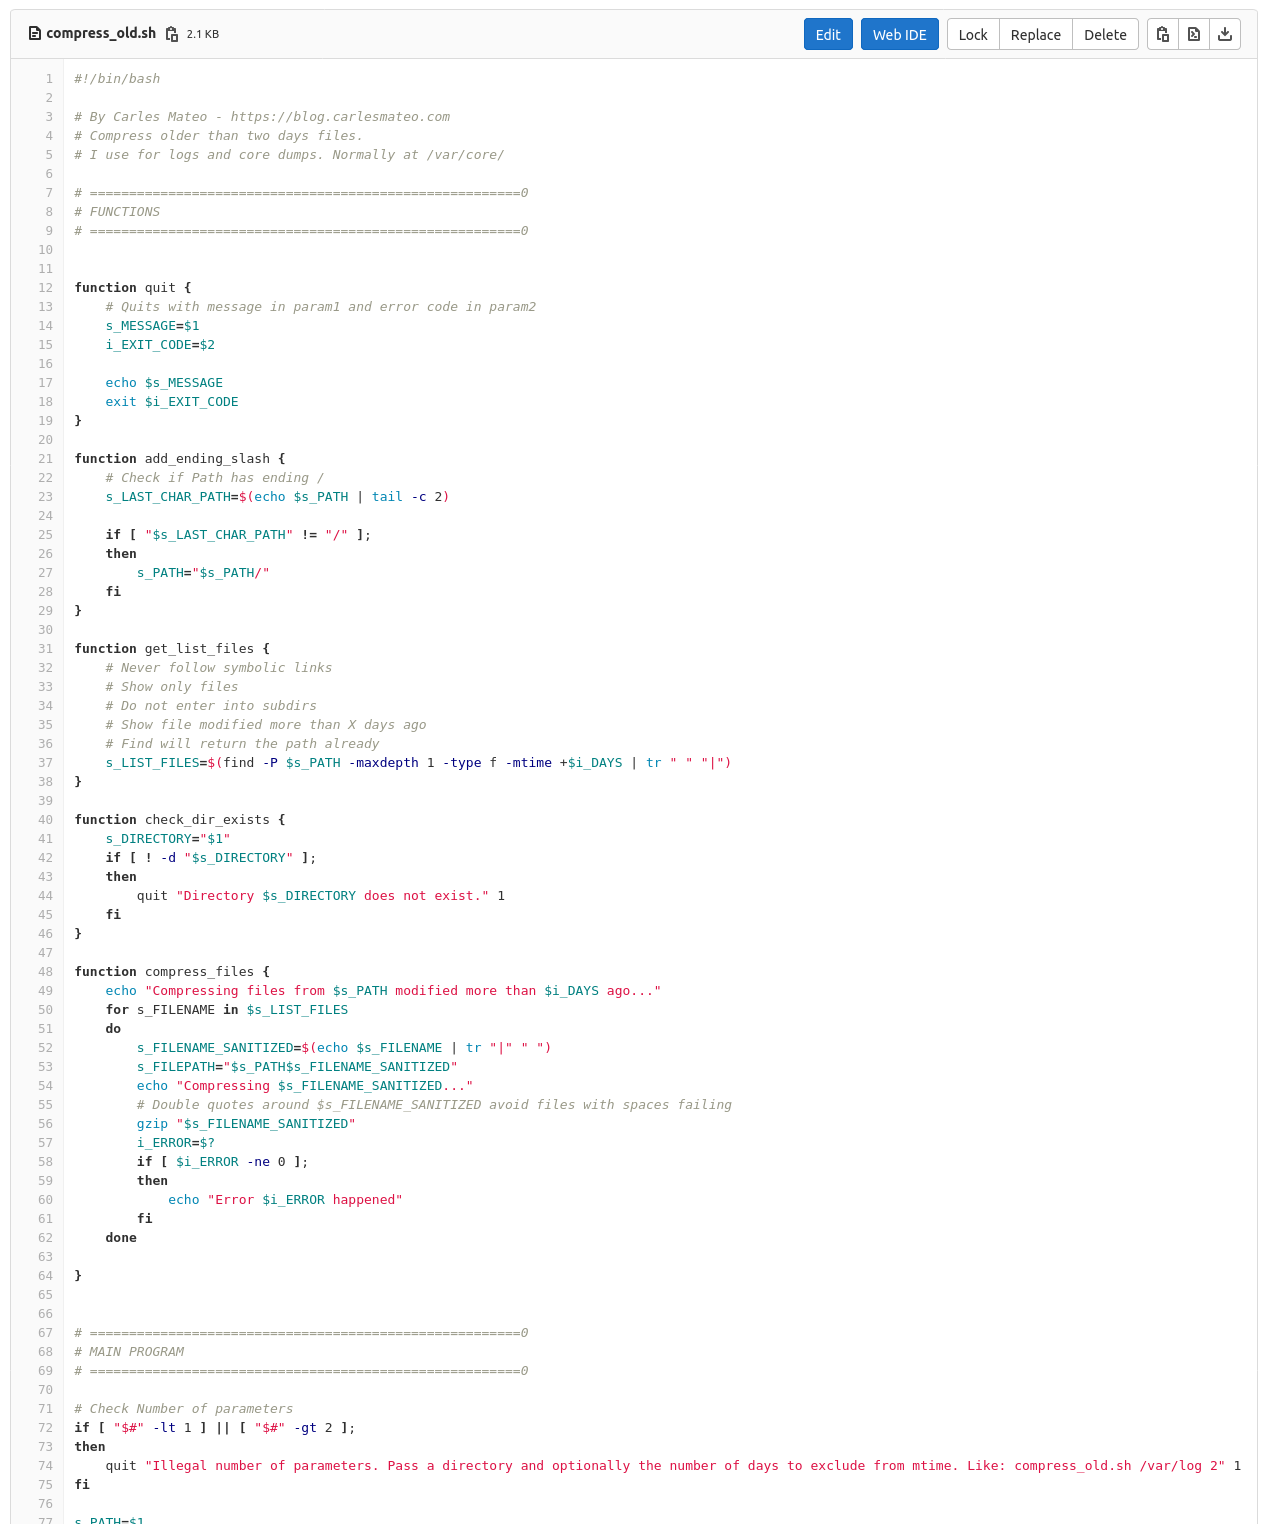
Fragment of the code in gitlab
If you want to compress everything in the current directory, event files modified today run with:
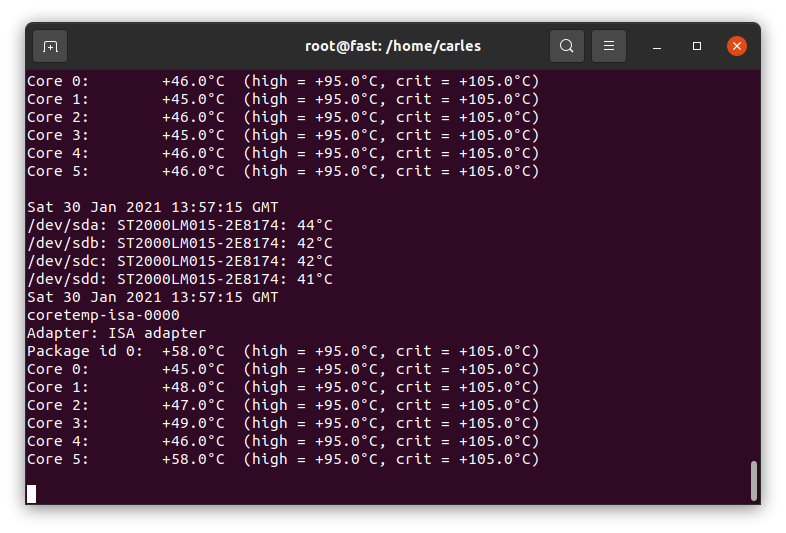
I’ve been helping to troubleshoot the reason one Commodity Server (with no iDrac/Ilo ipmi) is powering off randomly. One of the hypothesis is the temperature.
This is a very simple script that will print the temperature of the HDDs and the CPU and keep to a log file.
First you need to install hddtemp and lm-sensors:
sudo apt install hddtemp lm-sensors
Then this is the one line script, that you should execute as root:
while [ true ]; do date | tee -a /var/log/hddtemp.log; hddtemp /dev/sda /dev/sdb /dev/sdc /dev/sdd | tee -a /var/log/hddtemp.log; date | tee -a /var/log/cputemp.log; sensors | tee -a /var/log/cputemp.log; sleep 2; done
Feel free to change sleep 2 for the number of seconds you want to wait, like sleep 10.
Press CTRL + C to interrupt the script at any time.
You can execute this inside a screen session and leave it running in Background.
Note that I use tee command, so the output is print to the screen and to the log file.
Is something very simple, but will help my student friends to validate Input from Keyboard without losing too many hours.
The Input Validation Classes I create in PHP for Privalia or in my PHP Catalonia Framework, are much, much, more powerful, allowing the validation of complete forms, rendering errors, etc… although they were created for Web, and not for Keyboard input.
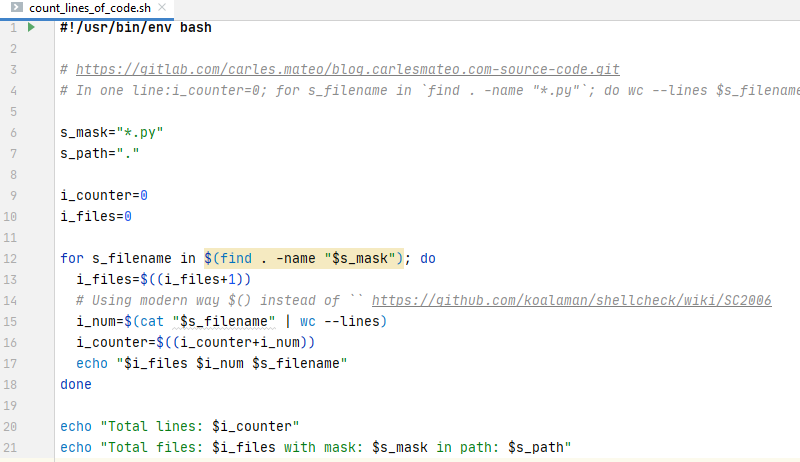
It recursively goes to all the subdirectories looking for .py files, and then it counts the lines.
I updated the price of my books to be the minimum allowed by LeanPub, to $5 USD, and created a bundle of two of them for $7 USD.
So people can benefit from this during the lock down.
I’ve updated the Python Combat Guide book with a sample of using Paramiko Libraries for SSH, and increased the Object Oriented Programing and Unit Testing, sections. I also added some books to the Bibliography.
I’ve read the postmortem initial analysis from Slack’s incident. It’s really interesting.
I cannot share it, but I guess that at some point they will publish it on their blog:
I’m teaching a friend how to code. Covid-19 has affected many people, with many jobs loss in many sectors. I encouraged him to learn to code and I helped him to access to a course offered by the Catalan government, but they let him down with a really difficult exam in the very last moment.
I encouraged him to continue and offered to help him, and after a start with several courses via Internet, that were not very useful, I started teaching and training him personally. And I did the way the companies need: Python, PyCharm, Git, Linux, VirtualBox, Web…
I told him since the beginning that I can help him, yes, but 90% has to come from his effort. I’m really happy to see that he is really doing the effort and how much he advanced.
Was not easy as I had to combine it with the classes in the university, my work, the Open Source projects, and my life… but I’m proud of him and of the effort he is doing.
Today he remembered me how shocked he was when I showed some Python builtin libraries, like datetime, and he saw in PyCharm, that the code of that library alone, has 2,476 lines.
I wanted to explain that we can get to create a program with thousands of lines of code, easily, so I decided to write a small program to count the number of lines of our programs.
I quickly wrote it in bash in one single line:
i_counter=0; for s_filename in `find . -name "*.py"`; do wc --lines $s_filename; i_num=`cat $s_filename | wc --lines`; i_counter=$((i_counter+i_num)); done; echo "Total lines: $i_counter"
Execute it from inside your directory.
It can be improved and optimized very easily.
wc is executed so it prints the lines and the filename, and then is executed as a pipe from cat to capture just the number, so the first one is not really needed. The same can be achieved with echo as we have the variables $s_filename and $i_counter
You can filter out test files or others by using the find options or grep -v, for example to exclude test directories or files.
Number of files can very easily added too.
Using “” for avoiding problems with files with spaces.
The better and most modern $() way to execute, instead of “ can be used.
I made some improvements abovementioned and uploaded this as a several lines script:
One of my colleagues showed me dstat, a very nice tool for system monitoring, and bandwidth of a drive monitoring. Also ifstat, as complement to iftop is very cool for Network too. This functionality is also available in CTOP.py
As I shared in the past news of the blog, I’m resuming my contributions to ZFS Community.
Long time ago I created some ZFS tools that I want to share soon as Open Source.
I equipped myself with the proper Hardware to test on SAS and SATA:
12G Internal PCI-E SAS/SATA HBA RAID Controller Card, Broadcom’s SAS 3008, compatible for SAS 9300-8I. This is just an HDA (Host Data Adapter), it doesn’t support RAID. Only connects up to 8 drives or 1024 through expander, to my computer. It has a bandwidth of 9,600 MB/s which guarantees me that I’ll be able to add 12 SAS SSD Enterprise grade at almost the max speed of the drives. Those drives perform at 900 MB/s so if I’m using all of them at the same time, like if I have a pool of 8 + 3 and I rebuild a broken drive or I just push Data, I would be using 12×900 = 10,800 MB/s. Close. Fair enough.
VANDESAIL Mini-SAS Cables, 1m Internal Mini-SAS to 4x SAS SATA Forward Breakout Cable Hard Drive Data Transfer Cable (SAS Cable).
SilverStone SST-FS212B – Aluminium Trayless Hot Swap Mobile Rack Backplane / Internal Hard Drive Enclosure for 12x 2.5 Inch SAS/SATA HDD or SSD, fit in any 3x 5.25 Inch Drive Bay, with Fan and Lock, black
Terminator is here. I ordered this T-800 head a while ago and finally arrived.
Finally I will have my empty USB keys located and protected. ;)
There are many robots scanning sites for vulnerabilities, to gain control or exploit the servers. Most of them come from China and Russia ip’s.
Here I explain an easy way to block them using the Ubuntu Firewall ufw.
If you use a CMS like WordPress and you know there are extensions that have had security exploits, for example, wp-file-manager then you can search directly for this request in Apache Access Logs.
In the example we look for the access.log file, for the rotated access.log.1 and for the rotated and compressed access.log.2.gz. We use the tool zcat which does a cat over a compressed file.
If we don’t expect to have anybody posting to our xmlrpc Service, we can check for the offending Ip’s by doing:
You can identify manually what are attacks, and what are legit requests.
After you have your definitive list of offending Ip’s (and make sure you didn’t introduce yours accidentally), then you can execute the second part of the script:
echo '#!/bin/bash' > add_ufw_rules.sh

i_COUNTER_RULE=0; for s_OFFENDING_IP in $(cat 2020-10-03-offending-ips.txt); do i_COUNTER_RULE=$((i_COUNTER_RULE+1)); echo "ufw insert $i_COUNTER_RULE deny from $s_OFFENDING_IP to any" >> add_ufw_rules.sh; done

echo "ufw status numbered" >> add_ufw_rules.sh
echo "sudo ufw allow OpenSSH" >> add_ufw_rules.sh
echo "sudo ufw allow 22/tcp" >> add_ufw_rules.sh
echo 'sudo ufw allow "Apache Full"' >> add_ufw_rules.sh
echo "sudo ufw enable" >> add_ufw_rules.sh
Then you less your file add_ufw_rules.sh to see everything is Ok:
#!/bin/bash
ufw insert 1 deny from 40.79.250.88 to any
ufw insert 2 deny from 52.173.148.212 to any
ufw insert 3 deny from 94.103.85.175 to any
ufw insert 4 deny from 40.79.250.88 to any
ufw insert 5 deny from 78.85.208.240 to any
ufw insert 6 deny from 80.82.68.173 to any
ufw insert 7 deny from 188.165.230.118 to any
ufw insert 8 deny from 195.201.117.103 to any
ufw insert 9 deny from 40.79.250.88 to any
ufw insert 10 deny from 5.135.138.188 to any
ufw insert 11 deny from 51.116.189.135 to any
...
ufw insert 223 deny from 95.173.161.167 to any
ufw insert 224 deny from 95.84.228.227 to any
ufw status numbered
sudo ufw allow OpenSSH
sudo ufw allow 22/tcp
sudo ufw allow "Apache Full"
sudo ufw enable
Then you simply give permissions with chmod +x add_ufw_rules.sh and run the script to apply.
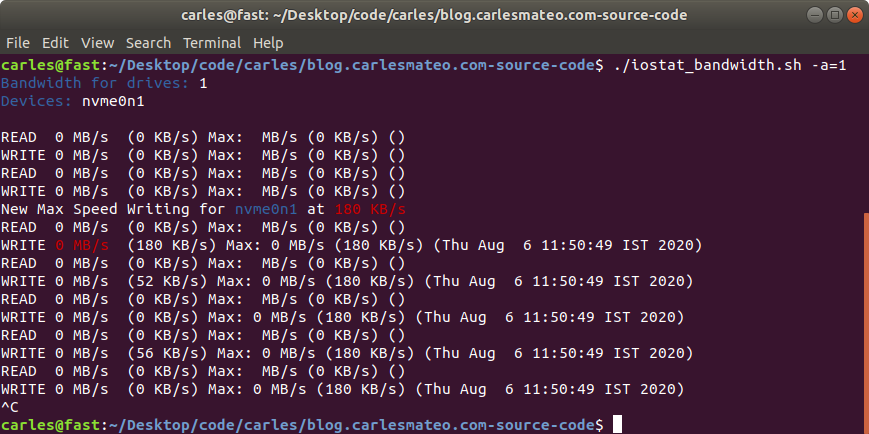
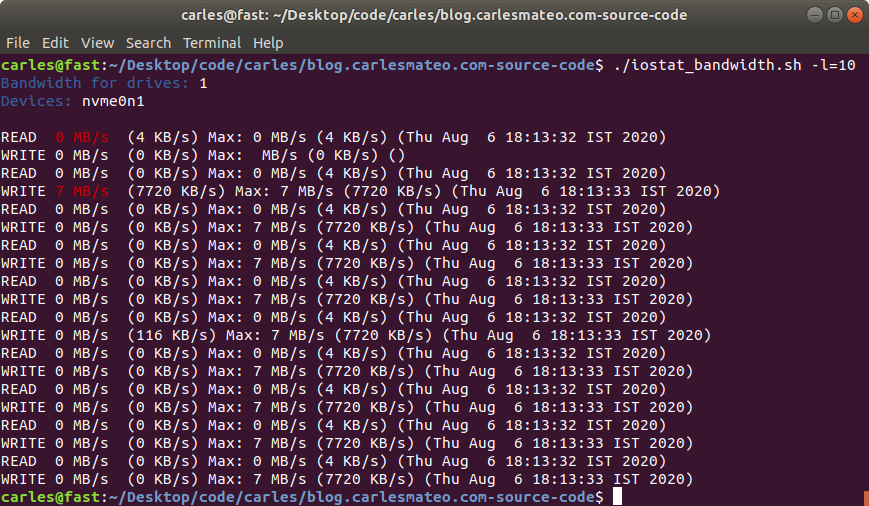
This is a shell script I made long time ago and I use it to monitor in real time what’s the total or individual bandwidth and maximum bandwidth achieved, for READ and WRITE, of Hard drives and NMVe devices.
It uses iostat to capture the metrics, and then processes the maximum values, the combined speed of all the drives… has also an interesting feature to let out the booting device. That’s very handy for Rack Servers where you boot from an SSD card or and SD, and you want to monitor the speed of the other (SAS probably) devices.
I used it to monitor the total bandwidth achieved by our 4U60 and 4U90 Servers, the All-Flash-Arrays 2U and the NVMe 1U units in Sanmina and the real throughput of IOC (Input Output Controllers).
I used also to compare what was the real data written to ZFS and mdraid RAID systems, and to disks and the combined speed with different pool configurations, as well as the efficiency of iSCSI and NFS from clients to the Servers.
You can specify how many times the information will be printed, whether you want to keep the max speed of each device per separate, and specify a drive to exclude. Normally it will be the boot drive.
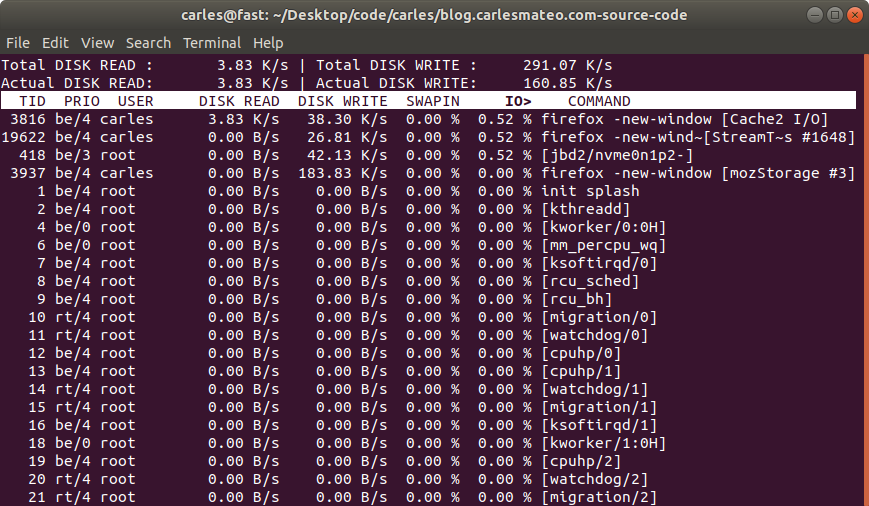
If you want to test performance metrics you should make sure that other programs are not running or using the swap, to prevent bias. You should disable the boot drive if it doesn’t form part of your tests (like in the 4U60 with an SSD boot drive in a card, and 60 hard drive bays SAS or SATA).
You may find useful tools like iotop.
You can find the code here, and in my gitlab repo:
#!/usr/bin/env bash

AUTHOR="Carles Mateo"
VERSION="1.4"

# Changelog
# 1.4
# Added support for NVMe drives
# 1.3
# Fixed Decimals in KB count that were causing errors
# 1.2
# Added new parameter to output per drive stats
# Counting is performed in KB

# Leave boot device empty if you want to add its activity to the results
# Specially thinking about booting SD card or SSD devices versus SAS drives bandwidth calculation.
# Otherwise use i.e.: s_BOOT_DEVICE="sdcv"
s_BOOT_DEVICE=""
# If this value is positive the loop will be kept n times
# If is negative ie: -1 it will loop forever
i_LOOP_TIMES=-1
# Display all drives separatedly
i_ALL_SEPARATEDLY=0
# Display in KB or MB
s_DISPLAY_UNIT="M"

# Init variables
i_READ_MAX=0
i_WRITE_MAX=0
s_READ_MAX_DATE=""
s_WRITE_MAX_DATE=""
i_IOSTAT_READ_KB=0
i_IOSTAT_WRITE_KB=0

# Internal variables
i_NUMBER_OF_DRIVES=0
s_LIST_OF_DRIVES=""
i_UNKNOWN_OPTION=0

# So if you run in screen you see colors :)
export TERM=xterm

# ANSI colors
s_COLOR_RED='\033[0;31m'
s_COLOR_BLUE='\033[0;34m'
s_COLOR_NONE='\033[0m'

for i in "$@"
do
    case $i in
        -b=*|--boot_device=*)
        s_BOOT_DEVICE="${i#*=}"
        shift # past argument=value
        ;;
        -l=*|--loop_times=*)
        i_LOOP_TIMES="${i#*=}"
        shift # past argument=value
        ;;
        -a=*|--all_separatedly=*)
        i_ALL_SEPARATEDLY="${i#*=}"
        shift # past argument=value
        ;;
        *)
        # unknown option
        i_UNKNOWN_OPTION=1
        ;;
    esac
done

if [[ "${i_UNKNOWN_OPTION}" -eq 1 ]]; then
    echo -e "${s_COLOR_RED}Unknown option${s_COLOR_NONE}"
    echo "Use: [-b|--boot_device=sda -l|--loop_times=-1 -a|--all-separatedly=1]"
    exit 1
fi

if [ -z "${s_BOOT_DEVICE}" ]; then
    i_NUMBER_OF_DRIVES=`iostat -d -m | grep "sd\|nvm" | wc --lines`
    s_LIST_OF_DRIVES=`iostat -d -m | grep "sd\|nvm" | awk '{printf $1" ";}'`
else
    echo -e "${s_COLOR_BLUE}Excluding Boot Device:${s_COLOR_NONE} ${s_BOOT_DEVICE}"
    # Add an space after the name of the device to prevent something like booting with sda leaving out drives like sdaa sdab sdac...
    i_NUMBER_OF_DRIVES=`iostat -d -m | grep "sd\|nvm" | grep -v "${s_BOOT_DEVICE} " | wc --lines`
    s_LIST_OF_DRIVES=`iostat -d -m | grep "sd\|nvm" | grep -v "${s_BOOT_DEVICE} " | awk '{printf $1" ";}'`
fi

AR_DRIVES=(${s_LIST_OF_DRIVES})
i_COUNTER_LOOP=0
for s_DRIVE in ${AR_DRIVES};
do
    AR_DRIVES_VALUES_AVG[i_COUNTER_LOOP]=0
    AR_DRIVES_VALUES_READ_MAX[i_COUNTER_LOOP]=0
    AR_DRIVES_VALUES_WRITE_MAX[i_COUNTER_LOOP]=0
    i_COUNTER_LOOP=$((i_COUNTER_LOOP+1))
done


echo -e "${s_COLOR_BLUE}Bandwidth for drives:${s_COLOR_NONE} ${i_NUMBER_OF_DRIVES}"
echo -e "${s_COLOR_BLUE}Devices:${s_COLOR_NONE} ${s_LIST_OF_DRIVES}"
echo ""

while [ "${i_LOOP_TIMES}" -lt 0 ] || [ "${i_LOOP_TIMES}" -gt 0 ] ;
do
    s_READ_PRE_COLOR=""
    s_READ_POS_COLOR=""
    s_WRITE_PRE_COLOR=""
    s_WRITE_POS_COLOR=""
    # In MB
    # s_IOSTAT_OUTPUT_ALL_DRIVES=`iostat -d -m -y 1 1 | grep "sd\|nvm"`
    # In KB
    s_IOSTAT_OUTPUT_ALL_DRIVES=`iostat -d -y 1 1 | grep "sd\|nvm"`
    if [ -z "${s_BOOT_DEVICE}" ]; then
        s_IOSTAT_OUTPUT=`printf "${s_IOSTAT_OUTPUT_ALL_DRIVES}" | awk '{sum_read += $3} {sum_write += $4} END {printf sum_read"|"sum_write"\n"}'`
    else
        # Add an space after the name of the device to prevent something like booting with sda leaving out drives like sdaa sdab sdac...
        s_IOSTAT_OUTPUT=`printf "${s_IOSTAT_OUTPUT_ALL_DRIVES}" | grep -v "${s_BOOT_DEVICE} " | awk '{sum_read += $3} {sum_write += $4} END {printf sum_read"|"sum_write"\n"}'`
    fi

    if [ "${i_ALL_SEPARATEDLY}" -eq 1 ]; then
        i_COUNTER_LOOP=0
        for s_DRIVE in ${AR_DRIVES};
        do
            s_IOSTAT_DRIVE=`printf "${s_IOSTAT_OUTPUT_ALL_DRIVES}" | grep $s_DRIVE | head --lines=1 | awk '{sum_read += $3} {sum_write += $4} END {printf sum_read"|"sum_write"\n"}'`
            i_IOSTAT_READ_KB=`printf "%s" "${s_IOSTAT_DRIVE}" | awk -F '|' '{print $1;}'`
            i_IOSTAT_WRITE_KB=`printf "%s" "${s_IOSTAT_DRIVE}" | awk -F '|' '{print $2;}'`
            if [ "${i_IOSTAT_READ_KB%.*}" -gt ${AR_DRIVES_VALUES_READ_MAX[i_COUNTER_LOOP]%.*} ]; then
                AR_DRIVES_VALUES_READ_MAX[i_COUNTER_LOOP]=${i_IOSTAT_READ_KB}
                echo -e "New Max Speed Reading for ${s_COLOR_BLUE}$s_DRIVE${s_COLOR_NONE} at ${s_COLOR_RED}${i_IOSTAT_READ_KB} KB/s${s_COLOR_NONE}"
            echo
            fi
            if [ "${i_IOSTAT_WRITE_KB%.*}" -gt ${AR_DRIVES_VALUES_WRITE_MAX[i_COUNTER_LOOP]%.*} ]; then
                AR_DRIVES_VALUES_WRITE_MAX[i_COUNTER_LOOP]=${i_IOSTAT_WRITE_KB}
                echo -e "New Max Speed Writing for ${s_COLOR_BLUE}$s_DRIVE${s_COLOR_NONE} at ${s_COLOR_RED}${i_IOSTAT_WRITE_KB} KB/s${s_COLOR_NONE}"
            fi

            i_COUNTER_LOOP=$((i_COUNTER_LOOP+1))
        done
    fi

    i_IOSTAT_READ_KB=`printf "%s" "${s_IOSTAT_OUTPUT}" | awk -F '|' '{print $1;}'`
    i_IOSTAT_WRITE_KB=`printf "%s" "${s_IOSTAT_OUTPUT}" | awk -F '|' '{print $2;}'`

    # CAST to Integer
    if [ "${i_IOSTAT_READ_KB%.*}" -gt ${i_READ_MAX%.*} ]; then
        i_READ_MAX=${i_IOSTAT_READ_KB%.*}
        s_READ_PRE_COLOR="${s_COLOR_RED}"
        s_READ_POS_COLOR="${s_COLOR_NONE}"
        s_READ_MAX_DATE=`date`
        i_READ_MAX_MB=$((i_READ_MAX/1024))
    fi
    # CAST to Integer
    if [ "${i_IOSTAT_WRITE_KB%.*}" -gt ${i_WRITE_MAX%.*} ]; then
        i_WRITE_MAX=${i_IOSTAT_WRITE_KB%.*}
        s_WRITE_PRE_COLOR="${s_COLOR_RED}"
        s_WRITE_POS_COLOR="${s_COLOR_NONE}"
        s_WRITE_MAX_DATE=`date`
        i_WRITE_MAX_MB=$((i_WRITE_MAX/1024))
    fi

    if [ "${s_DISPLAY_UNIT}" == "M" ]; then
        # Get MB
        i_IOSTAT_READ_UNIT=${i_IOSTAT_READ_KB%.*}
        i_IOSTAT_WRITE_UNIT=${i_IOSTAT_WRITE_KB%.*}
        i_IOSTAT_READ_UNIT=$((i_IOSTAT_READ_UNIT/1024))
        i_IOSTAT_WRITE_UNIT=$((i_IOSTAT_WRITE_UNIT/1024))
    fi

    # When a MAX is detected it will be displayed in RED
    echo -e "READ  ${s_READ_PRE_COLOR}${i_IOSTAT_READ_UNIT} MB/s ${s_READ_POS_COLOR} (${i_IOSTAT_READ_KB} KB/s) Max: ${i_READ_MAX_MB} MB/s (${i_READ_MAX} KB/s) (${s_READ_MAX_DATE})"
    echo -e "WRITE ${s_WRITE_PRE_COLOR}${i_IOSTAT_WRITE_UNIT} MB/s ${s_WRITE_POS_COLOR} (${i_IOSTAT_WRITE_KB} KB/s) Max: ${i_WRITE_MAX_MB} MB/s (${i_WRITE_MAX} KB/s) (${s_WRITE_MAX_DATE})"
    if [ "$i_LOOP_TIMES" -gt 0 ]; then
        i_LOOP_TIMES=$((i_LOOP_TIMES-1))
    fi
done