This article explains how you can protect your WordPress site from attacks using my PHP Firewall WordPress plugin version 1.0.8.
This plugin is a commercial plugin, with one time fee, that it’s absolute worth it. It is not available as free plugin lite in WordPress.org. Only in my Software store. It is also available as PHP Firewall Drupal module.
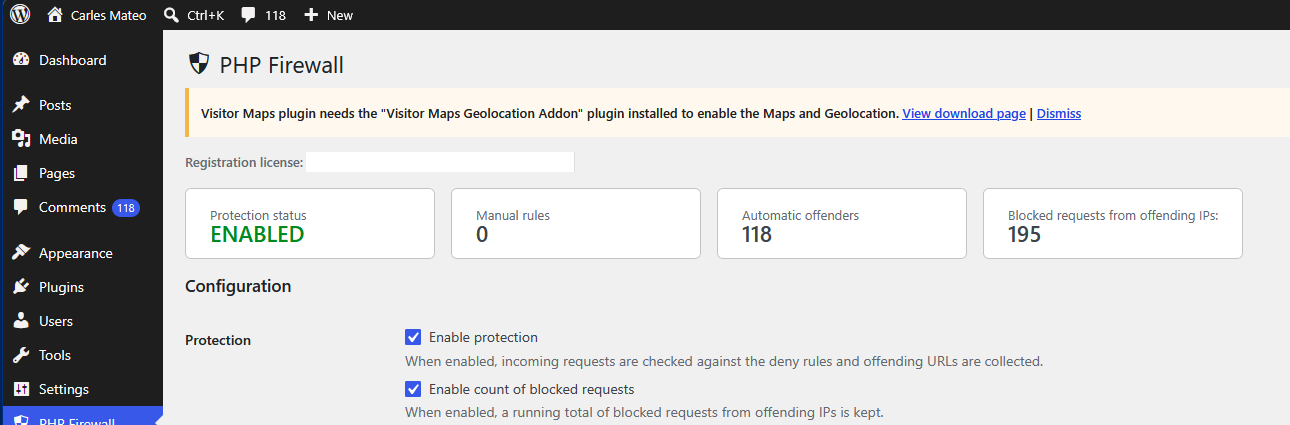
Once you install the plugin, you click in Enable protection and the Firewall will start to detect attempts to find exploits in your server automatically, and will block the offending IPs.
If you Enable count of blocked requests you’ll see than in few minutes, the Firewall has blocked hundreds of attempts.
In this example, I activated the protection, and after some time it has automatically detected and blocked 118 offending IP Addresses, and has blocked 195 malevolent requests.
In 36 hours the number of blocked requests will get to thousands:
Enabling the count of blocked requests makes a small update in the database to increment the counter, it’s a very lightweight operation, but it is worth it to get an idea of how many malevolent requests the software is blocking. You can enable it for an hour, see how many bad requests you get, and disable it if you want.
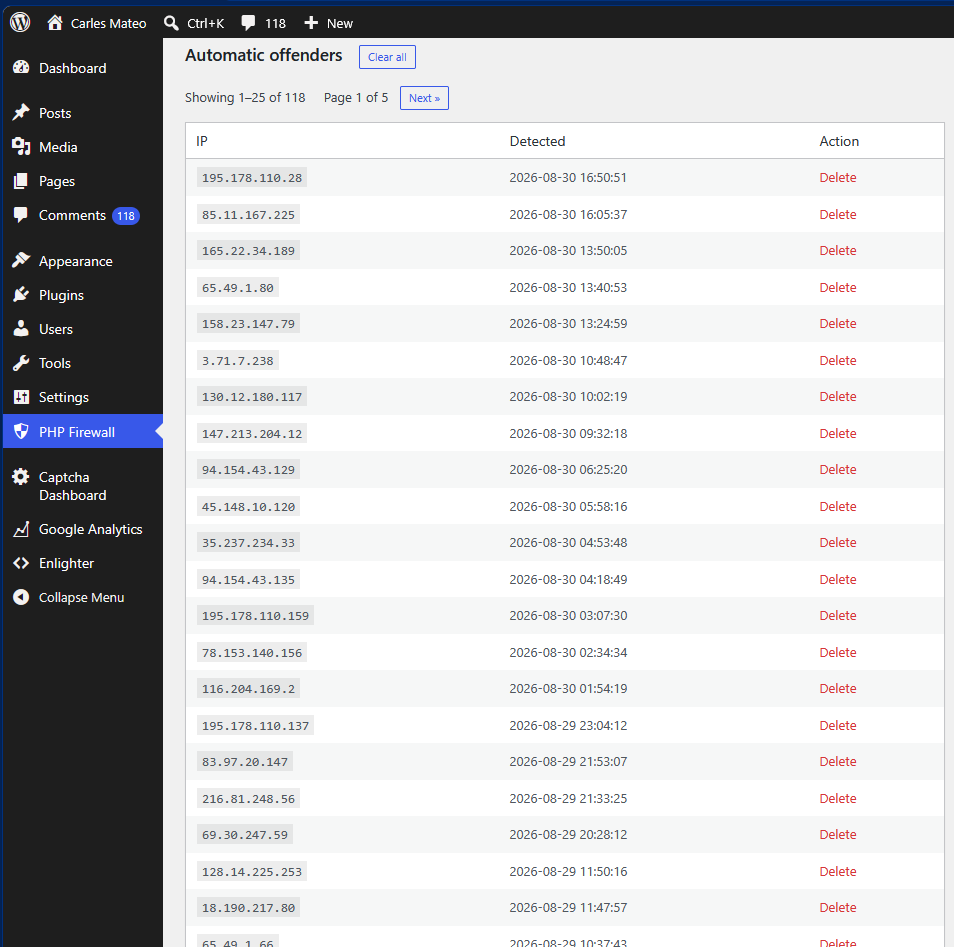
Once you activate the protection you will start to see IP Addresses that have been blocked because they attempted a known exploit, and the IPs have been added to the list of Automatic offenders.
This function is known as WAF or Web Application Firewall.
Once an IP is detected as offender, it will get a 403 Forbidden answer from the Server immediately, and the precious resources from the server will be saved (CPU, Memory, Internet bandwidth).
If you want, you can delete the IP from the list to allow it access again (for example, if a colleague was doing a test).
As you see, you will get many IP from attackers blocked in a short window of time.
The reality is that bots are trying exploits against random IP Addresses all the times, and some times your server will go very slow because of all those bots trying to hack into your server, and your visitors will experience slow loading pages or even the server may crash due to all these bots activity. Also, depending on your Cloud provider, you may be paying for Internet Outgoing traffic that is consumed by bots.
So this plugin is a must have, in my opinion as Engineer. That’s why I created it. Because many people was asking for help.
But there are other types of abuse. For example, malicious bots will try to get access to your blog by doing requests with random passwords to wp-login.php every second.
The Firewall cannot block this route by default because is the route that legit users use to login to WordPress. But we have functionalities in the plugin to deal with these attacks (without having to analyse the web server logs, which is a task that System Administrators and Site Reliability Engineers do).
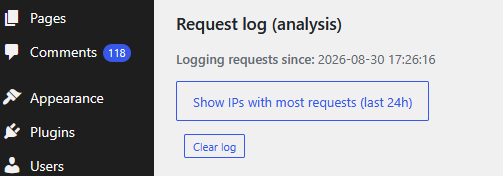
Activate Enable log of non blocked requests for analysis
This will record every allowed request (not the blocked ones), so we can analyse them.
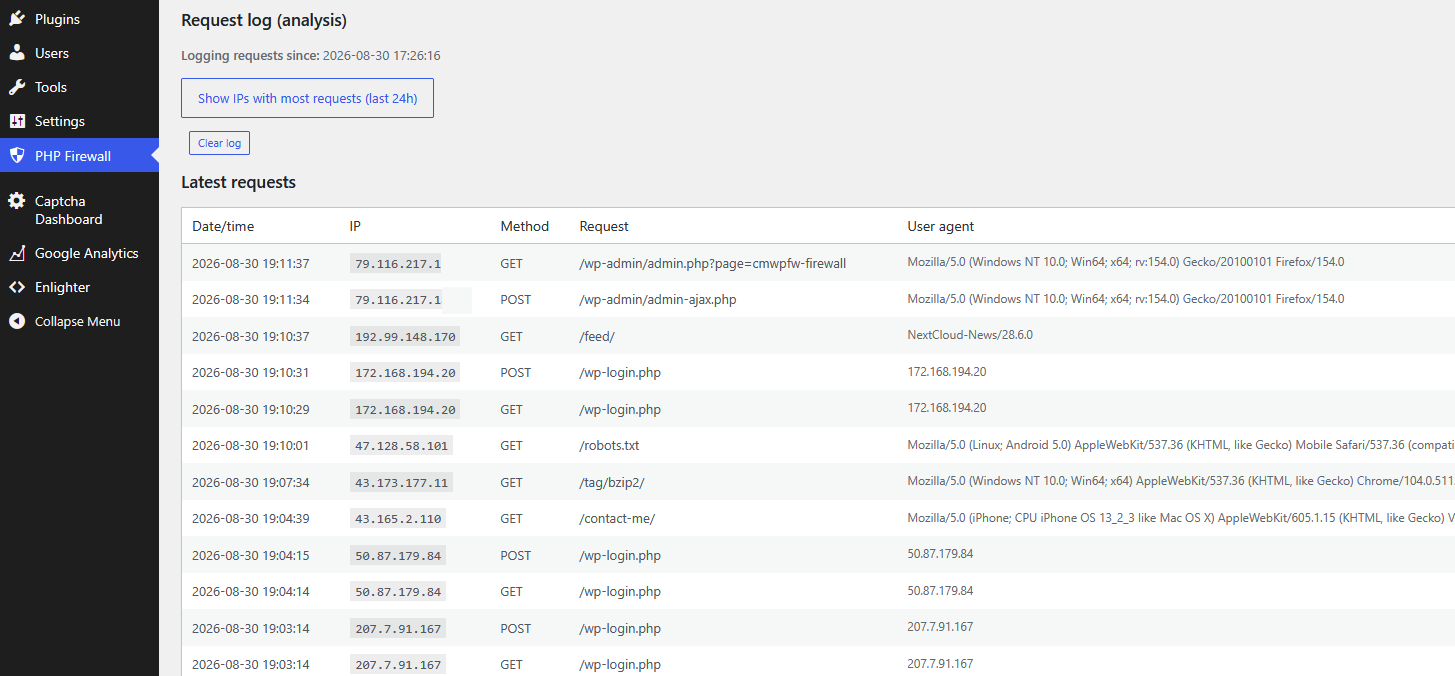
Just scroll down, to Latest requests
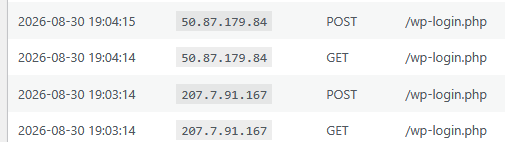
As you can see there are IP Addresses that did a POST to /wp-login.php
That means that attempted to login in your site. So, they tried a password to hack your WordPress site.
Those IP Addresses are attempting to login every second or every two seconds.
These kind of attacks are not only bad, as they can get access to your site, they can also degrade the health of your database.
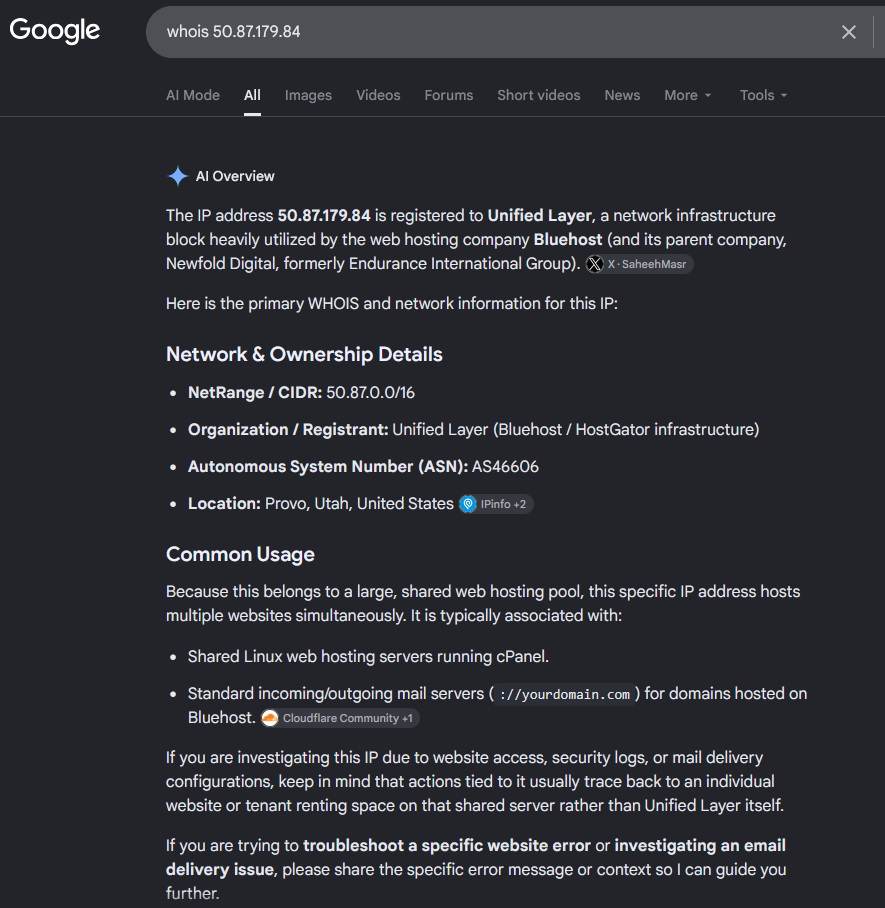
You can investigate where these IP’s come from doing a Whois search, or asking Google: whois 50.87.179.84
So, it’s a hosting from Bluehost / HostGator, a Cloud Provider. Servers from Cloud providers are typically hacked to try to hack other servers.
You can block the IP directly in the PHP Firewall using the custom rules, or as you can see in the information provider, this Cloud Provider has a NetRange / CIDR of 50.87.0.0/16.
A block /16 comprises 65,536 IP Addresses, so you’ll probably get attacks from many different IP’s in from that block. Instead of blocking just the IP that attacked your site, my approach is to block all the IP’s from that block.
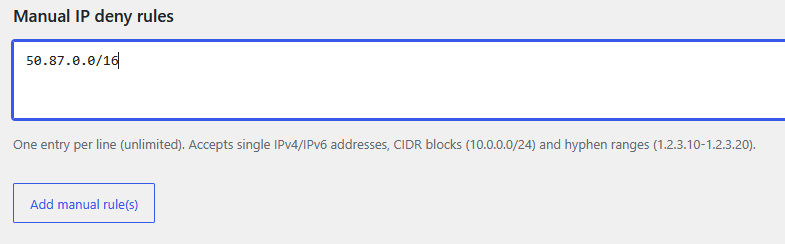
So we add to Manual IP deny rules the block:
The reasoning about blocking all the 65,536 IP Addresses from the Cloud provider is that your WordPress site is probably a site for humans. You want humans to read your blog posts, or if it’s an e-Commerce site, you want to sell to humans. You don’t want bots to use the resources of your server or to try to hack your server. So blocking Cloud Provider’s IP ranges, seems like a good strategy.
If you are one of the few WordPress sites with third party integrations that need to be reached from Cloud providers, you can avoid denying those blocks of IP Addresses that your partners use.
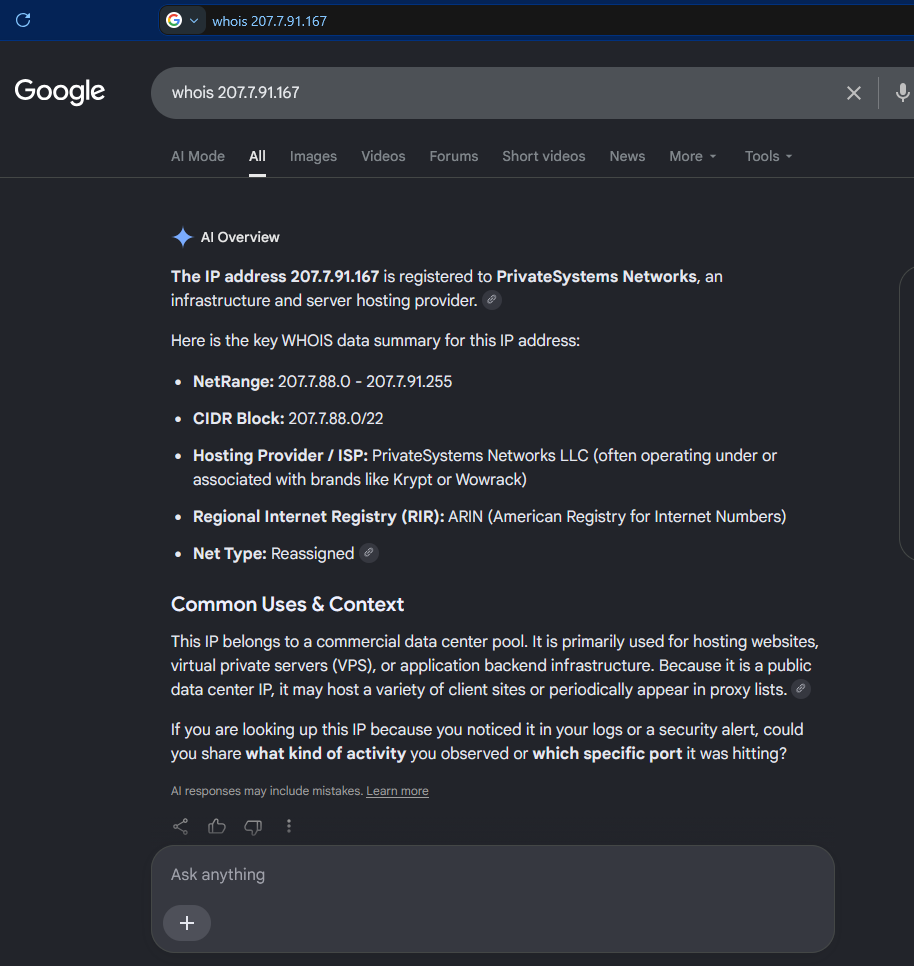
We investigate the other IP:
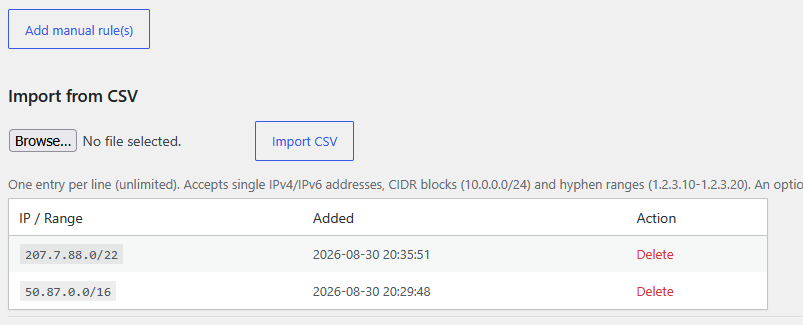
And it’s the same case, so we also block the CIDR Block in the PHP Firewall.
A /22 block comprises 1,024 IP Addresses. So, with two lines in our firewall we have blocked potential malicious requests from 66,560 IP Addresses.
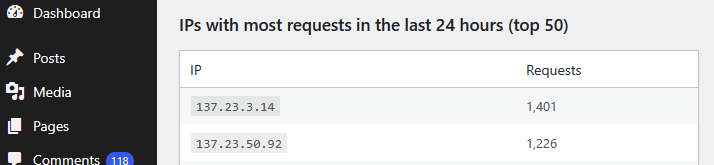
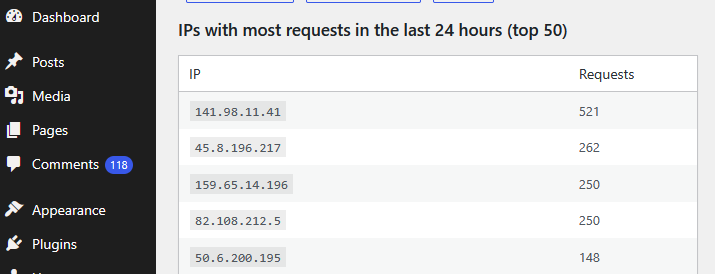
Obviously we cannot analize all the requests we get, but Firewall PHP plugin provides a very useful tool that will display the IP Addresses that did more request to our server in the last 24 hours.
Just click on Show IPs with most requests (last 24h)
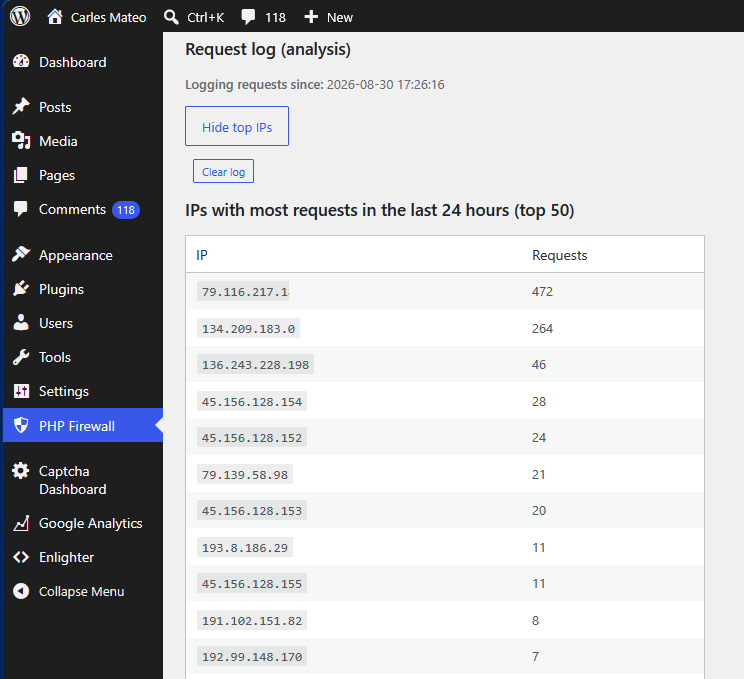
The top 50 IP Addresses that performed more requests are displayed:
In this case, the first IP Address belongs to my own IP Address. Which makes sense because WordPress opened in the browser keeps doing requests to the server.
As I activated the log at 17:26:16 and it’s 21:44:10 in around 4 hours and 15 minutes I got an IP Addresses that did 264 requests.
The IP 134.209.183.0 has performed 264 requests that went through.
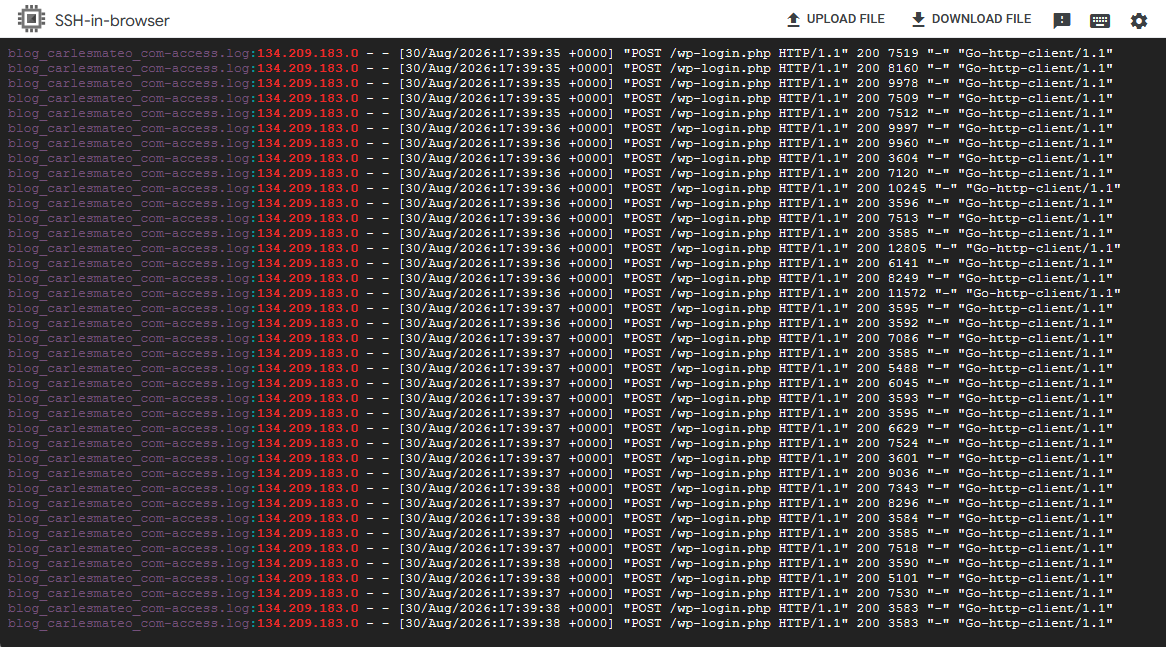
If I check the logs of the server I see that it was attempting to hack the server (trying user/password on wp-login.php)
grep "134.209.183.0" *.log
As you can see, this IP was requesting 12 requests per second trying to hack into /wp-login.php
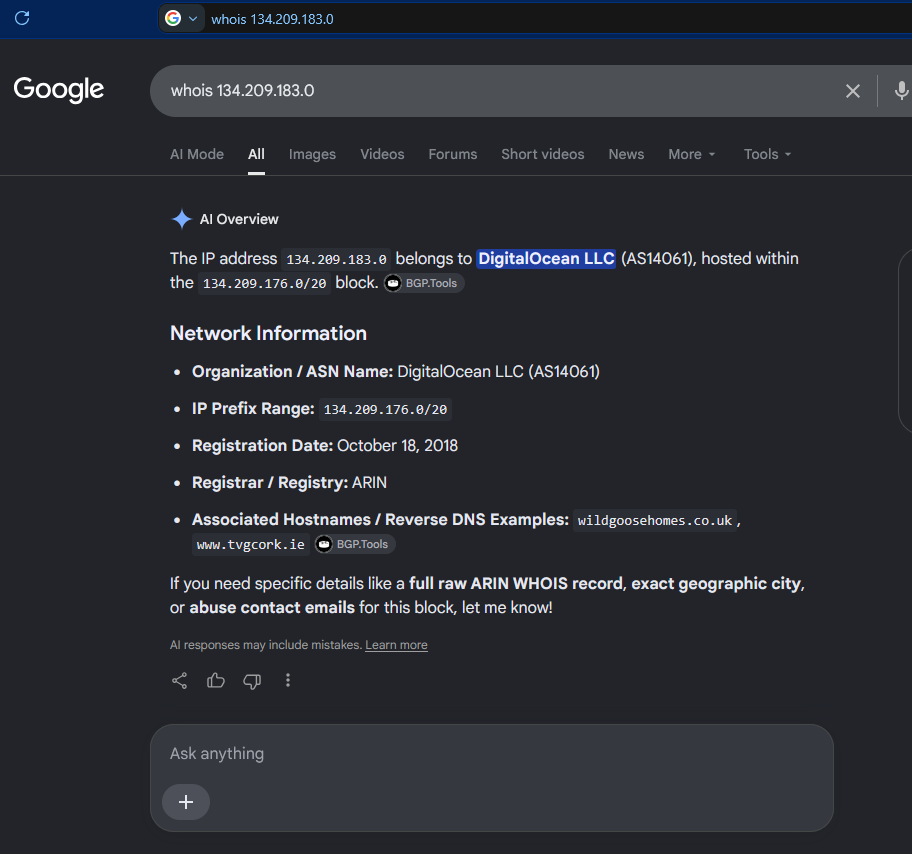
And if we do the whois of this IP Address, it belongs to Digital Ocean:
So we block the entire block 134.209.176.0/20 in the PHP Firewall.
Now the server will block any request from the 4,096 in that block range and will not spend time and resources that are intended for your human visitors.
Most of the attacks come from Cloud providers. Normally are servers that got hacked, and they used those servers to try to hack other servers.
PHP Firewall provides great help in protecting your sites, specially if you don’t have a dedicated team of System Engineers that check the logs regularly, and block the offending IP Addresses in the firewalls.
After 12 hours we see more IP Addresses that made thousands of requests:
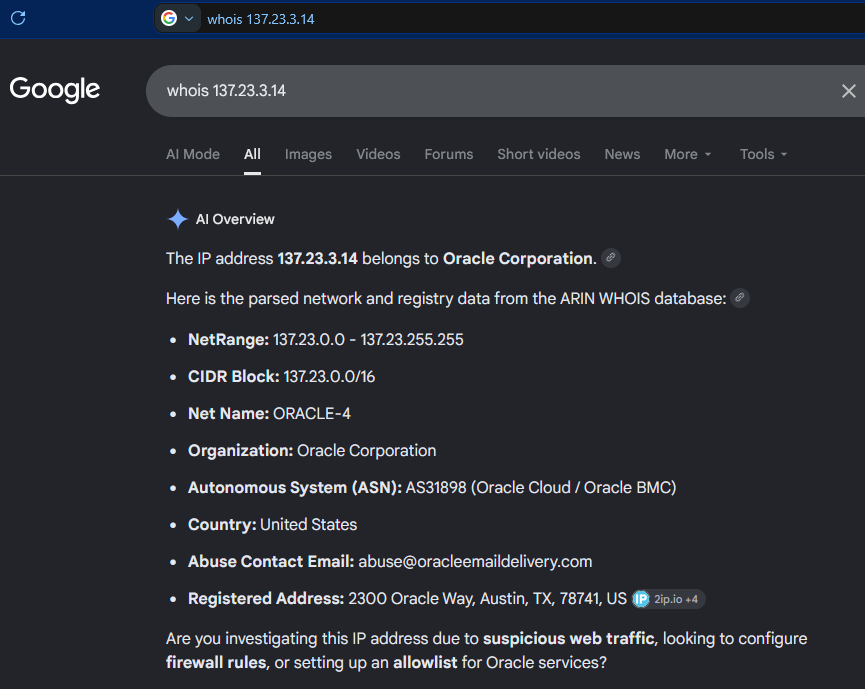
According to google those IP Addresses belong to Oracle Cloud:
So, we block the CIDR Block: 137.23.0.0/16 (which will block the two offending IP Addresses, as they form part of that block)
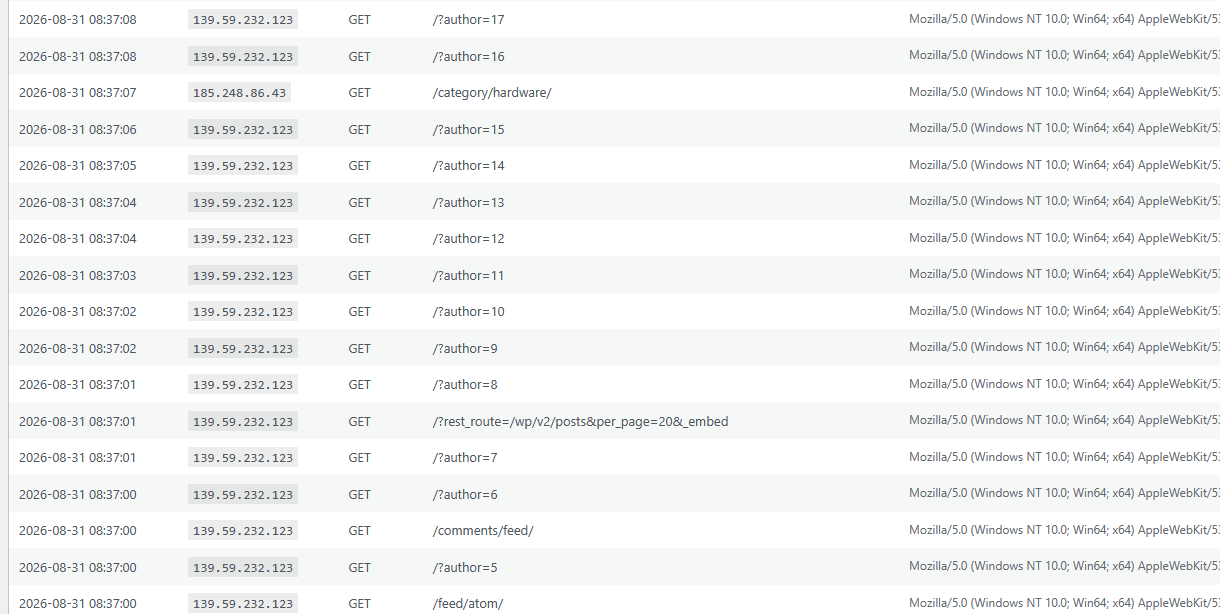
In the latest requests we can see how are new IP Addresses scanning for authors in order to try to attempt logins:
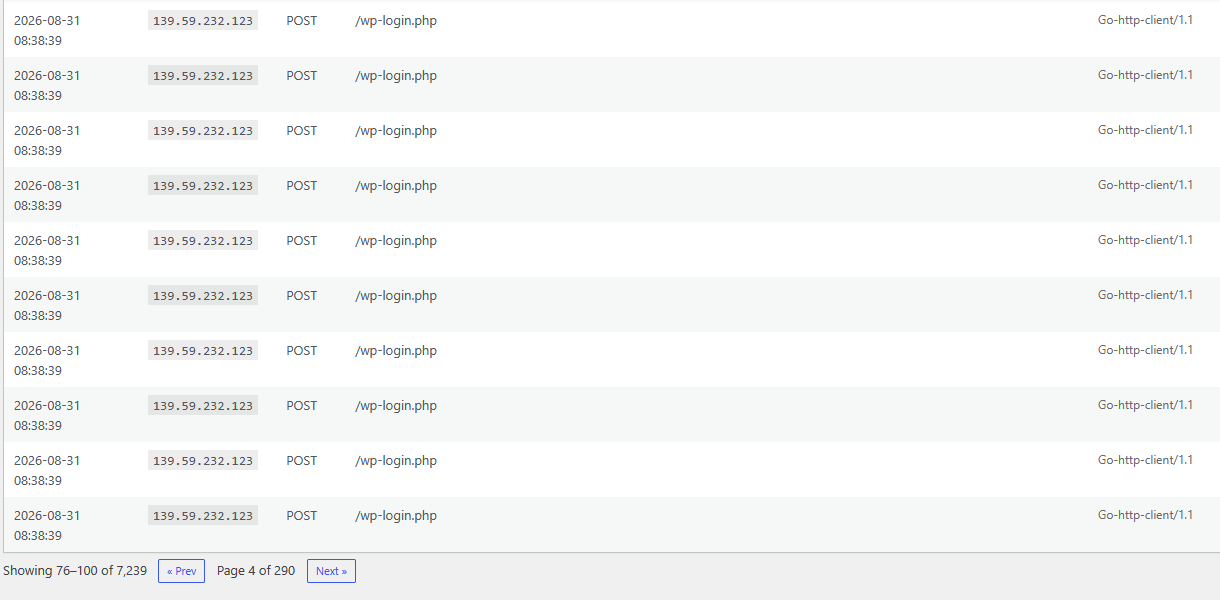
As you can see this IP Address is doing 10 requests in the same second trying passwords (POST to /wp-login.php) in order to attempt to hack the WordPress site.
We do a whois search to see who is the owner of that IP Address:
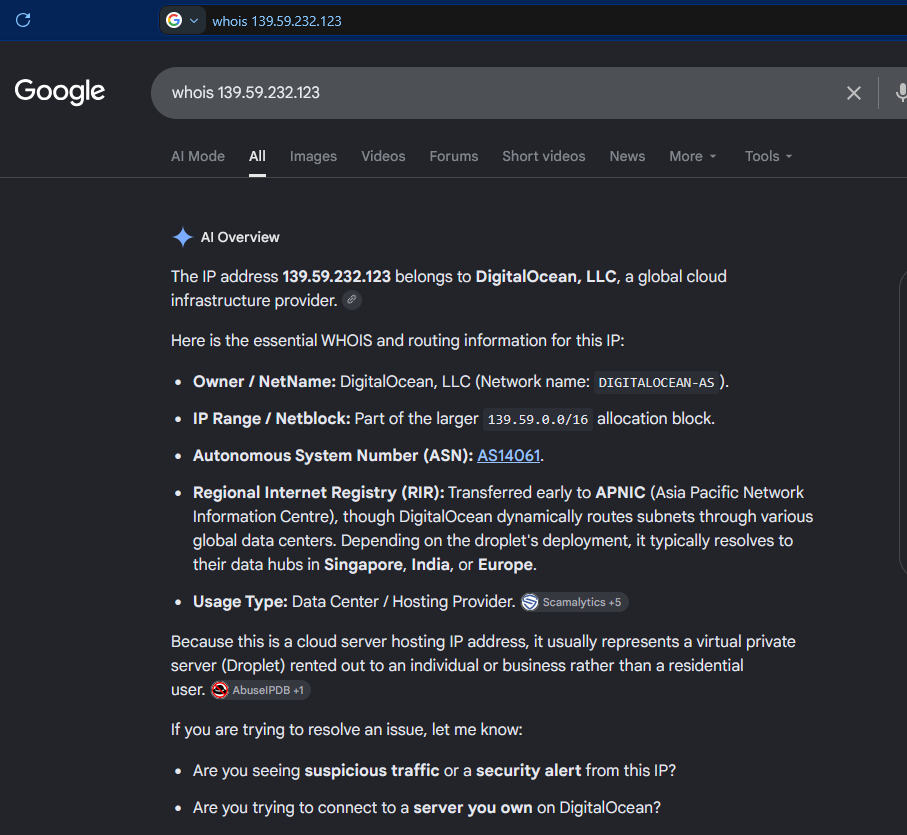
Is from DigitalOcean, the Cloud Provider. We block all the Netblock 139.59.0.0/16
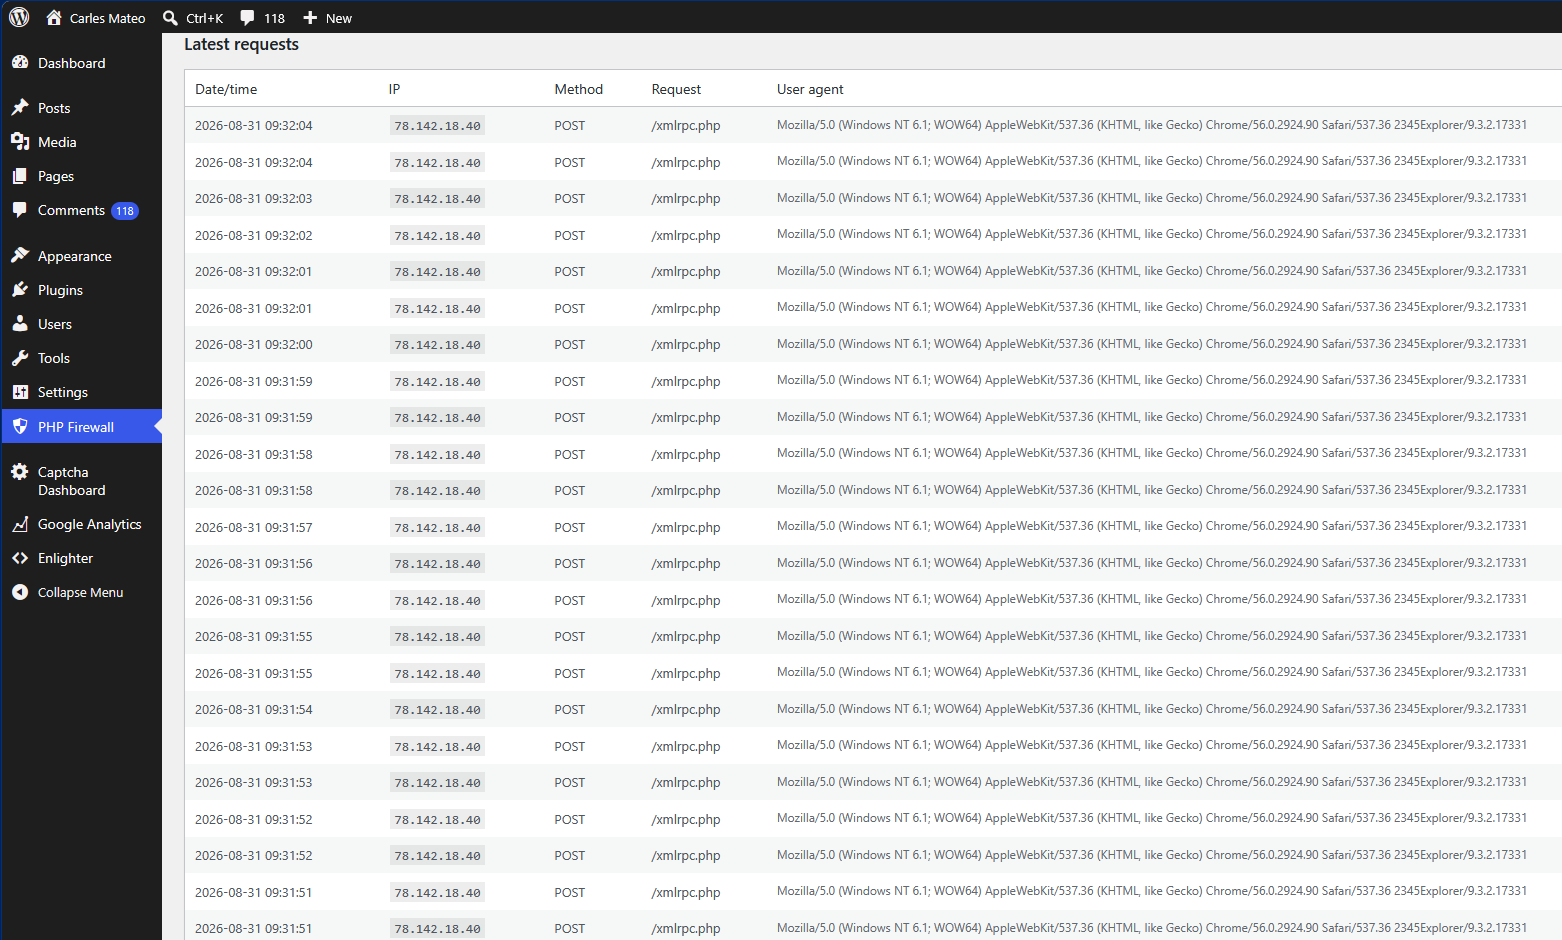
We see a new IP attacking the server, it is attempting two connections per second POST to /xmlrpc.php which tries to perform actions on the site. xmlrpc.php is a legit mechanism from WordPress, for example to register pingbacks, so it is not blocked by default. But hackers use xmlrpc.php to try thousands of passwords at once without passing by the login screen.
If you do not use older mobile apps or specific remote publishing tools that rely on it you sholud block xmlrpc.php
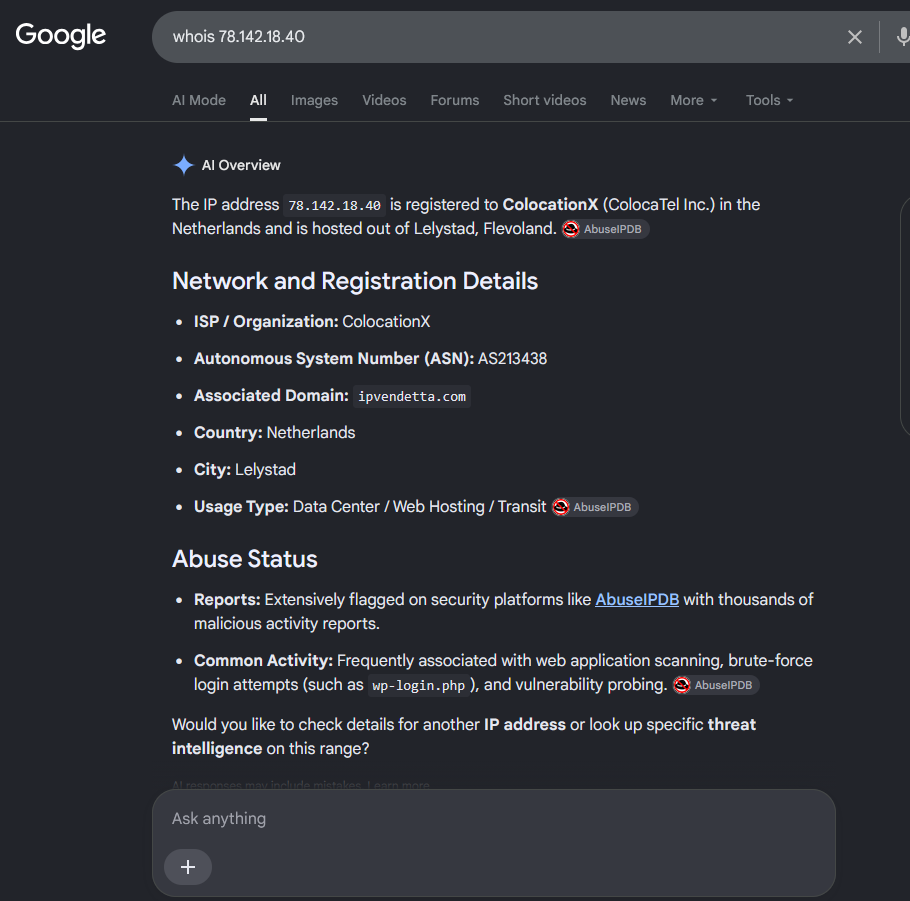
The whois shows that many attacks come from this provider:
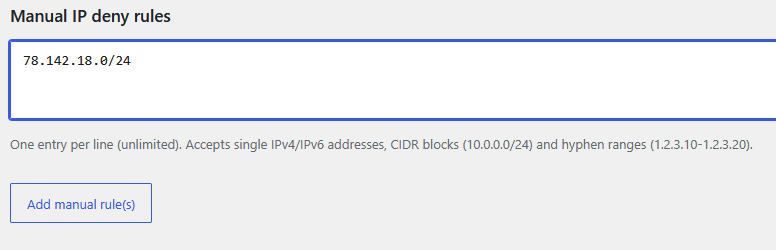
We can block the 256 IP Addresses of the class C, so: 78.142.18.0/24
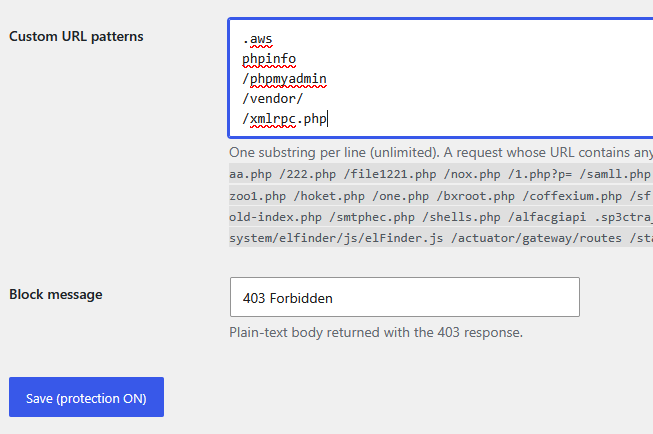
We will also block the requests to /xmlrpc.php using Custom URL patterns:
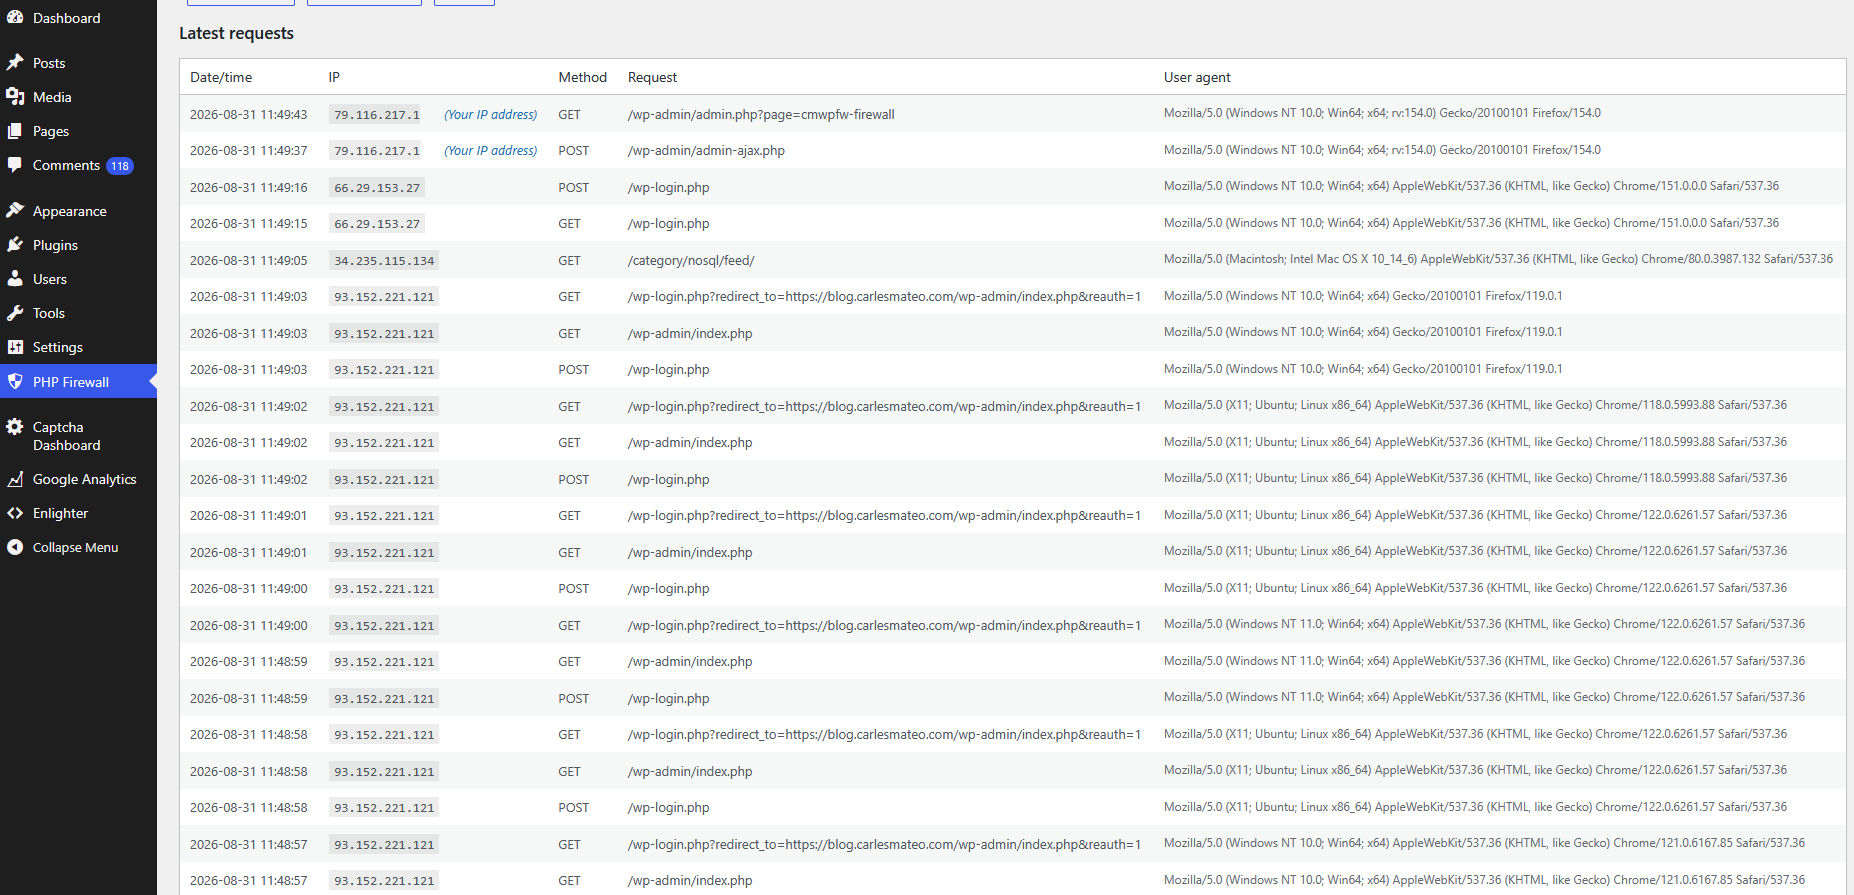
Later, we see that there are more IPs attacking trying to abuse wp-login.php so we will block them:
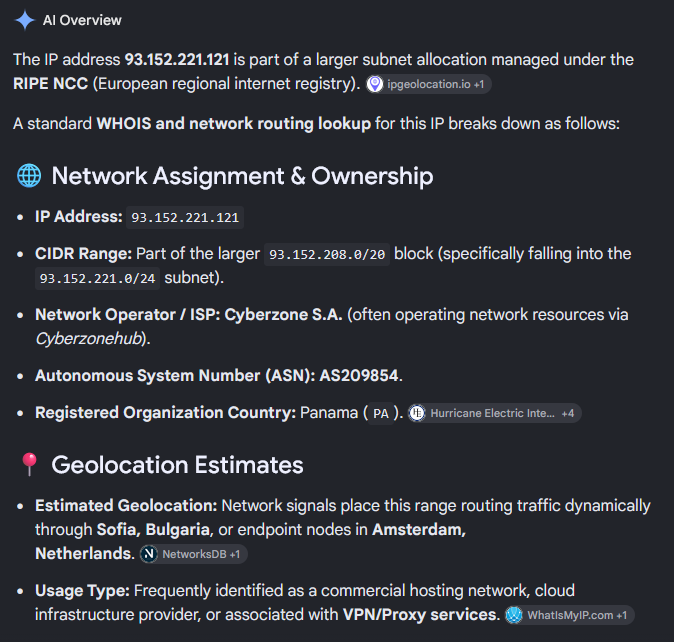
We check the IP that is doing so many attempts to hack requesting wp-login.php
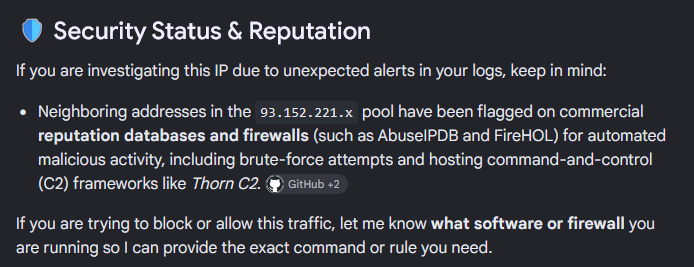
And all the range has been flagged for automated malicious activity and brute-force attempts
So we block all the 256 IP (class C) 93.152.221.0/24.
Two days later I check the IPs doing more requests:
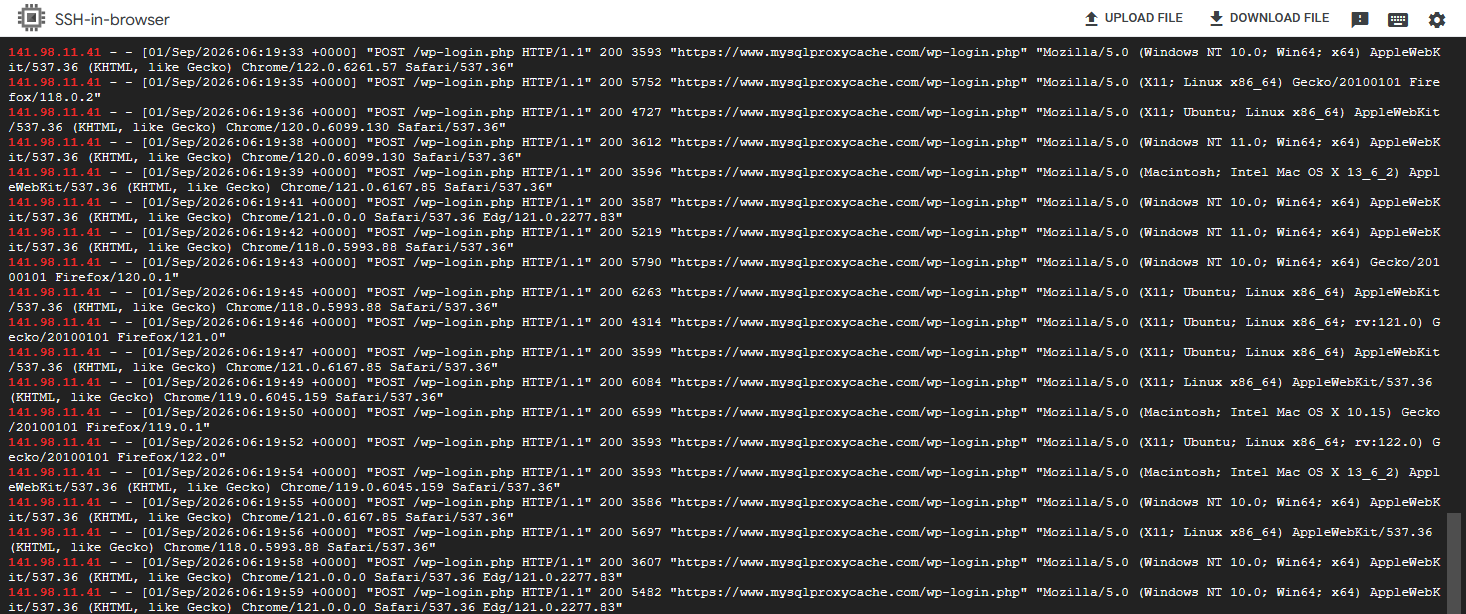
I looked at the logs what requests was doing the first IP:
All were attempts to hack the site through /wp-login.php
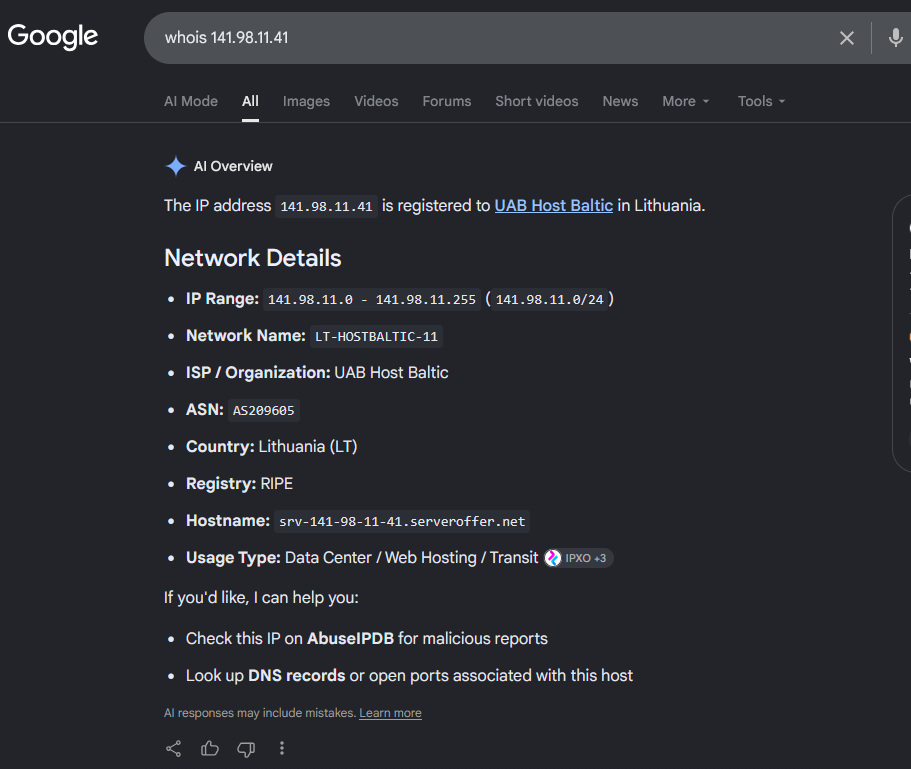
We check what kind of IP is this, and it’s from a Cloud provider:
So we block the range 141.98.11.0/24 in IP Firewall.
If you have SSH to the server, or a control panel from your Cloud Provider, you can block it in the firewall.
For Ubuntu, with ufw that is:
sudo ufw insert 1 deny from 141.98.11.0/24 to any
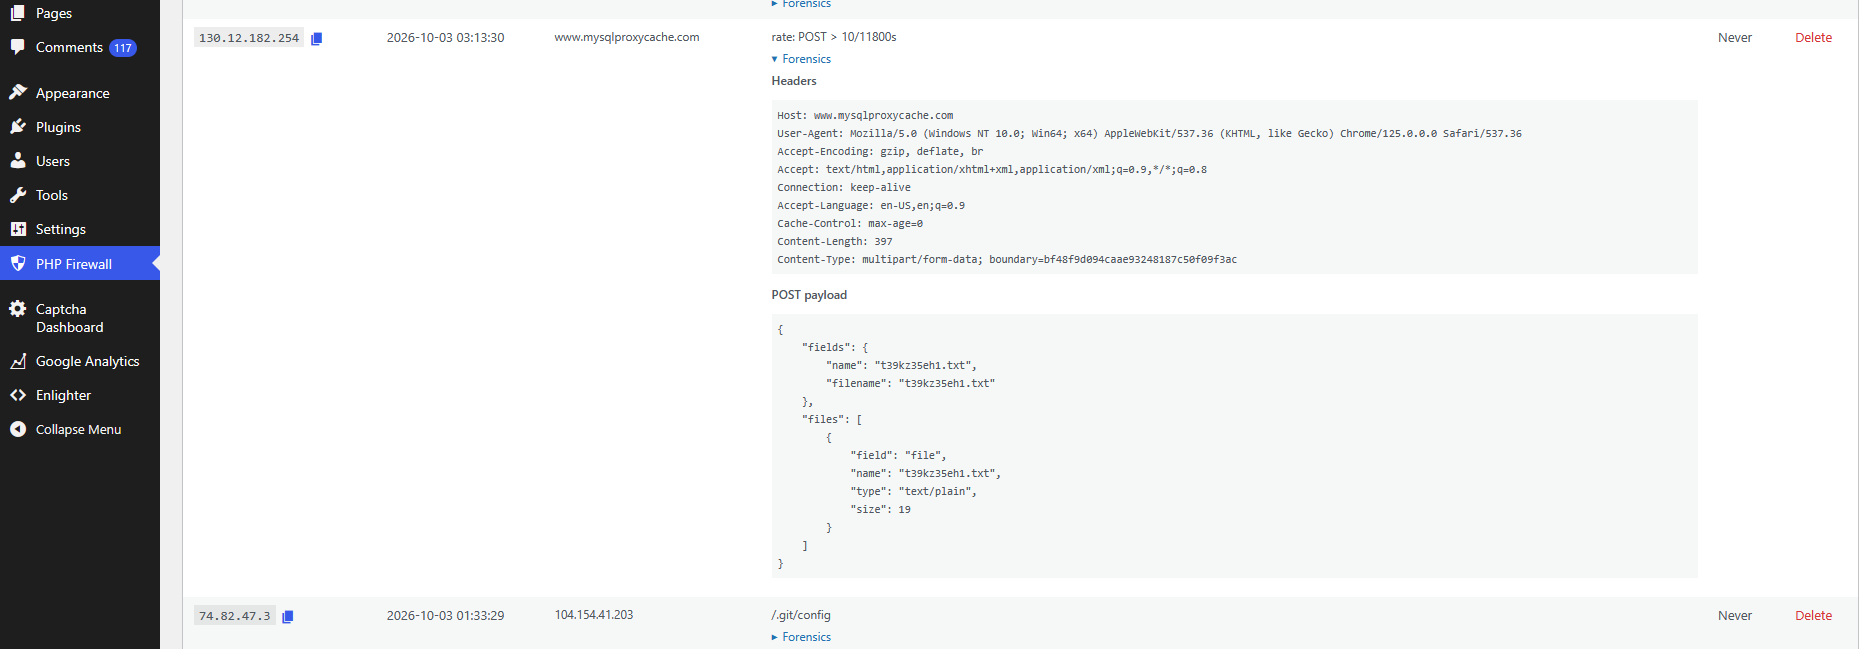
You can do forensics as well, and inspect what Payload are carrying the attacks, for instance:
A video of using WordPress PHP Firewall v. 1.1.0:
PHP Firewall WordPress plugin is a great help, as it blocks most of the attacks automatically, and offers you tools to detect the IPs that do more requests, so you can block them (or the entire range) easily, and to track the latest requests and export them.
Also, the price of the plugin is one time fee per site. Not a recurring payment.
If you want to acquire the Firewall rules that we have been collecting over the years, you can also buy the Firewall rules of Cloud providers from which we received attacks. These can be applied to any Firewall software, for instance Ubuntu ufw, or to my plugin/modules.
I tested Google Cloud when they were in beta, years ago, and I helped their Team to improve the service. And I’ve been using Google Cloud for years.
Here I explain, how an incident, this August, almost made me leave Google Cloud for good. In fact, I migrated many services to other providers. I walk through the steps I took.
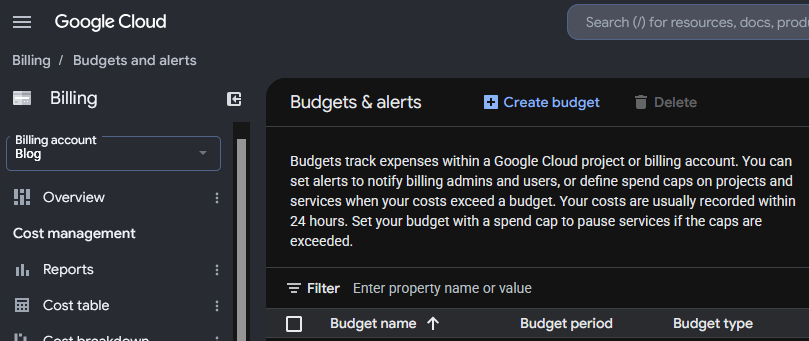
The best advice to start with, is, enable Cloud Billing alerts.
Everything started with the alert of Cloud Billing alerting me that half of the budget for the month had been exhausted around the 7th of the month. I checked the panel, and at the beginning I didn’t pay much attention to it, as Billing was indicating that the extra cost was in Compute in a specific region where I had provisioned new instances and more storage and it was just few euros.
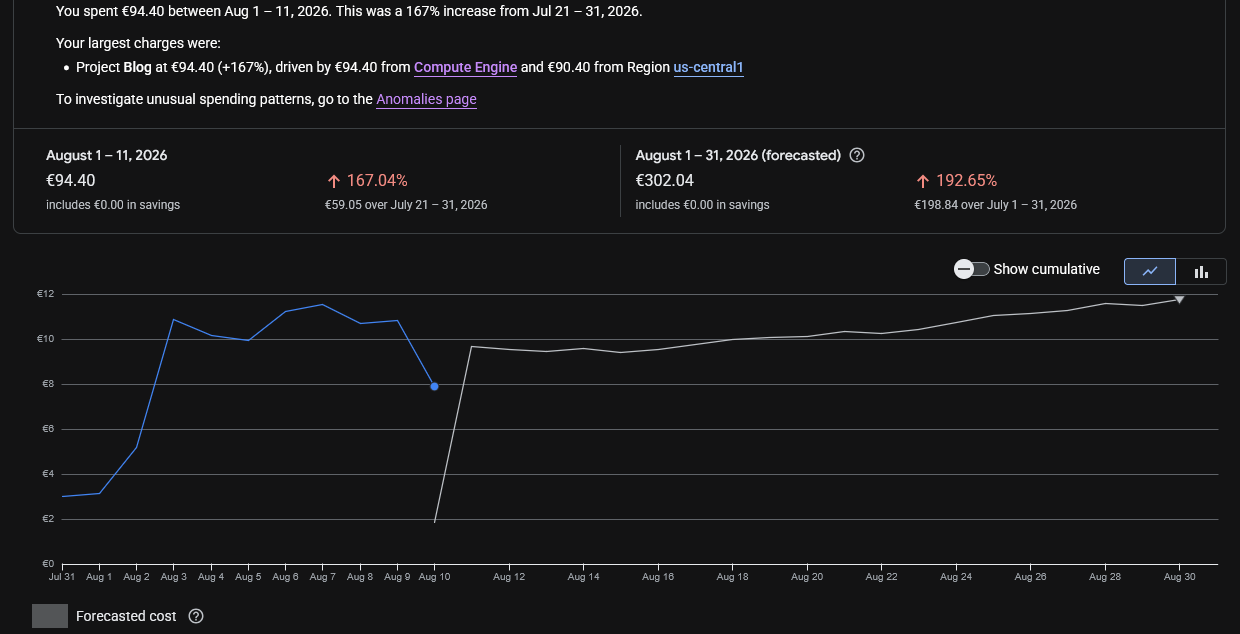
Compute Engine Costs are mixed with the bandwidth consumption in the Dashboards which makes no sense:
So, I had to check different dashboards to realise it was a data transfer issue, and honestly, at the beginning I didn’t know where the problem was, but as I wrongly inferred, that the instance generating egress traffic was the one named “ubuntu26-04” I was investigating mainly that.
The first thing to learn that Google Cloud Billing shows the pure Compute and bandwidth usage together. I dislike it, for obvious reasons.
Next day budget for the month was almost gone.
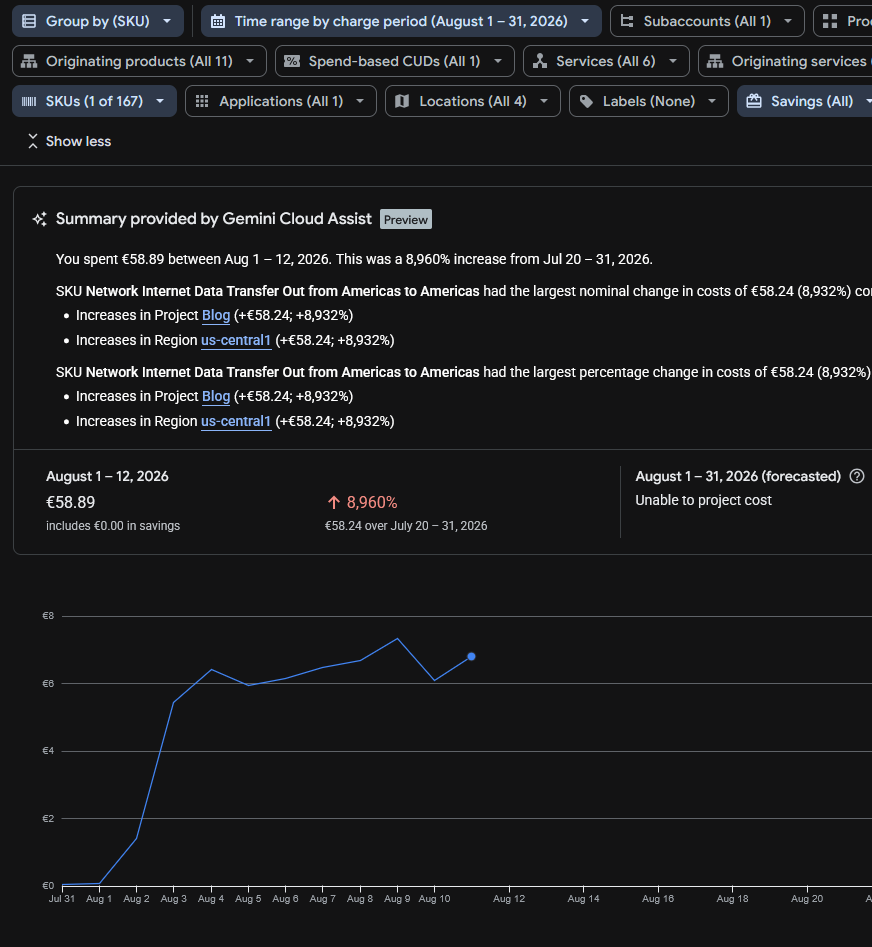
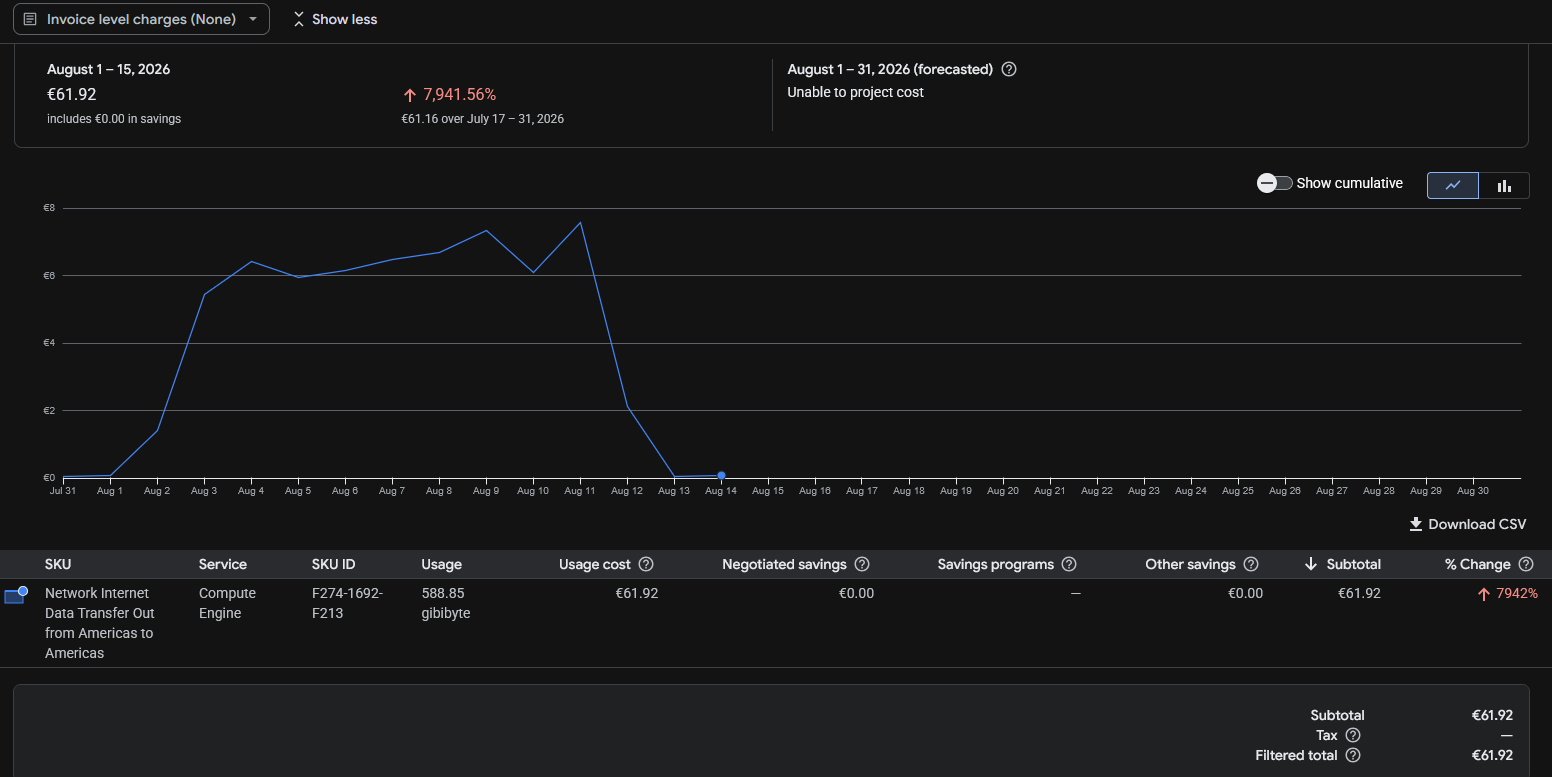
Running the reports I saw “SKU Network Internet Data Transfer Out from Americas to Americas” which was confusing, and initially made me think if it could be the new backups system, sending the backups to my centralised server using the AI compatible agent with the public IP for the API and encryption, but I discarded this very quickly due to the volume of data and I modified the system to use internal IPs instead of the public ones.
The only clear thing at this point was that Internet data transfer (egress) was being sent, and Google makes you pay for that.
I had released several projects recently, like https://read.carlesmateo.com/en Text-to-speech to generate MP3 from text files, or https://sendmeafile.carlesmateo.com/en to send and receive huge files, with resume, checksum verification, AI compatible… So my first thought was that one of the projects or its dependencies could have been compromised, or fanatic AI/crawlers were downloading the sample MP3 files again and again.
I made a mistake when checking Cloud Billing. It indicated that the expenses came from us-central1, so checked the list of instances’ regions and I thought the problem came from a new instance named “ubuntu26-04”.
But I made a mistake, because there are several zones in every region, like us-central1-a, us-central1-b, us-central1-c… My new instance for the new projects was in the zone us-central1-f but I had more than that one instance in the region, only that in different zones. But when I checked the zones for the instances I did not realise that there was more than one instance in the zone us-central1 and I assumed the new instance was the only one in the zone and should be the one generating the egress traffic.
I only had ports 80 and 443 opened in Google’s firewall, so there could be requests to the web server, or that the server got hacked. I analysed the nginx logs for the server and found no huge traffic or big files being requested.
Nowadays bots and crawlers and AI’s generate a crazy amount of traffic, so I had to discard this.
The Billing Dashboard showed that the increment in data sent was costing me around 11€ per day, so it allowed me to start moving services from that server, with relative calm. The forecast for all the August month displayed that the bill would cost me 300€, which was not nice.
In the meantime I hired a VPS with unlimited data and started to migrate the Docker services there as fast as I could with the idea of shutting down the compromise instance to cut the costs.
One of the things that really made me angry, while I was migrating to avoid those over costs, is that I checked again, the next day, the Cloud Billing Reports, the web loaded and informed me that it had changed with news and showed some floating popups pointing how it work and some improvements pushed by the Google Dev Team, and when I continued, the Cloud Billing Report was displaying an unexpected amount of money to pay in August 2026, more than 10 times what I expected, instead of the forecast I saw previously. So it looked like I had to pay that amount for August, and I started to look at what caused that increment of costs quickly, which fas frustrating. And after a while, when I was thinking about stopping the services, I found that Google had changed the page of the reports and the filters were reset to yearly, and the page was showing the already paid costs from 1st August 2025 to 31th August 2026.
Later I reported how frustrating was the experience to Google as “you should not do that” and “users dislike frequent changes”.
Companies are not aware that when they change things, they often annoy the customers a lot.
Years ago I migrated from my long term account with Amazon AWS to Google Cloud Compute Engine cause I was feed up of the problems in Amazon, how many programming errors they had, the changes they did, causing problems, like to the identifiers of the objects (I had older created objects, with shorter hash, and some API calls did not work any more), and how difficult they made simple things. User Interface was bad, and they also lost two of my instances and communicated really poorly (I also reported that to a friend in Amazon and I had some conversations with Amazon’s AWS PMs), and they were over expensive for developers, so I ended migrating to Google Cloud. And now Google is repeating some of the same mistakes.
They are not only expensive. They make things that could be easy, difficult, for the developers.
These big companies force you to stay continuously learning they changes. They offer great solutions for the Enterprise, but for developers and Startups the costs could be overkill.
Probably they are over-kill and over-expensive for developers and Startups.
With Google Cloud I have experienced some technical issues too, as my older instance froze several times and became irresponsive and I had to do a stop from the web console and I had to wait until the command timed out and Google realised there was a problem so it would consider the instance finally shutdown and I could start it again in other non faulty hardware.
If you are a company with a Load Balancer, with health checks, and several front servers, and 20 developers, you can afford to have Web servers KO, as the Load Balancer will handle it nicely, but if you have a single server with WordPress sites, if the instance stops it means that nobody can access those sites.
As an example of costs, for a Google e2-medium (2 vCPUs, 4 GB of Memory and 20 GB of disk) in us-central1 I pay around 30 € per month. And it happens that the forecast for this month in bandwidth was 300 €.
Also storage is around 1€/month per 10GB for standard. So 200GB of regular space is 20 €/month.
For SSD 1.7€/month per 10GB, even tough provides more IOPS, but not more speed. 200GB of space more is 34 € more per month.
I migrated to a provider were I pay 30 € per month for a 8 vCPU and 24 GB of memory and includes 200 GB of NVMe, and I have unlimited bandwidth. Extra storage is also much more cheap. And the static IP is included (for Google you pay around 1.1€ per month).
The key in here was the unlimited bandwidth.
I also could have rented a dedicated server with 64GB of RAM for around 64 €/month, but these comes with some down sides, like if your server experiences a hardware error, you’ll have to wait for the System Administrators from the Cloud Provider to physically replace the components. With a VPS or instance, I can just launch it in a healthy hardware immediately.
As I was migrating services and investigating the origin of the problems, I saw that 500 GB of data were transferred from us-central1 since the 1st of August.
The Billing Report didn’t allow me to filter for IP. It only helped to know the region, us-central1, which helped me to identify the possible services that could be having the problems.
To be honest, I should have located the origin of the problem quickly, but I did so well blocking bots and uneducated crawlers in the past years, that I had no problems for years, and GCE has mad many changes over time, so I did not remember that I could monitor real time network usage of my servers. Most of the servers I troubleshoot I have only SSH access, so I use network tools.
But as I told previously, I mistakenly thought that just one instance was running in us-central1, and that was not the case. They were in different zones of us-central1.
The live traffic inspection in the server with tools like ss, netstat, nethogs, iftop, iotop and ps revealed normal traffic and load.
A second revision from the nginx logs didn’t reveal any problem over time. And the only opened ports were 80 and 443. With the services I considered potentially more vulnerable (as they used python dependencies) migrated to the new VPS and stopped in the “ubuntu26-04” Google server, the usage shown and the forecast for bandwidth was not reduced and it was the same.
One thing I learned, and I suspected it from my tests with https://sendmeafile.carlesmateo.com/en is that the maximum speed that my instances were able to transfer from Google to Internet (egress) was around 50 Mbps per connection.
I didn’t see this in Google Cloud’s documentation, but in my tests transferring data from Google servers using the public interface and from different locations to this google server I consistently achieved always that top speed of around 50 Mbps per connection (around 6.25 MB/s), but when I communicated Google servers using their private interfaces, the speed for a single connection was much more higher. So I assumed that the bandwidth was capped. After seeing the data transferred in the Billing Cloud Report, it looks clear to me that an important part of the server’s bandwidth max was being used. Later, Apache logs, confirmed me many requests at the same exact second.
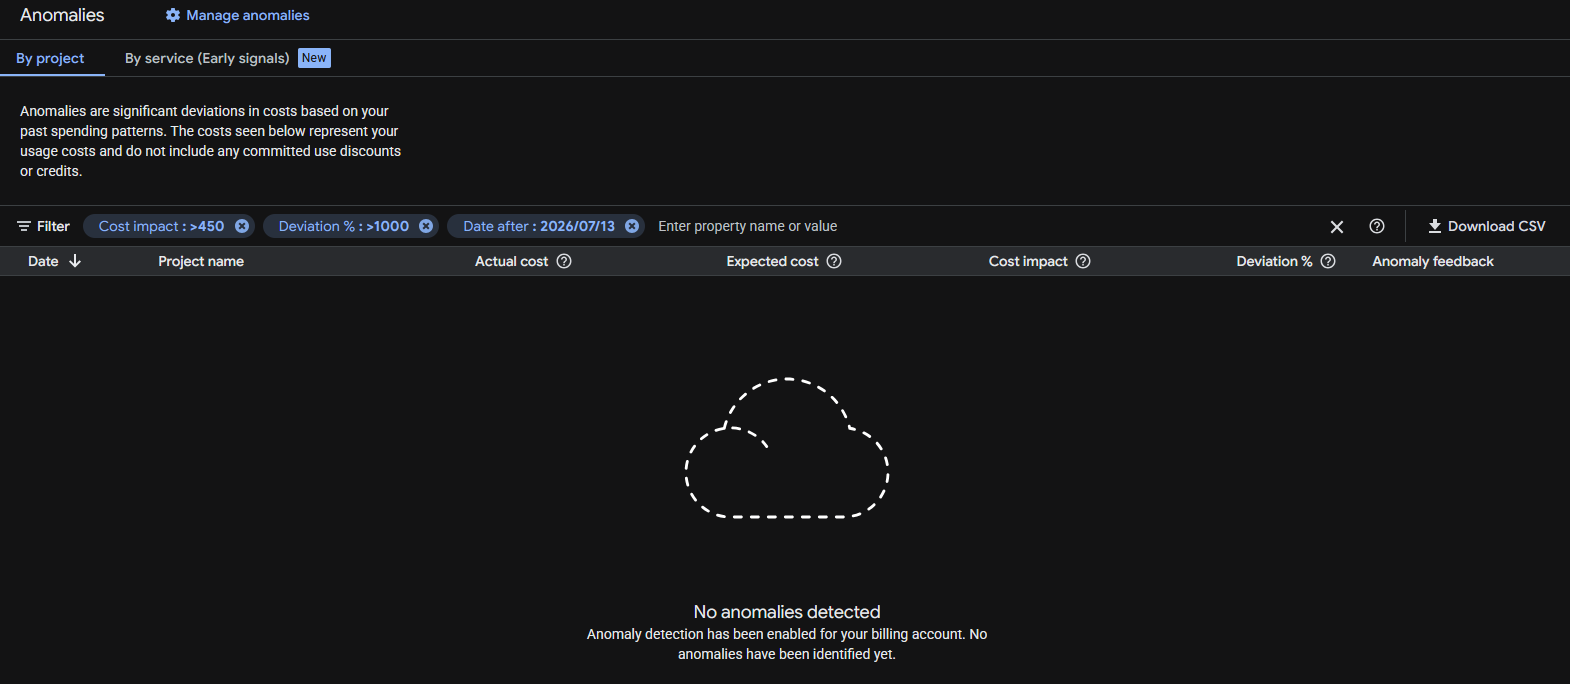
Google anomalies tool detected nothing despite the huge increment in data transfer and cost variation (8,960% respect July!).
Before taking the decision to migrating to another server one has to think, not only in costs, but also on how trustworthy are the storage systems, the resiliency of the systems, how many times they are down per year… there are surprises that you discover as you go. With the experience.
But honestly, I felt it was not worth the price to continue with Google Cloud and it was conditioning the kind of projects I could start. My architecture is resilient, based in containers and I can deploy it fast. I also have backups.
Google storage is not that super trustable in my opinion (neither Amazon’s). Some times my VMs froze and Google monitor dashboard stops drawing the lines of metrics (like CPU usage), but Google doesn’t catch that the VM is frozen. My guess is that the problem is the storage or compute servers dying.
Having to pay per GB transferred in a time where bots and AI index your sites continuously, and abuse the servers by launching many requests concurrently, generating load, and where bots consume much more data than humans, force you to take architecture decisions and to implement strategies.
Possible solutions like using CDN’s like Cloudflare to be protected against DoS, to cache statics and to cut bandwidth and CPU abuse (requests to origin), using other cache systems or migrating to other Cloud providers that are more developer and Start up friendly, and that have unlimited data transfer, etcetera.
When I was presented with the new Google Billing Reports page and the filter was reset to one year, and I saw the price that should be showing multiplied by 10, I contacted Google Cloud by X. They kindly replied and invited me to contact them privately. I did and we opened a ticket. Around three hours later I got an email from a Google staff, telling me that they will investigate the problem, and giving me an expected response deadline of 5 days.
It was nice, but by the time I received the email I already had found and sorted the problem.
I troubleshoot the instance “ubuntu26-04” but the CPU usage was low, and no permanent connections (a sign that could have indicated that was hacked):
That Looked normal
sudo ss -tunp state established
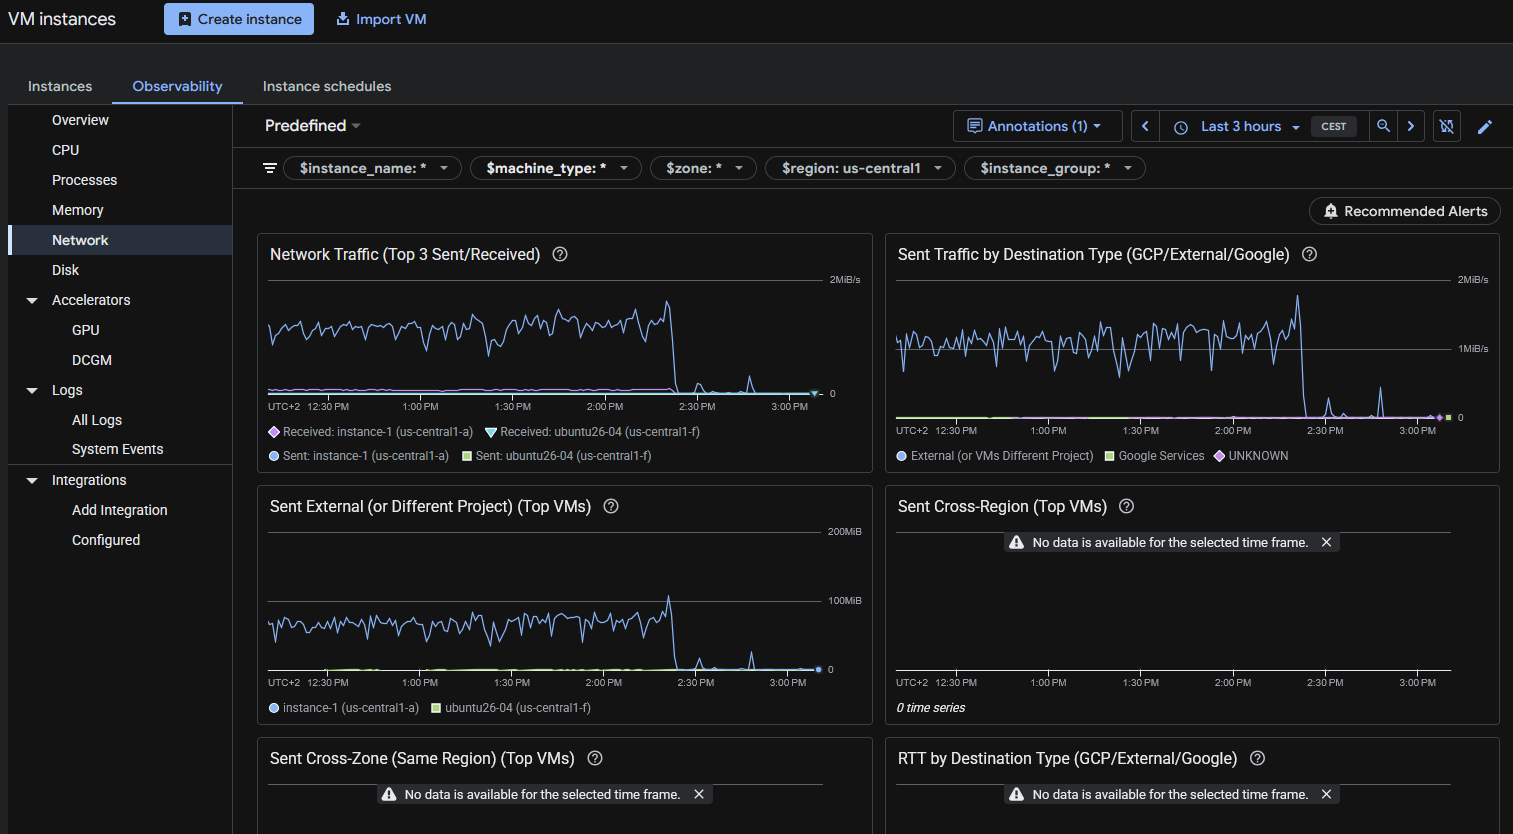
Then I did something that I should have done before, I checked the metrics from all the different instances in Google Cloud Compute, starting from the one I initially guessed was the one suffering the problems. That machine was clear. No high CPU usage. No high bandwidth usage. Nothing.
And then I saw it.
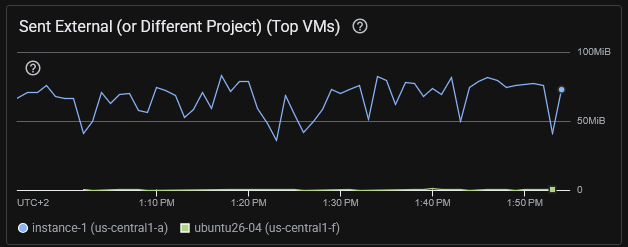
Through VM Instances I narrowed to the one in us-central1 that was consuming the Internet bandwidth, “instance-1”:
I was checking the wrong server. The consuming excess of egress was from instance-1 that hosted several WordPress sites and it was using Apache2, not nginx.
Some commands I ran:
# Check for the data sent by Apache. This found a lot of traffic. Note: the access.log of all the sites were being analysed
sudo awk '{s+=$10} END {print s/1024/1024/1024 " GB"}' /var/log/apache2/*access.log
# returned 36.4578 GB that's for a day, so something was clearly wrong

# Analyze requests: See what is more heavy. So basically bots trying to hack into the server and some heavy images. Note root home for at least a server is huge (50MB)
sudo awk '{a[$7]+=$10} END {for(u in a) print a[u]/1024/1024" MB\t"u}' /var/log/apache2/*access.log | sort -rn | head -20
54.3218 MB      /
21.6173 MB      /wp-login.php
17.1676 MB      /wp-content/uploads/2022/10/20221001_200930-cut.png
16.5822 MB      /wp-content/uploads/2022/10/20221001_201033.png
10.7245 MB      /wp-content/uploads/2022/02/python_loop.gif
6.61174 MB      /xmlrpc.php
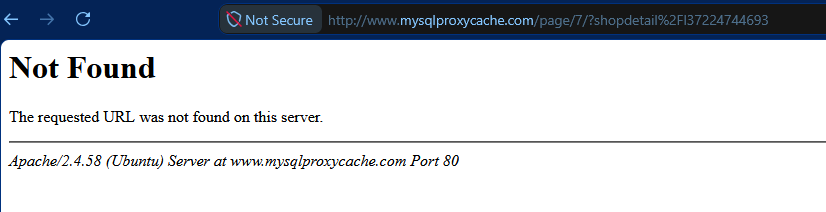
6.60595 MB      /page/2/?shopdetail%2FI37266592159
6.60595 MB      /page/2/?shopdetail%2FI37256267952
6.60595 MB      /page/2/?shopdetail%2FI37256137878
6.60595 MB      /page/2/?shopdetail%2FI37256033568
6.60595 MB      /page/2/?shopdetail%2FI37224959793
6.60595 MB      /page/2/?shopdetail%2FI37214305672
6.60595 MB      /page/2/?shopdetail%2FI37203620584
6.60595 MB      /page/2/?shopdetail%2FE37266925367
6.60595 MB      /page/2/?shopdetail%2FE37242498260
6.60595 MB      /page/2/?shopdetail%2FE37207321261
6.60595 MB      /page/2/?shopdetail%2FA37259909717
6.60595 MB      /page/2/?shopdetail%2FA37259600135
6.60595 MB      /page/2/?shopdetail%2FA37256306882
6.60595 MB      /page/2/?shopdetail%2FA37256197883

# Analyze requests: See what IP's are requesting more traffic in total. Gotcha
sudo awk '{a[$1]+=$10} END {for(i in a) print a[i]/1024/1024" MB\t"i}' /var/log/apache2/*access.log | sort -rn | head -20
34549.2 MB      74.7.241.60
1491.36 MB      116.202.235.23
287.651 MB      3.41.188.33
232.362 MB      74.7.227.160
199.987 MB      18.97.9.169
183.748 MB      66.249.74.42
84.1681 MB      114.119.140.64
78.3209 MB      114.119.149.169
70.5166 MB      114.119.156.46
67.8224 MB      114.119.150.29
66.7544 MB      114.119.145.237
58.7278 MB      114.119.147.113
57.1822 MB      114.119.162.62
56.0061 MB      66.249.74.43
55.3612 MB      114.119.141.79
21.9245 MB      216.73.217.35
21.2516 MB      104.243.44.93
17.7313 MB      79.116.217.181
17.1676 MB      189.81.71.184
16.5822 MB      205.188.63.181
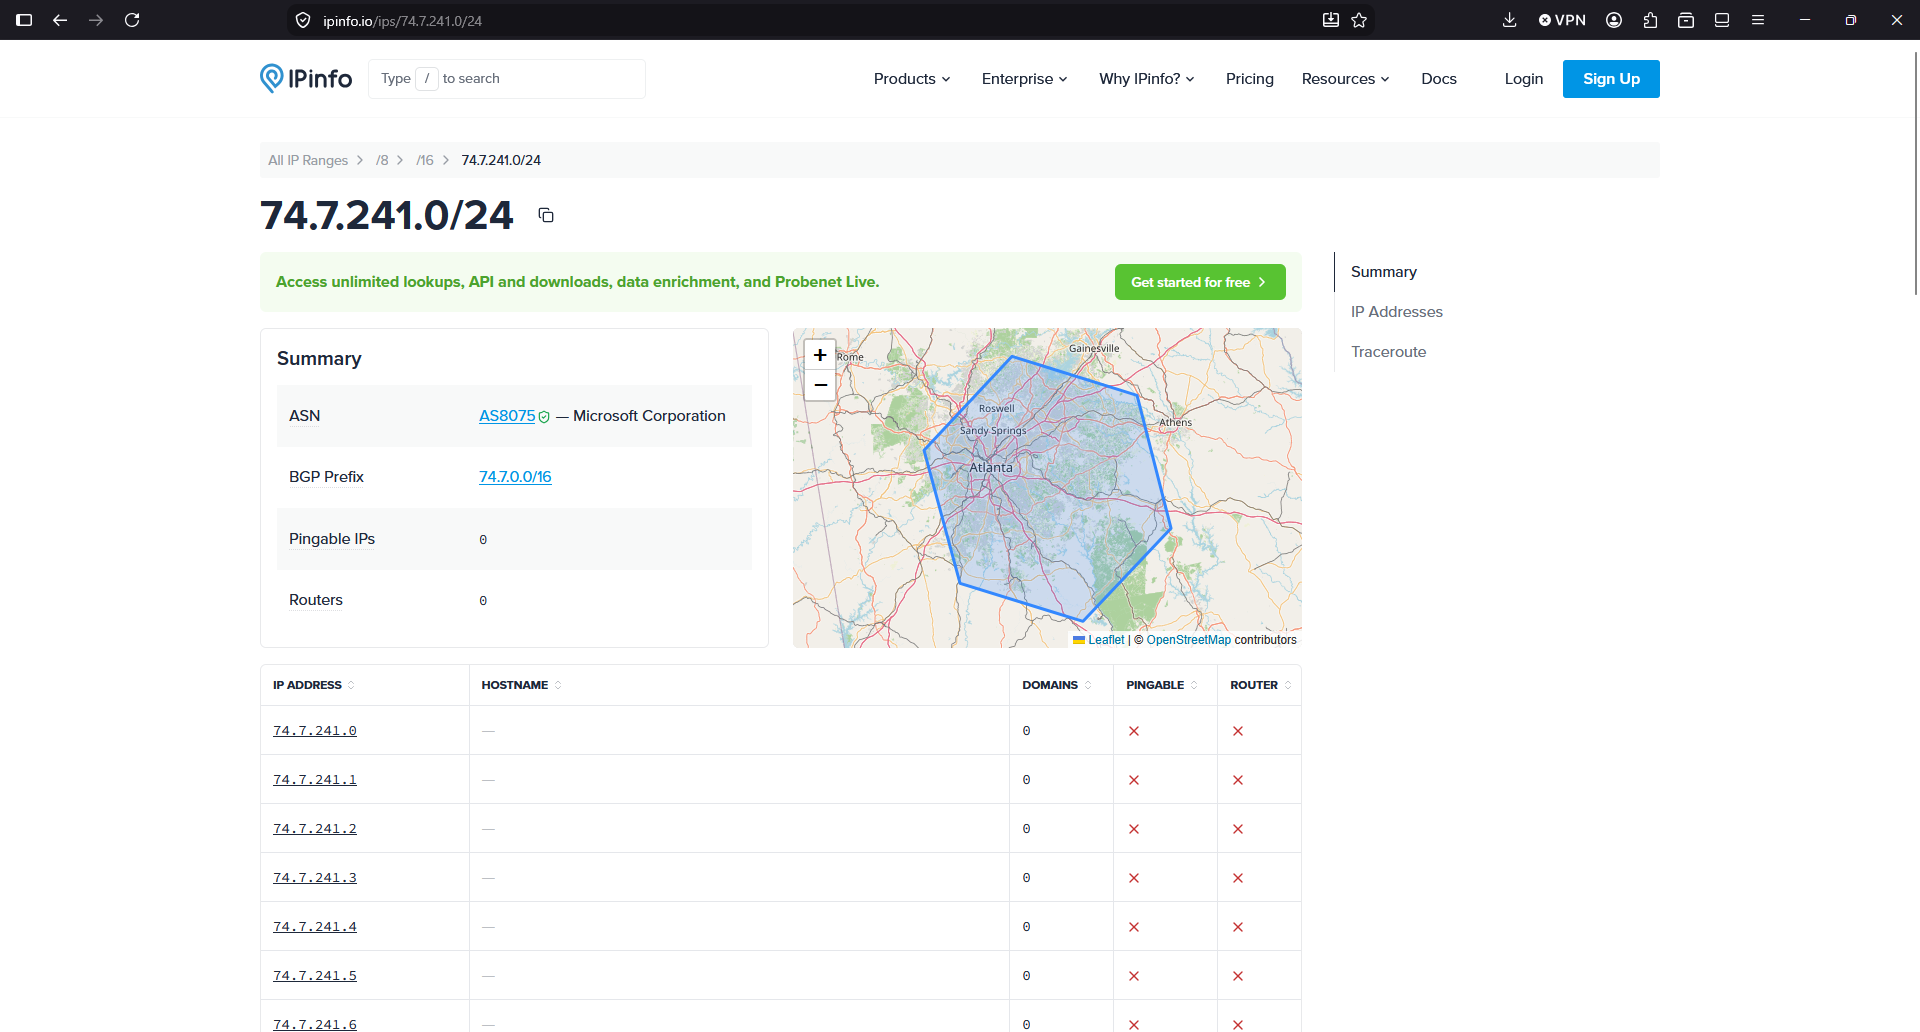
So we see that this IP 74.7.241.60 is requesting 34.5 GB in a day.
So, according to this IP Info service, the IP is from Microsoft. So apparently, crawlers/IA from Microsoft or running in Microsoft infrastructure, were costing me money because they are abusing, scanning my sites, with many connections concurrently, like horrible soulless machines:
I double checked the IP with another provider:
A command to see a sample of what kind of requests I have from this IP, brings more light:
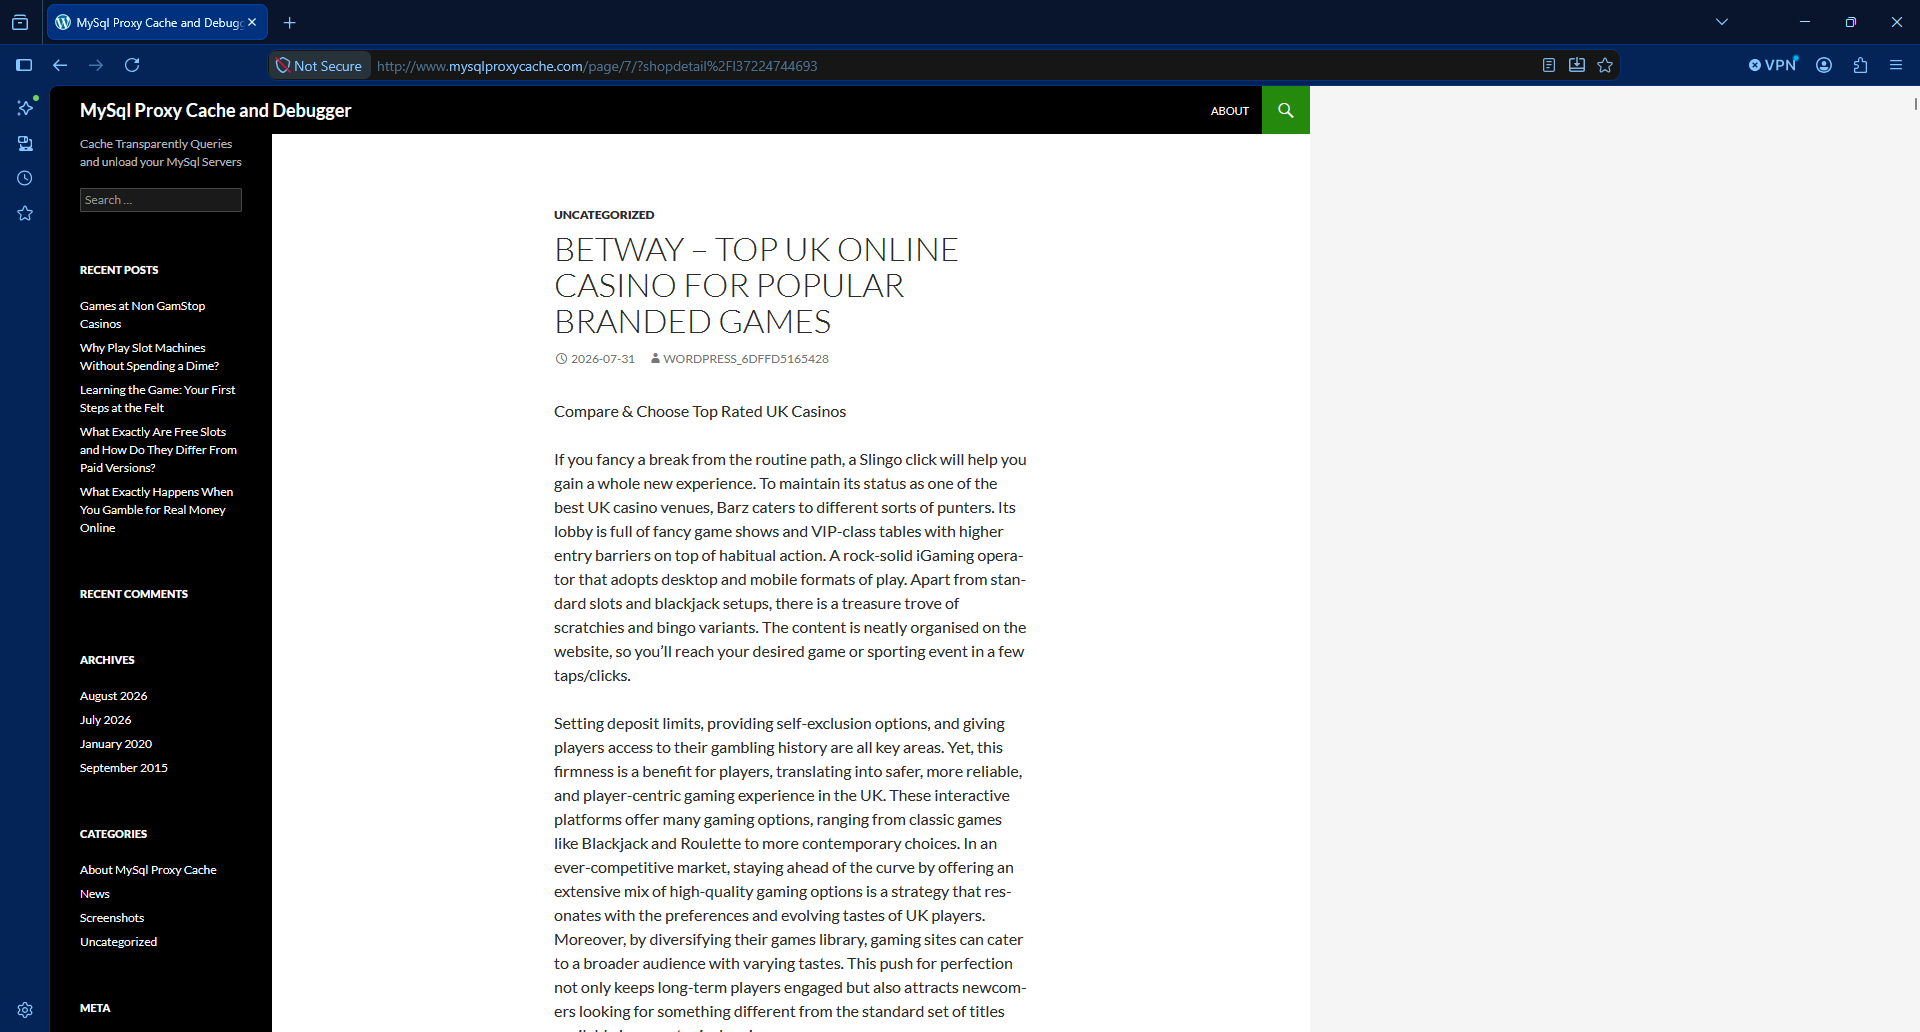
According to the User-Agent is GPTBot. So apparently a bot running in Microsoft self-identifying as OpenAI were killing causing high usage to my server and to my budget by requesting many pages at the same time, for an old shopdetail page that does not exist in that server (maybe there was a shop years before I got that IP), and spends a lot of bandwidth responding with a heavy page of 6 MB.
In the logs I saw many request at the same precise second.
Asking to Claude it tells me that the range of IPs of the Microsoft attacker IP are not in the publicly published IPs of OpenAI for GPTBot, so apparently somebody using Microsoft IPs is pretending to be a GPT Bot, and it isn’t:
The domain is an old WordPress that has been hacked. Yes, this happens more often that we would like, with WordPress.
I checked the https and it returns a SSL potential warning in the SSL.
So, to summarise, there was a bot from a Microsoft IP, that was requesting many times per second pages to a WordPress site that was compromised and it was returning a large article with many photos, so heavy in terms of data usage.
With Apache2 server stopped, I moved the config symbolic link from /etc/apache2/sites-enabled/ to another folder /etc/apache2/sites-disabled/ that I created.
So basically, when I started Apache, the compromised site will not be served. It will be served by the default site.
I restarted the Apache server and checked that the URLs for that domain were catch by default site and no processing resources of bandwidth was used.
That was to avoid a main site marked as default in the Apache config to attend those requests and waste data.
And then I added to the firewall, to Google Cloud’s Firewall and to the servers in all my instances, to block all the IPs from Microsoft from that range.
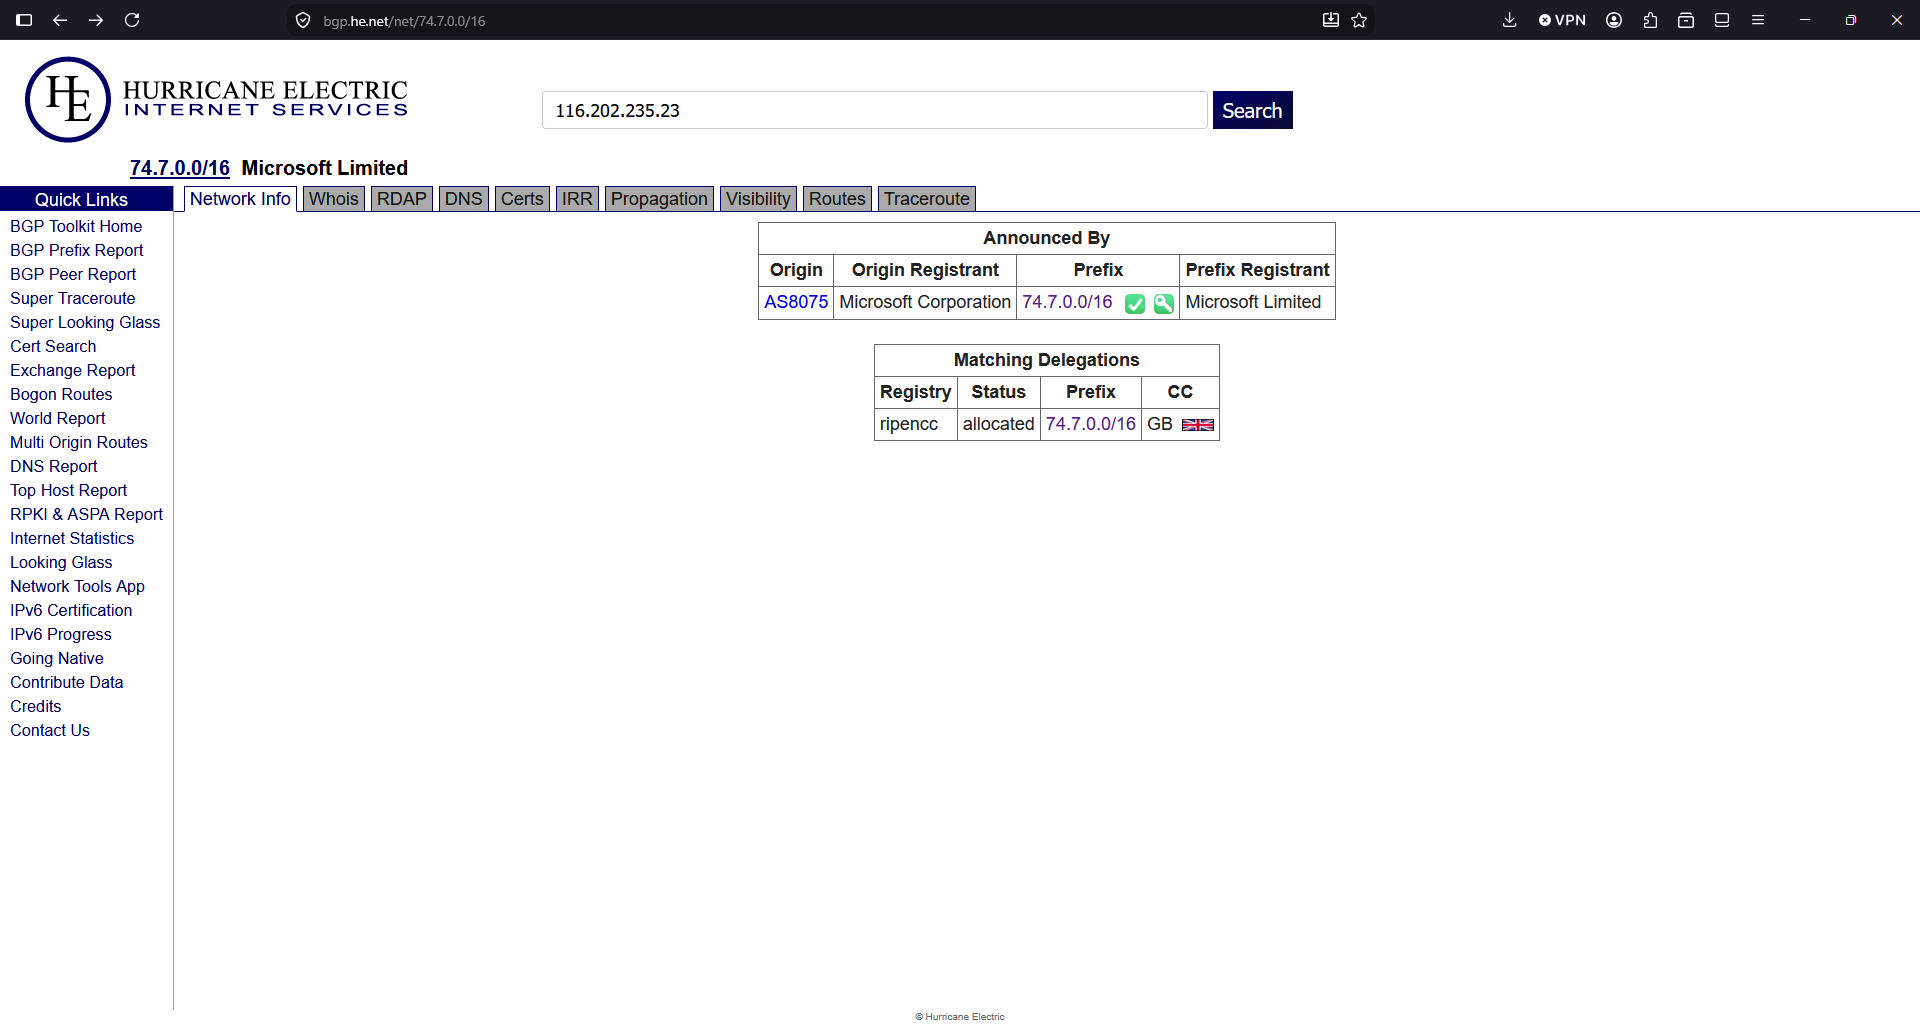
I saw that the BGP Prefix is 74.7.0.0/16 so I block all the 65,536 IP Addresses:
ufw insert 1 deny from 74.7.0.0/16 to any
As you can see I inserted this rule on the first position. Don’t just add it with ufw deny from 74.7.0.0/16 to any or otherwise it will go to the last position, after the allow rules. And then it would not be enforced.
Check your rules with:
ufw status numbered
You can block the range in your provider’s Firewall (VPC Firewall in Google Cloud).
If you didn’t have the Ubuntu Firewall active, and want to activate it now, make sure that you have the rules for the SSH connection:
I recommend you to add the rules to a script in git (Infrastructure as Code), so you can replay it another day, and to any server you have.
By default, ufw sets deny by default for rules not specified. You can check it with:
sudo ufw status verbose | head
Bots, IA, crawlers abuse our servers nowadays.
Also the automated bots attempting to hack into the servers.
If you just check your logs, you’ll see many attempts to exploit vulnerabilities in your servers, every day.
I checked for the second IP consuming more bandwidth in the list:
116.202.235.23
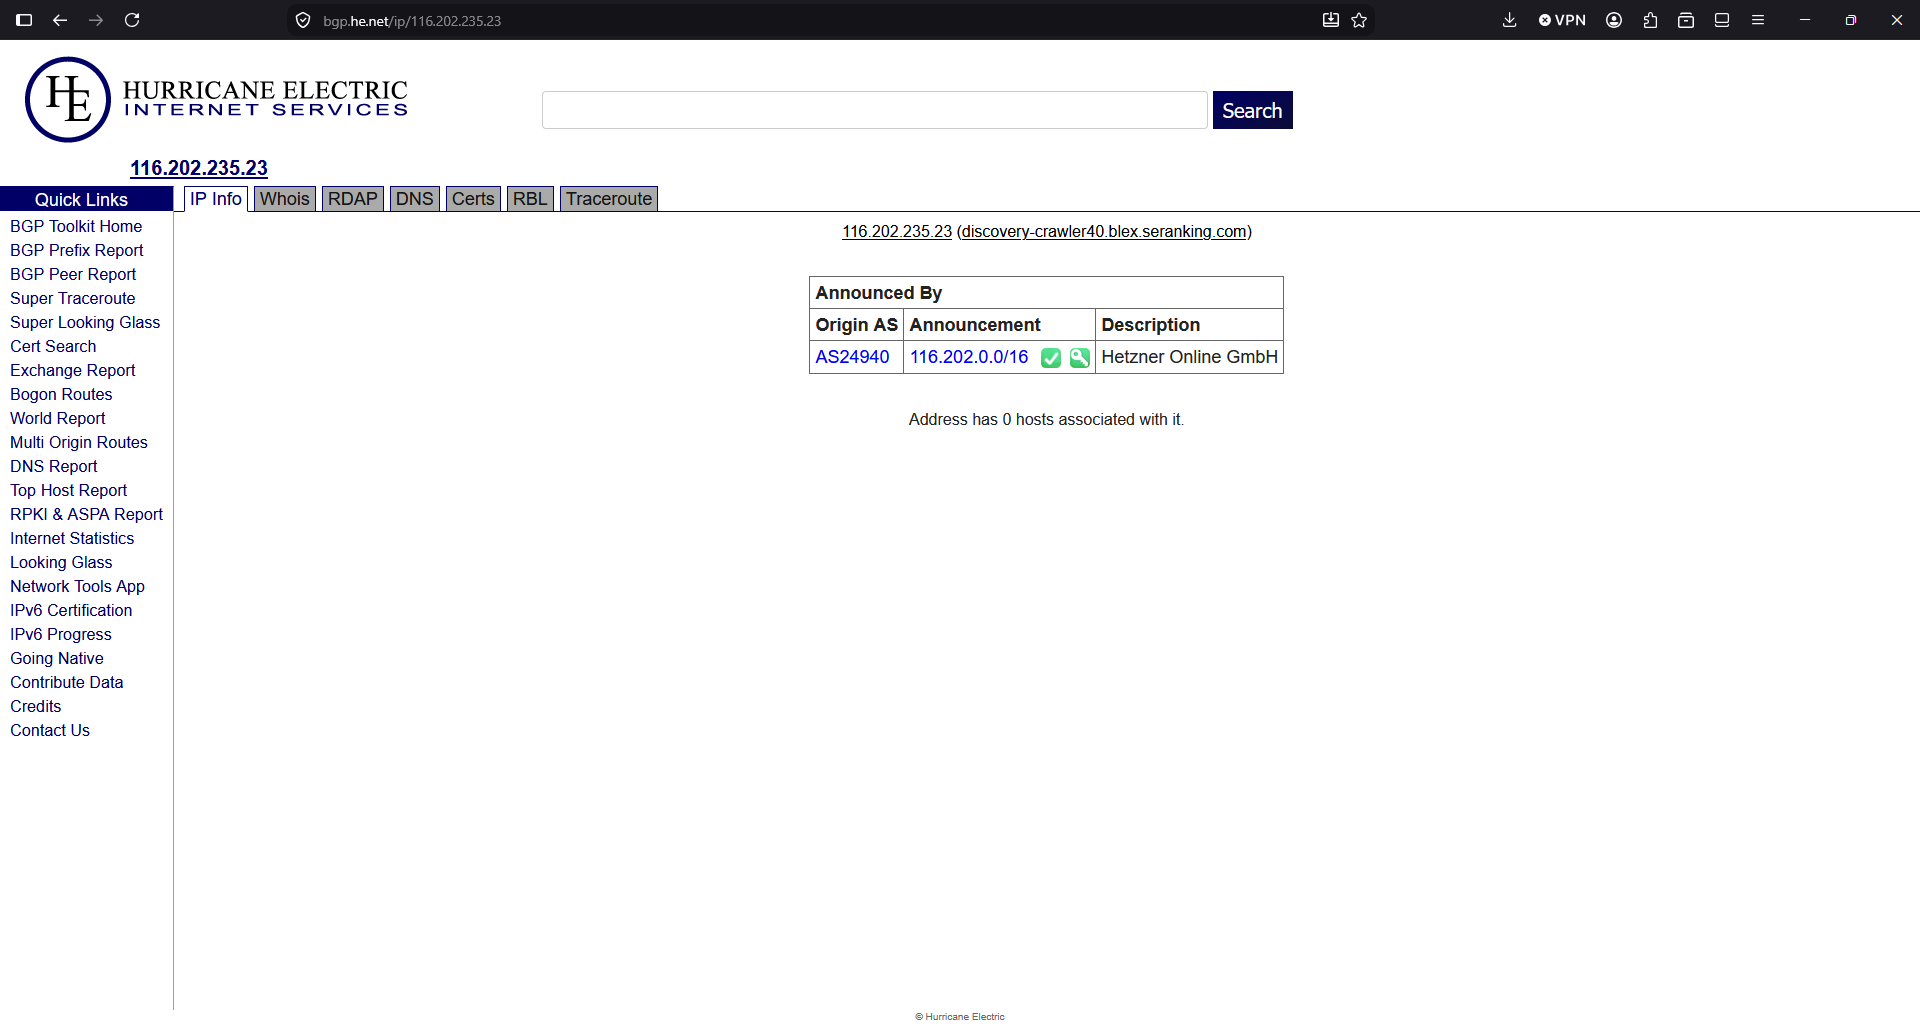
It’s from hetzner, a Cloud provider. https://bgp.he.net/net/74.7.0.0/16
Another 65,536 addresses that get blocked:
# Hetzner
ufw insert 1 deny from 116.202.0.0/16  to any
The third IP will be blocked too, even if I didn’t find any information about who owns the block of IPs.
ufw insert 1 deny from 3.41.188.33 to any
The fourth was part of the same block I blocked first, so it’s already blocked.
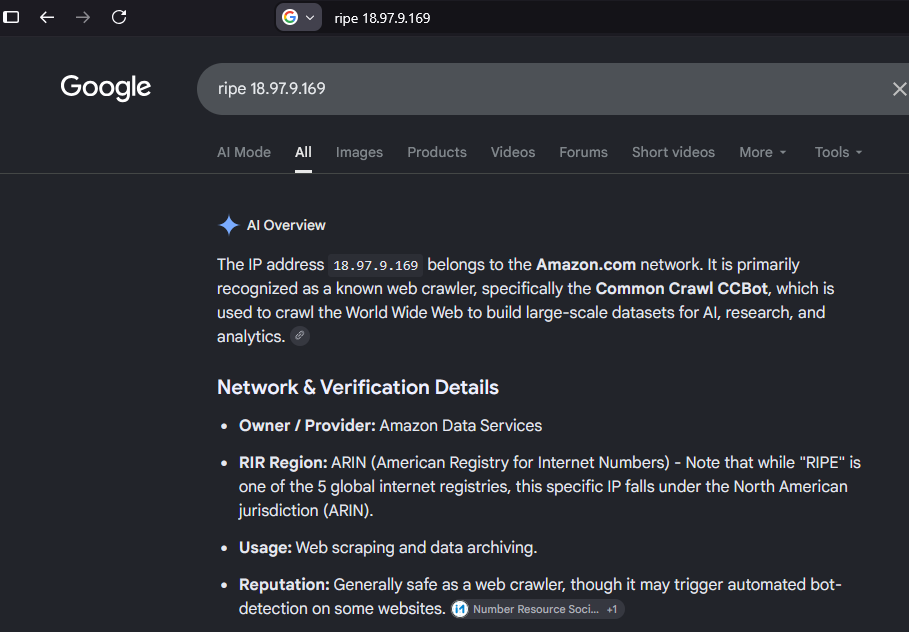
The fifth IP, I ask to Google Gemini:
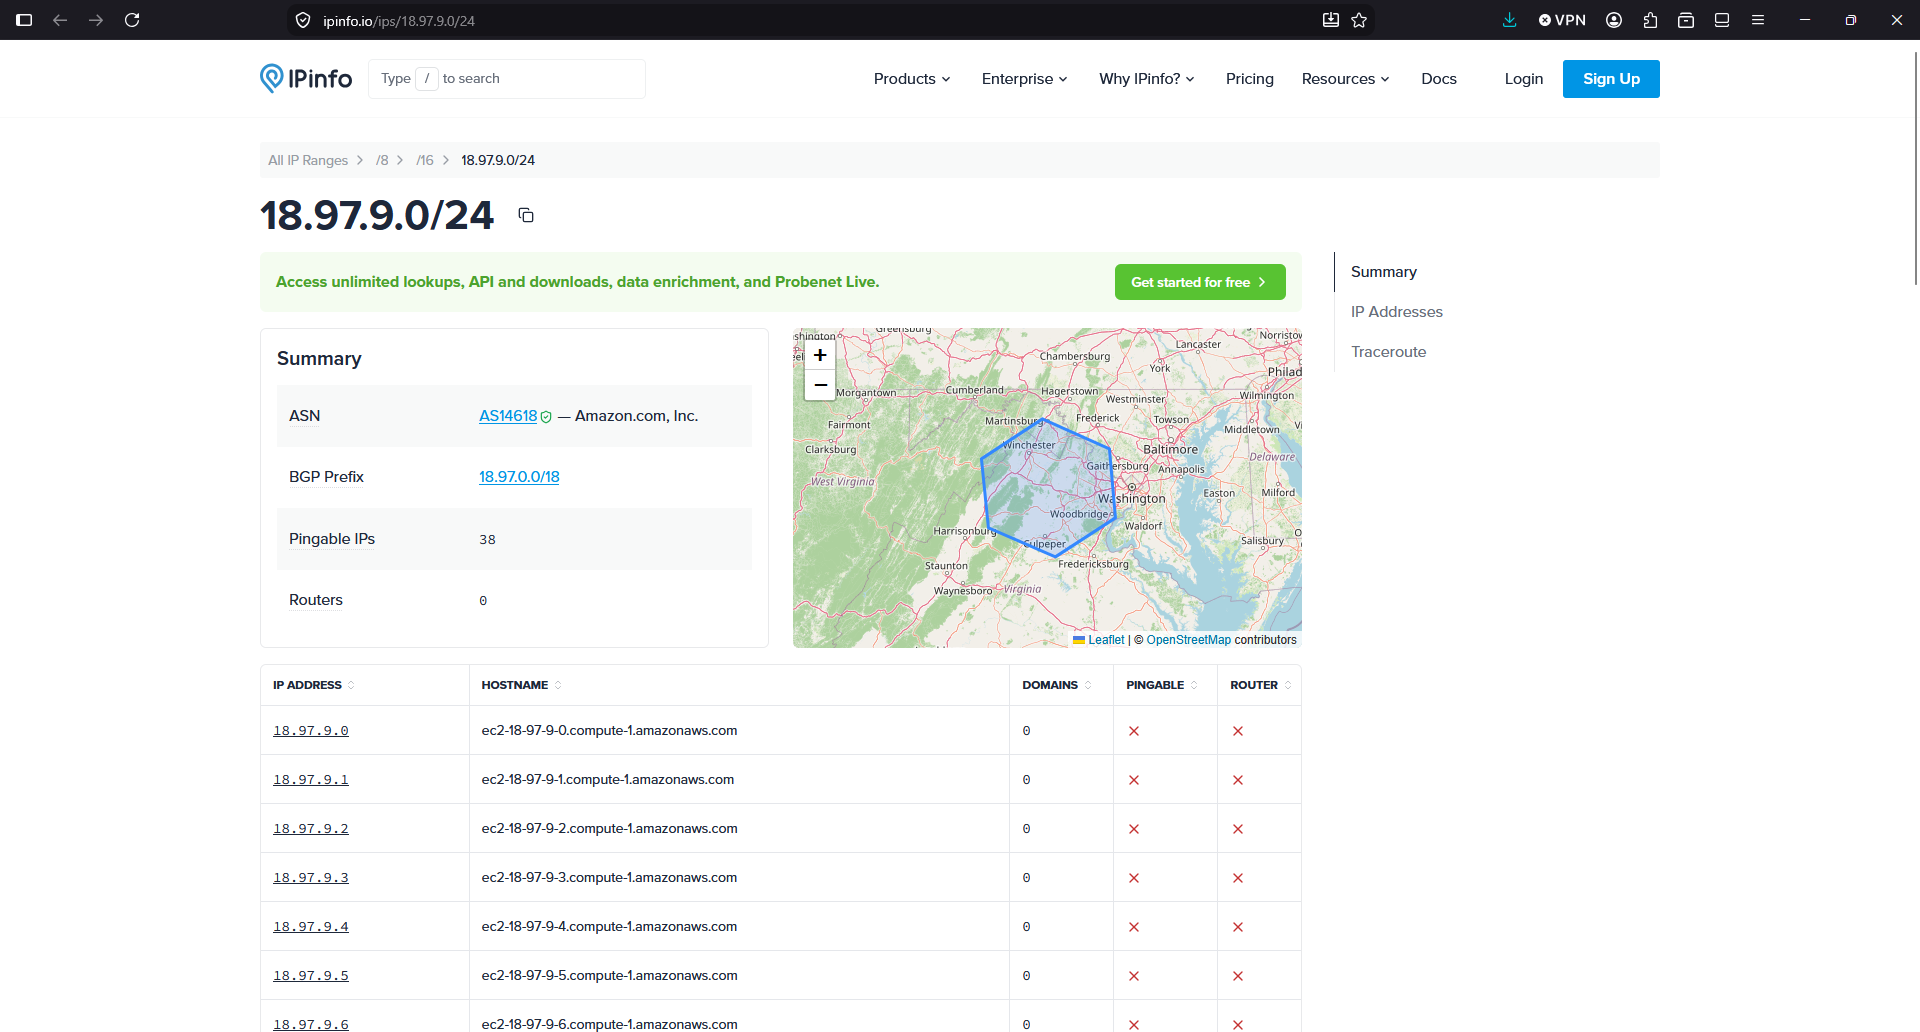
The block is 18.97.9.0/24 but I’ll block all the BGP Prefix, all the 16K addresses.
ufw insert 1 deny from 18.97.0.0/18 to any
See what is the traffic from the servers since I blocked the Microsoft range in the Ubuntu Firewall:
As you can see, after I blocked the first abusive IP allegedly from Microsoft with seemingly OpenAI User-Agent falsified, all the egress traffic went down.
I like how Google reacted when I contacted them. And I should have checked the Network traffic bandwidth first. So I decided to keep the WordPress instance in Google Cloud.
But the new instance “ubuntu26-04” I’m migrating it to the new server. What they offer for the price is much better, and the price of the storage really it’s important for some of my projects. The unlimited bandwidth usage in the new provider it’s also key.
The Billing report from Google Cloud doesn’t show the data up to the moment. But the 16th of August I was able to see that from the 12th and absolutely on 13th and 14th the egress Internet cost have almost disappeared.
Not all is perfect. I had to learn the web interface from that provider (I used it in the past, but companies change the user interface very often nowadays, causing headaches to users), the place were my VPS was listed was hidden and difficult to find, and by default the VPS had no firewall enabled. Something that I believe that is basic to have enabled by default.
But I think it will be great for my projects and for my budget, to have all those new resources available (8 vCPU and 24 GB of RAM and 200 GB of NVMe disk for the same cost provided in Google Cloud of 2 vCPU and 4 GB of RAM and 20 GB of standard disk).
In fact, the speed I have detected transferring from/to sendmeafile with the new provider shows a great improvement.
Take one thing in mind: They AI is hungry for contents, and the mega-rich AI providers are making you pay the bill, by scanning your sites non-stop.
The new provider says it provides 3 Gbps of bandwidth for the instance, with no data usage limits (not having to pay for GB transferred). If I had not reacted fast, the forecast for this month with Google for just a single instance was 300€. It is a risk for developers and small companies, to have the possibility to face a huge bill because more frequent every day bots/crawlers/AIs and processes attempting to breach in your servers, cause your server to use a lot of egress data. So it is worth considering using a Cloud Provider with unlimited data plan. Or at least, activate the Billing Alerts to be notified if your costs exceed a certain threshold.
If you have problems with abusive bots degrading your Drupal or WordPress performance, I created a commercial WordPress plugin and a commercial Drupal module that automatically and easily record and block offending IP Addresses.
As I’m seeing many people that embraces the hype of blindly trusting IA, and not reviewing the code, I want to share with you a case, where Claude Fable 5 introduced an error in Production, in the payment process of a side project, in July 2026.
Reviewing routinely the payment transactions, I noticed a 100€ purchase from which I didn’t know.
I located the user that paid and I saw that in the database that payment was not registered.
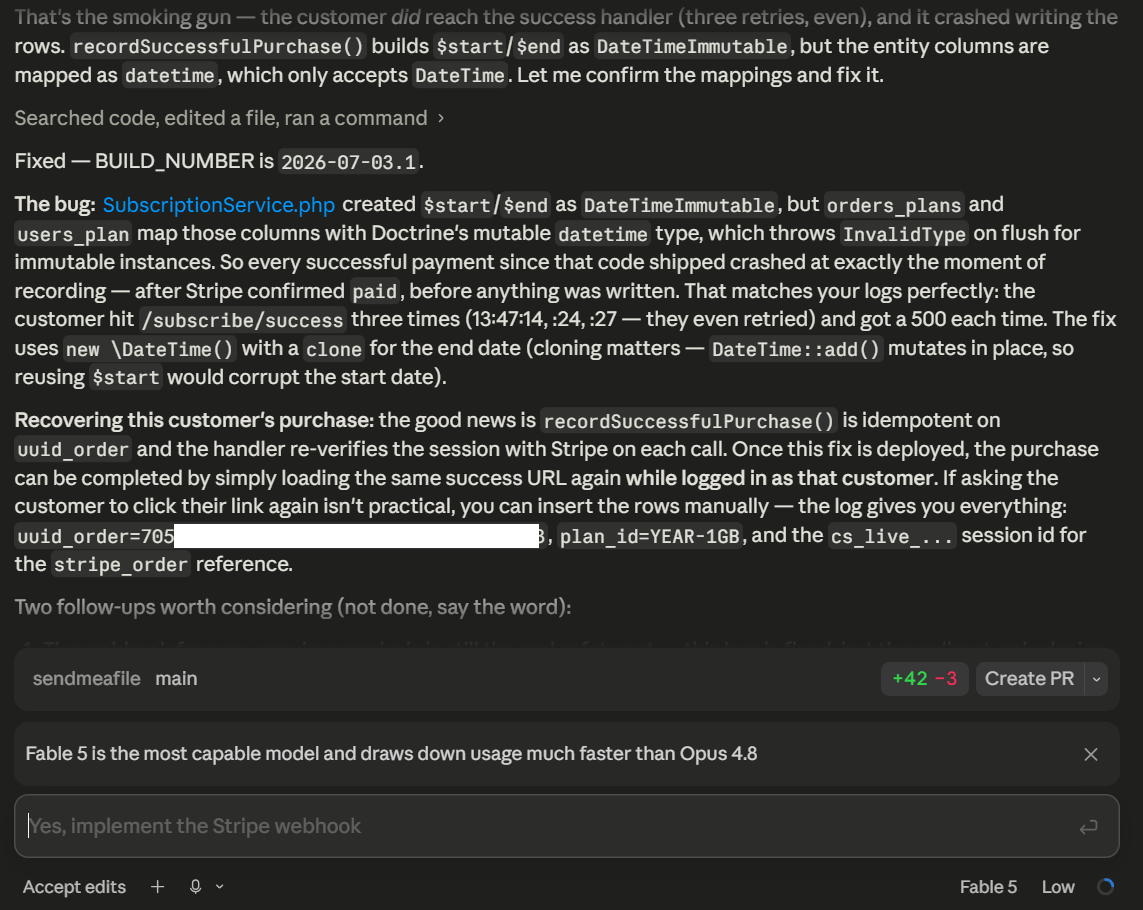
I checked the PHP logs in that time range and I saw a 500 error, just after the user paid in the payment provider and came back to the site, just in the moment that the database is updated.
The user tried 3 times to refresh the payment page.
The error was, that Claude had introduced objects of the type DateTimeImmutable, so a date/time that cannot be changed.
But Doctrine was mapping a a mutable DateTime, and that was incompatible, and crashed.
It was a programming error introduced by Claude.
So, after a successful payment, when the user came back to the site, it would get an error, always, and the table reflecting that the plan was paid would never get updated. I didn’t review most of the code of the new features. When I created the project I tested against the test sandbox and everything worked, and I moved to Production. But at some point, in the development of the next features, the payment process was broken.
So, Claude broke the payment, and neither me or it detected it.
After every new code change I had tried the new functionalities, checked the database changes, but I didn’t validate again the payment flow. Basically, after I moved to Production my provider disabled the Test payment sandbox, so, in order to test the full flow I had to pay 100€ for real and as I tried at the beginning, I didn’t try it again.
So, at some point, Claude introduced a bug, that I didn’t detect, that Claude didn’t detect, and that was impacting directly in the payment process, and I had a user that paid and that had no service and he never contacted me.
I reached the user and explained that I had a technical problem, and I offered a refund but the user declined, he wanted the service. What I did was to upgrade their plan for free to have 100 times more capacity, as thanks for their fidelity.
I implemented the mechanisms so an error like this cannot happen again, but as I see many decision makers trusting blindly the AI, I wanted to share this real experience, not detected, with impact in the payment process.
This is a good lesson to learn with a personal side project that it’s starting, but would be an ugly one to discover with an already running system from a system, already generating thousands of euros per hour.
That’s the explanation that Claude Fable 5 provided to me.
If you use AI for generating code you know that it makes mistakes. Claude is very good, but some times it makes mistakes. It may be a random character introduced in a Varnish config file, or a missing + sign, pointing to an inexistent line number on a file, or introducing incorrect expression in a nginx host config section or a Symfony route. Most of the times the modern models catch the errors before, but not always.
We spent decades trusting deterministic programs, which given the same input and environment, produce the same output.
But you should bear in mind that the generative AI is not deterministic, which means that given the same input it produces different outputs.
Having different agents with different roles is useful, and an improvement, although it’s expensive in tokens and may miss errors.
Asking for a Code Review to the AI is a good thing too. But some times, the AI does not follow the rules, and ignores your instructions and not everything is cached.
That’s why I recommend to use deterministic processes, to add more certainty: Automations, programs and scripts that validate, Unit Testing, Functional testing, etc…
So I show here how I launched a fresh Ubuntu 24.04 in Google Cloud, on 2026-05-04, and demostrate the exploit of escalation privileges Copy Fail (CVE-2026-31431) which allows you to become root from a regular user account in almost any Linux since year 2017.
It consists in the execution of a Python 3 code, which is only 732 bytes.
I show how I fixed it by upgrading the kernel and rebooting.
You have installed eZ Launchpad, and you can execute the binary ez from your home folder or other paths, however when you execute it from a project folder you cloned with git (with its .platform.app.yaml file) ez returns to prompt without any error message.
The exit code is 255, but even if you strace the process you don’t find the exact problem.
Inside your project you run ez without any argument in a clean install of Ubuntu 24.04 LTS with PHP 8.3, or with PHP 8.4, without xDebug, without opcache, without memory limit… nothing works with no visible error message in the logs or in the error output. However if you run it outside the project folder, it works, and it displays the typical help messages.
I reproduced this behavior on several Ubuntu computers. The fix I found is to execute ez with PHP 8.1
You can install PHP8.1 from ondrej repository, then you can update alternates to execute PHP 8.1 by default in your system, or you create the project by invoking ez with PHP 8.1 explicitly with:
php8.1 ~/ez create
This will kickstart the creation of your ez project based on Docker containers.
If you are getting an error like this when you try to provision using rsync or running commands from SSH from a Docker Instance from a worker node in Jenkins, having your SSH Key as a variable in Jenkins, here is a way to solve it.
These are the kind of errors that you’ll be receiving:
Load key "ssh_yourserver": invalid format

web@myserver.carlesmateo.com: Permission denied (publickey).

rsync: connection unexpectedly closed (0 bytes received so far) [sender]

rsync error: unexplained error (code 255) at io.c(235) [sender=3.1.3]

script returned exit code 255
So this applies if you copied your .pem file as text and pasted in a variable in Jenkins.
You’ll find yourself with the load key invalid format error.
I would suggest to use tokens and Vault or Consul instead of pasting a SSH Key, but if you need to just solve this ASAP that’s the trick that you need.
First encode your key with base64 without any wrapping. This is done with this command:
Note that in this case I’m ignoring Strict Host Key Checking, which is not the preferred option for security, but you may want to use it depending on your strategy and characteristics of your Cloud Deployments.
Note also that I’m indicating as User Known Hosts File /dev/null. That is something you may want to have is you provision using Docker Containers that immediately destroyed after and Jenkins has not created the user properly and it is unable to write to ~home/.ssh/known_hosts
I mention the typical errors where engineers go crazy and spend more time fixing.
Here is the complete history of why I migrated all the services from my 11 years old Amazon account to other CSP.
Some lessons can be learned from my adventure.
I migrated my last services from Amazon to GCP
Amazon sent me an email on October 6th, this year 2021, telling me that they will disable EC2-Classic by August 2022. I thought I would not be able to keep my Static Ip’s as in the past VPC Ip’s and EC2-Classic Ip’s were not transferable, so considering that I would loss my Static Ip’s anyway I started to migrate to some to other providers like Digital Ocean.
Is not cool losing Static Ip (Elastic Ip in AWS) Addresses as this is bad for SEO, so given that I though I would lose my Static Ips that have been with me for years, I started to migrate certain services to providers much more economic.
Amazon is terrible communicating, and I talked with some product managers in the past about that, when they lost one of my Volumes, and the email was so cold and terrible that actually that hurt more than Amazon losing my Data. I believed that it was a poorly made Scam and when I realized it was true I reached one of my friends, that is manager there, as I know they care for doing things right, and he organized a meeting with two PM so I can pass my feedback.
The Cloud providers are changing things very fast, and nobody is able to be up to date with the changes, unless their work position allows plenty of time to get updated. Even if pages of documentation are provided, you have to react to an event that they externally generated forcing you to action. Action to read all the documentation about EC2-Classic migrations, action to prepare to have migrated by August 2022.
So August 2022… I was counting that I had plenty of time but I’m writing a new book about using the Amazon SDK for Python, boto3, and I was doing some API calls and they started to fail in a very unusual way, Exceptions with timeout, but only for the only region where I had EC2-Classic.
urllib3.exceptions.NewConnectionError: <botocore.awsrequest.AWSHTTPSConnection object at 0x7f0347d545e0>: Failed to establish a new connection: [Errno -2] Name or service not known
But if I switched to another region name, it would work:
region_name='us-west-2',
I made a mistake in here, the region name is “us-east-1” and not “us-east-1a“. “us-east-1a” is the availability zone. So the SDK was giving a timeout because in order to connect to the endpoint it uses the region name as part of the hostname. So it doesn’t find that endpoint because it doesn’t exist.
I never understood why a company like Amazon is unable to provide the SDK with a sample project or projects 100% working, with the source code so people has a base that works to build up.
Every API that I have created, I have provided it with documentation but also with example for several languages for how to use it.
In 2013 I was CTO of an online travel agency, and we had meta-searchers consuming our API and we were having several hundreds of thousands requests per second. Everything was perfectly documented, examples were provided for several languages, the document and the SDK had version numbers…
Everybody forgets about Developers and companies throw terrible and cold products to the poor Developers, so difficult to use. How many Developers would like to say: Listen Mr. President of the big Cloud Company XXXX, I only want to spawn a VM that works, and fast, with easy wizards. I don’t want to learn 50 hours before being able to use your overpriced platform, by doing 20 things before your Ip’s are reflexes of your infrastructure and based in Microservices. Modern JavaScript frameworks can create nice gently wizards even if you have supercold APIs.
Honestly, I didn’t realize my typo in the region and I connected to the Amazon Console to investigate and I saw this.
Honestly, when I read it I understood that they were going to end my EC2 Networking the 30th of October. It was 29th. I misunderstood.
It was my fault not reading it well to the end, I got shocked by the first part telling about shutdown and I didn’t fully understood as they were going to shutdown EC2-Classic for the zones I didn’t had anything running only.
From the long errors (3 exceptions chained) I didn’t realize that the endpoint is built with the region name. (And I was passing the availability zone)
botocore.exceptions.EndpointConnectionError: Could not connect to the endpoint URL: "https://ec2.us-east-1a.amazonaws.com/"
Here is when I say that a good SDM would had thought and cared for the Developers more, and would had made the SDK to check if that region exists. How difficult is to create a SDK a bit more clever that detects a invalid region id?. It is not difficult.
It is true that it was late in the evening and I was tired of all the day, and two days of the week between work and zoom university classes I work 15 hours and 13 hours respectively, not counting the assignments, so by the end of the week I am very tired. But that’s why it is very important to follow methodology and to read well. I think Amazon has 50% of the fault by the way they do things: how the created the SDK, how they communicate, and by the errors that the console returned me when I tried to create a VPC instance of an EC2-Classic AMI (they seem related to the fact I had old VPC Network objects with shorter hash than the current they use) and the other 50% was my fault for not identifying the source of the error, and not reading the message in their website well.
But the fact that there were having those errors in the API’s and timeouts made me believe they were going to cut the EC2-Classic Networking the next day.
All the mistakes fall together in a perfect storm.
I checked for documentation and I saw it was possible to migrate my Static Ip’s to VPC Static Ip’s.
It was Friday evening, and I cancelled my plans, in order to migrate the Blog to VPC in an attempt to keep running it with Amazon.
As Cloud Architect, I like to have running instances in several CSP as it allows me to stay up to date with the changes they do.
I checked the documentation for the migration. Disassociating the Static Ip (Elastic Ip in AWS jargon) was easy. Turning into VPC as well.
As I progressed, what had to be easy turned into a nightmare, as I was getting many errors from the Amazon API, without any information, and my Instances were not created.
I figured out that their API could have problems with old VPC objects I created time ago, so I had to create new objects for several things.
I managed to spawn my instances but they were being launch and terminated instantly without information. Frustrating.
When launching a new instance from the AMI (a Snapshot of the blog), I was giving shown options to add more volumes without any sense. My Instance was using 16GB from a 20GB total Space, and I was shown different volume configs, depending on the instance, in some case an additional 20GB volume, in other small SSD, ephemeral and 10 GB for the AMI (which requires at least 16GB).
After some fight I manage to make it work after deleting the volumes that made no sense, and keeping only one of 20GB, the same size of my AMI.
But then my nightmare started to make the VPC Instance to have Internet access and to be seen from outside. I had to create a new Internet Gateway, NAT, Network, etc…
As mentioned the old objects I was trying to reusing were making the process to fail.
I was running out of time, and I thought in few time they were going to shutdown EC2-Classic network (as I did not read correctly), so I decided to download everything and to migrate to another provider. For doing that first I blocked all the traffic, except for my Ip.
I worked in parallel, creating the new config in Google Cloud, just in case I had forgot something. I had created a document for the migration and it was accurate.
I managed to do everything fast enough. The slower part was to download all the Data, as I hold entire VM’s for projects like Cassandra Universal Driver.
Then I powered off my Amazon Instance for the Blog forever.
In GCP I blocked all the traffic in the firewall, except for my Ip, so I could work calmly.
When everything was ready, I had to redirect the DNS to the new static Ip from Google.
The DNS provider I used had implemented some changes in their API so I was getting errors replacing my old entry ‘.’ (their JSON calls returned Internal Server Error). Finally I figured it out how to workaround it and I was able to confirm that the first service was up and running.
I did some tests to make sure there were not unexpected permission problems, entries in the logs, etc…
Only then I opened the Google Firewall. I have a second firewall in each instance where I block or open at Ip tables level what I want. Basically abusive bot’s IPs trying to find exploits or brute force by dictionary passwords.
I checked with my phone, without Wifi that the Firewall was all good. (It is always a good idea to use another external Ip, different from the management one, to check)
I have read a lot of wrong recommendations about the use of Swap and Swappiness so I want to bring some light about it.
The first to say is that every project is different, so it is not possible to make a general rule. However in most of the cases we want systems to operate as fast and efficiently as possible.
So this suggestions try to covert 99% of the cases.
By default Linux will try to be as efficient as possible. So for example, it will use Free Memory to keep IO efficient by keeping in Memory cache and buffers.
That means that if you are using files often, Linux will keep that information cached in RAM.
The swappiness Kernel setting defines what tradeoff will take Linux between keeping buffers with Free Memory and using the available Swap Memory.
# sysctl vm.swappiness
vm.swappiness = 60
The default value is 60 and more or less means that when RAM memory gets to 60%, swap will start to be used.
And so we can find Servers with 256GB of RAM, that when they start to use more than 153 GB of RAM, they start to swap.
Let’s analyze the output of free -h:
carles@vbi78g:~/Desktop/Software/checkswap$ free -h
              total        used        free      shared  buff/cache   available
Mem:          2.9Gi       1.6Gi       148Mi        77Mi       1.2Gi       1.1Gi
Swap:         2.0Gi        27Mi       2.0Gi
So from this VM that has 2.9GB of RAM Memory, 1.6GB are used by applications.
The are 148MB that can immediately used by Applications, and there are 1.2GB in buffers/cache. Does that means that we can only use 148MB (plus swap)?. No, that mean that Linux tried to optimize io speed by keeping 1.2GB of RAM memory in buffers. But this is the best effort of Linux to have performance, for real applications will be also able to use 1.1GB that corresponds to the available field.
About swap, from 2GB, only 27MB have been used.
As vm.swappiness is set to 60, more RAM will be swapped out to swap, even if we have lots available.
As I said every case is different. If we are talking about a Desktop that has NVMe drives, the impact will be low. But if we are talking about a Server that is a hypervisor running VMs and has high usage on CPU and has the swap partition or the swap in a file, that could lead to huge problems. If there is a physical Server with a single spinning drive (or logical unit through RAID), and one partition is for Swap, and the other for mountpoints, and a process is heavily reading/writing to a partition mounted (an elastic search, or a telegraf, prometheus…), and the System tries to swap, then they will be competing for the magnetic head of disk, slowing down everything.
If you take a look on how the process of swapping memory pages from the memory to disk, you will understand that applications may need certain pages before being able to run, so in many cases we get to lock situations, that force everything to wait.
In my career I found Servers that temporarily stopped responding to ping. After a while ping came back, I was able to ssh and uptime showed that the Server did not reboot.
I troubleshooted that, and I saw a combination of high CPU usage spikes and Swap usage.
Using iostat and iotop I monitored what was speed of transference of only 1 MB/second!!.
I even did swapoff and it took one hour to free 4 GB swap partition!.
I also saw swap partition being in a spinning disk, and in another partition of the same spinning drive, having a swapfile. Magnetic spinning drives can only access one are of the drive at the same time, so that situation, using swap is very bad.
And I have seen situations were the swap or swapfile was mounted in a block device shared via network with the Server (like iSCSI or NFS), causing terrible performance when swapping.
So you have to adapt the strategy according to the project.
My preferred strategy for Compute Nodes and NoSQL Databases is to not use swap at all. In other cases, like MySQL Databases I may set swappiness to preferably to 1 or to 10.
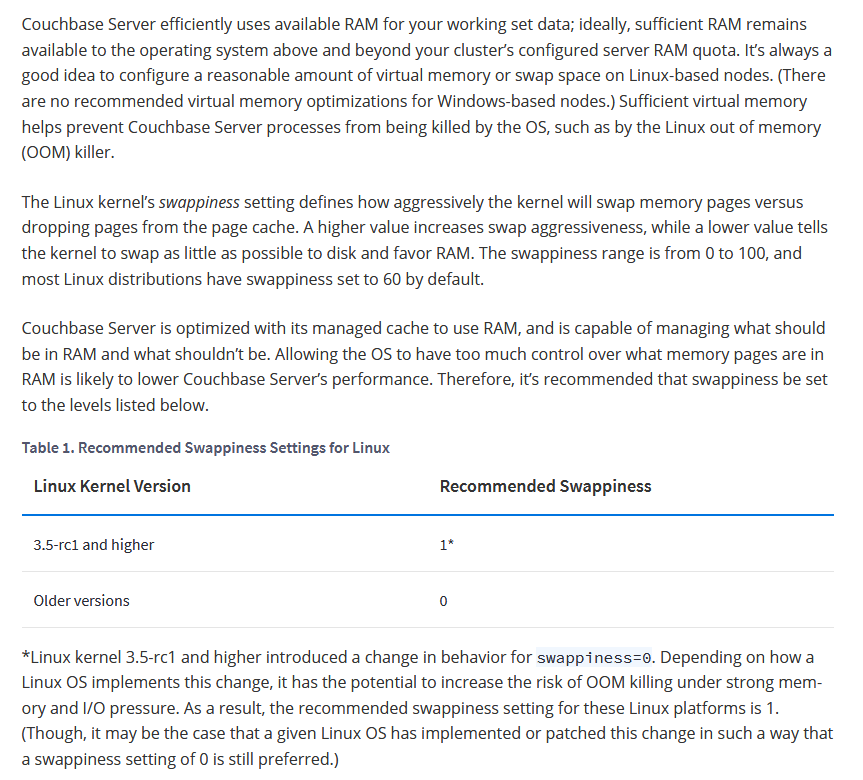
The Linux kernel’s swappiness setting defines how aggressively the kernel will swap memory pages versus dropping pages from the page cache. A higher value increases swap aggressiveness, while a lower value tells the kernel to swap as little as possible to disk and favor RAM. The swappiness range is from 0 to 100, and most Linux distributions have swappiness set to 60 by default.
Couchbase Server is optimized with its managed cache to use RAM, and is capable of managing what should be in RAM and what shouldn’t be. Allowing the OS to have too much control over what memory pages are in RAM is likely to lower Couchbase Server’s performance. Therefore, it’s recommended that swappiness be set to the levels listed below.
Another theme, is when you log to a Server and you see all the Swap memory in use.
Linux may have moved the pages that were less used, and that may be Ok for some cases, for example a Cron Service that waits and runs every 24 hours. It is safe to swap that (as long as the swap IO is decent).
When Kernel Swaps it may generate locks.
But if we log to a Server and all the Swap is in use, how can we know that the Swap has been quiet there?.
Well, you can use iostat or iotop or you can:
cat /proc/vmstat
This file contains a lot of values related to Memory, we will focus on:
Paging refers to writing portions, termed pages, of a process’ memory to disk. Swapping, strictly speaking, refers to writing the entire process, not just part, to disk. In Linux, true swapping is exceedingly rare, but the terms paging and swapping often are used interchangeably.
page-out: The system’s free memory is less than a threshold “lotsfree” and unnused / least used pages are moved to the swap area. page-in: One process which is running requested for a page that is not in the current memory (page-fault), it’s pages are being brought back to memory. swap-out: System is thrashing and has deactivated a process and it’s memory pages are moved into the swap area. swap-in: A deactivated process is back to work and it’s pages are being brought into the memory.
Values from /proc/vmstat:
pgpgin, pgpgout – number of pages that are read from disk and written to memory, you usually don’t need to care that much about these numbers
pswpin, pswpout – you may want to track these numbers per time (via some monitoring like prometheus), if there are spikes it means system is heavily swapping and you have a problem.
In this actual example that means that since the start of the Server there has been 508992338 Page Swap In (with 4K memory pages this is 1,941 GB, so almost 2 TB transferred) and for Page Swat Out (with 4K memory pages this is 1,071 GB, so 1 TB of transferred). I’m talking about a Server that had a 4GB swap partition in a spinning disk and a 12 GB swapfile in another ext4 partition of the same spinning disk.
The 16 GB of swap were in use and iotop showed only two sources of IO, one being 2 VMs writing, another was a journaling process writing to the mountpoint where the swapfile was. That was an spinning drive (underlying hardware was raid, for simplicity I refer to one single drive. I checked that both spinning drives were healthy and fast). I saw small variations in the size of the Swap, so I decided to monitor the changes in pswpin and pswpout in /proc/vmstat to see how much was transferred from/to swap.
I saw then how many pages were being transferred!.
I wrote a small Python program to track those changes:
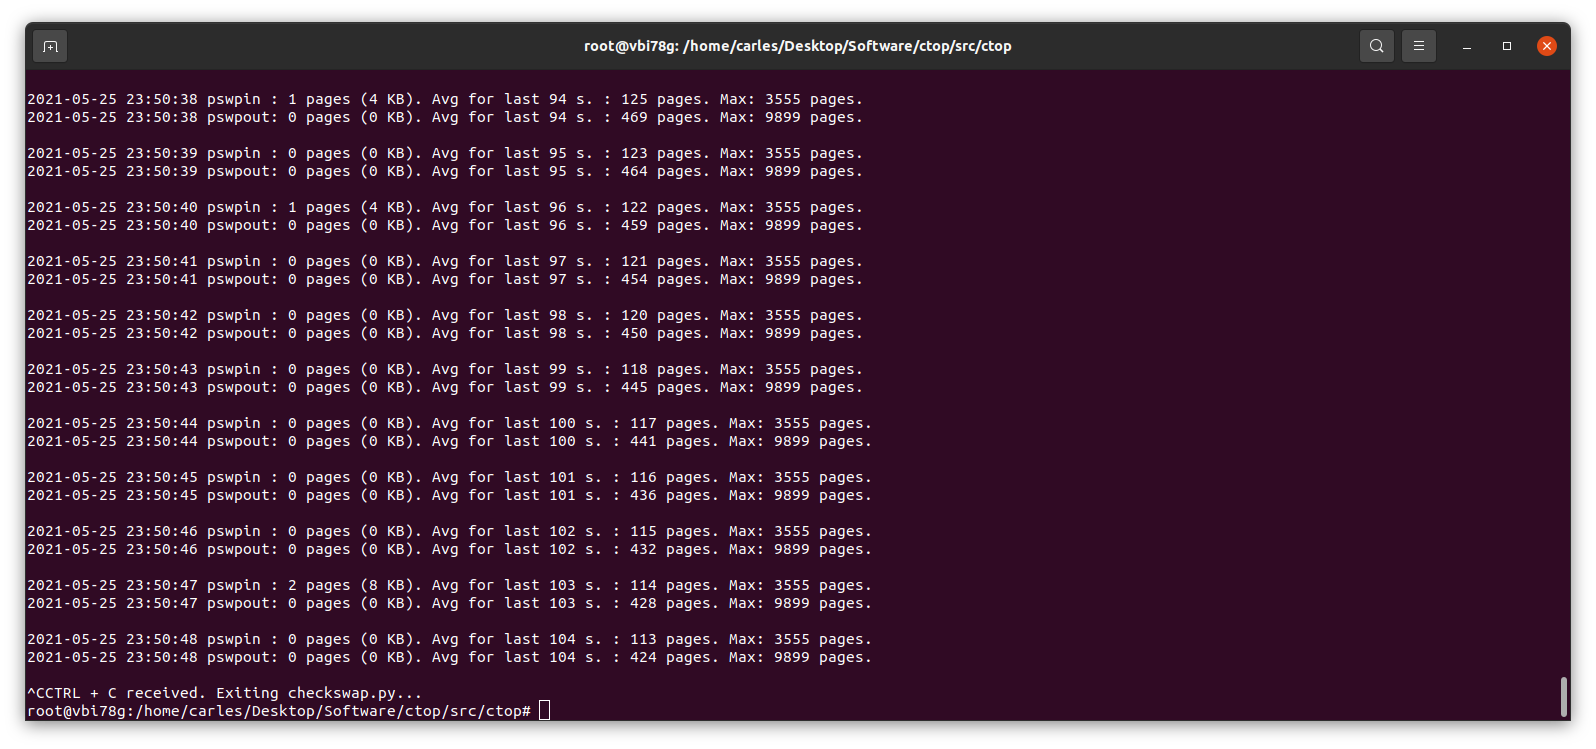
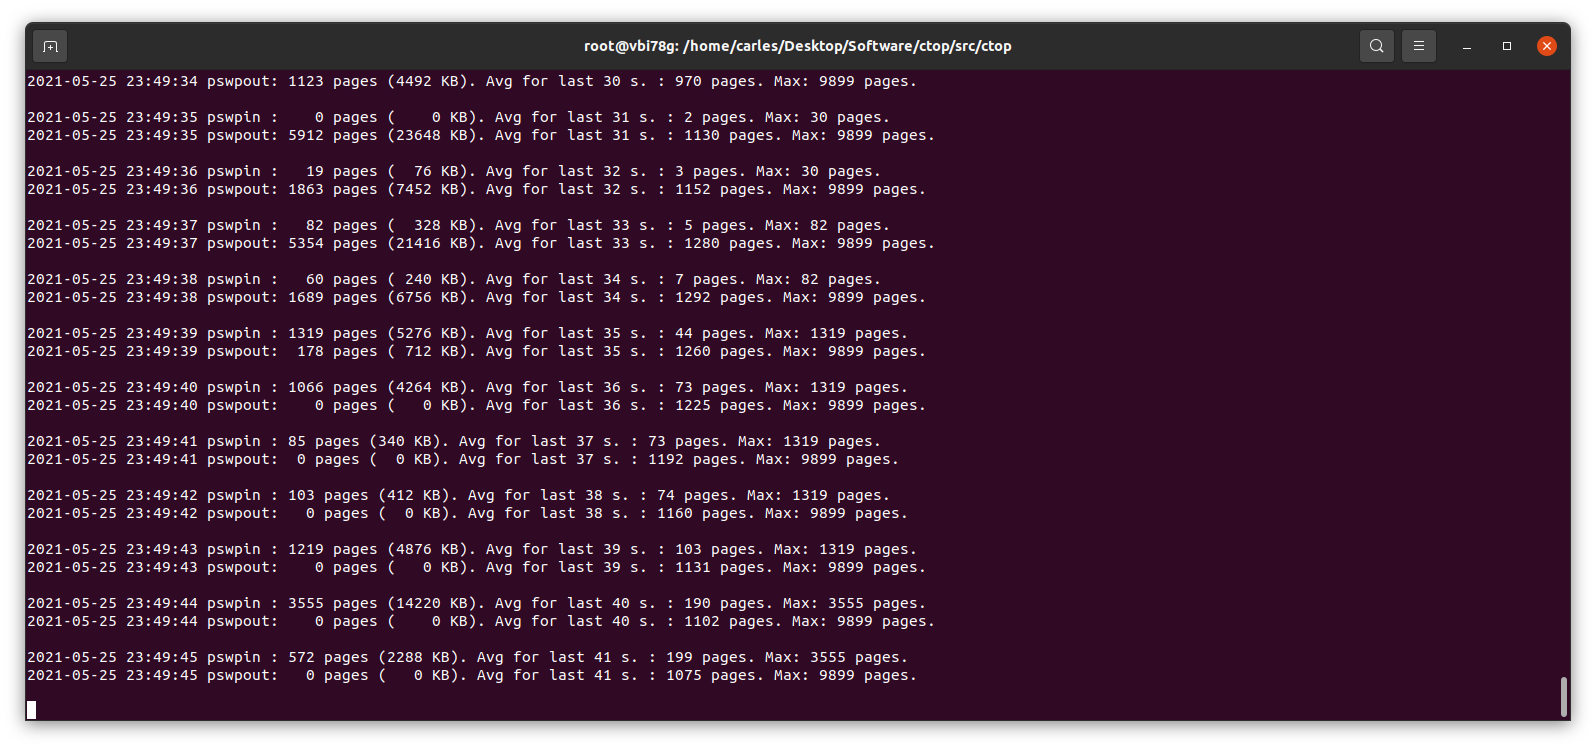
This little program works in Python 2 and Python 3, and will show the evolution of pswpin and pswpout in /proc/vmstat and will offer the average for last 5 minutes and keep the max value detected as well.
As those values show the page swaps since the start of the Server, my little program, makes the adjustments to show the Page Swaps per second.
A cheap way to reproduce collapse by using swap is using VirtualBox: install an Ubuntu 20.04 LTS in there, with 2 GB of less of memory, and one single core. Ping that VM from elsewhere.
Then you may run a little program like this in order to force it to swap:
#!/usr/bin/env python3
a_items = []
i_total = 0
# Add zeros if your VM has more memory
for i in range(0, 10000000):
    i_total = i_total + i
    a_items.append(i_total)
And checkswap will show you the spikes:
Many voices are discordant. Some say swappiness default value of 60 is good, as Linux will use the RAM memory to optimize the IO. In my experience, I’ve seen Hypervisors Servers running Virtual Machines that fit on the available physical RAM and were doing pure CPU calculations, no IO, and the Hypervisor was swapping just because it had swappiness to 60. Also having swap on spinning drives, mixing swap partition and swapfile, and that slowing down everything. In a case like that it would be much better not using Swap at all.
In most cases the price of Swapping to disk is much more higher than the advantage than a buffer for IO brings. And in the case of a swapfile, well, it’s also a file, so my suspect is that the swapfile is also buffered. Nothing I recommend, honestly.
My program https://gitlab.com/carles.mateo/checkswap may help you to demonstrate how much damage the swapping is doing in terms of IO. Combine it with iostat and iotop --only to see how much bandwidth is wasted writing and reading from/to swap.
You may run checkswap from a screen session and launch it with tee so results are logged. For example:
python3 checkswap.py | tee 2021-05-27-2107-checkswap.log
If you want to automatically add the datetime you can use:
python3 checkswap.py | tee `date +%Y-%m-%d-%H%M`-checkswap.log
Press CTRL + a and then d, in order to leave the screen session and return to regular Bash.
Type screen -r to resume your session if this was the only screen session running in background.
An interesting reflection from help Ubuntu:
The “diminishing returns” means that if you need more swap space than twice your RAM size, you’d better add more RAM as Hard Disk Drive (HDD) access is about 10³ slower then RAM access, so something that would take 1 second, suddenly takes more then 15 minutes! And still more then a minute on a fast Solid State Drive (SSD)…
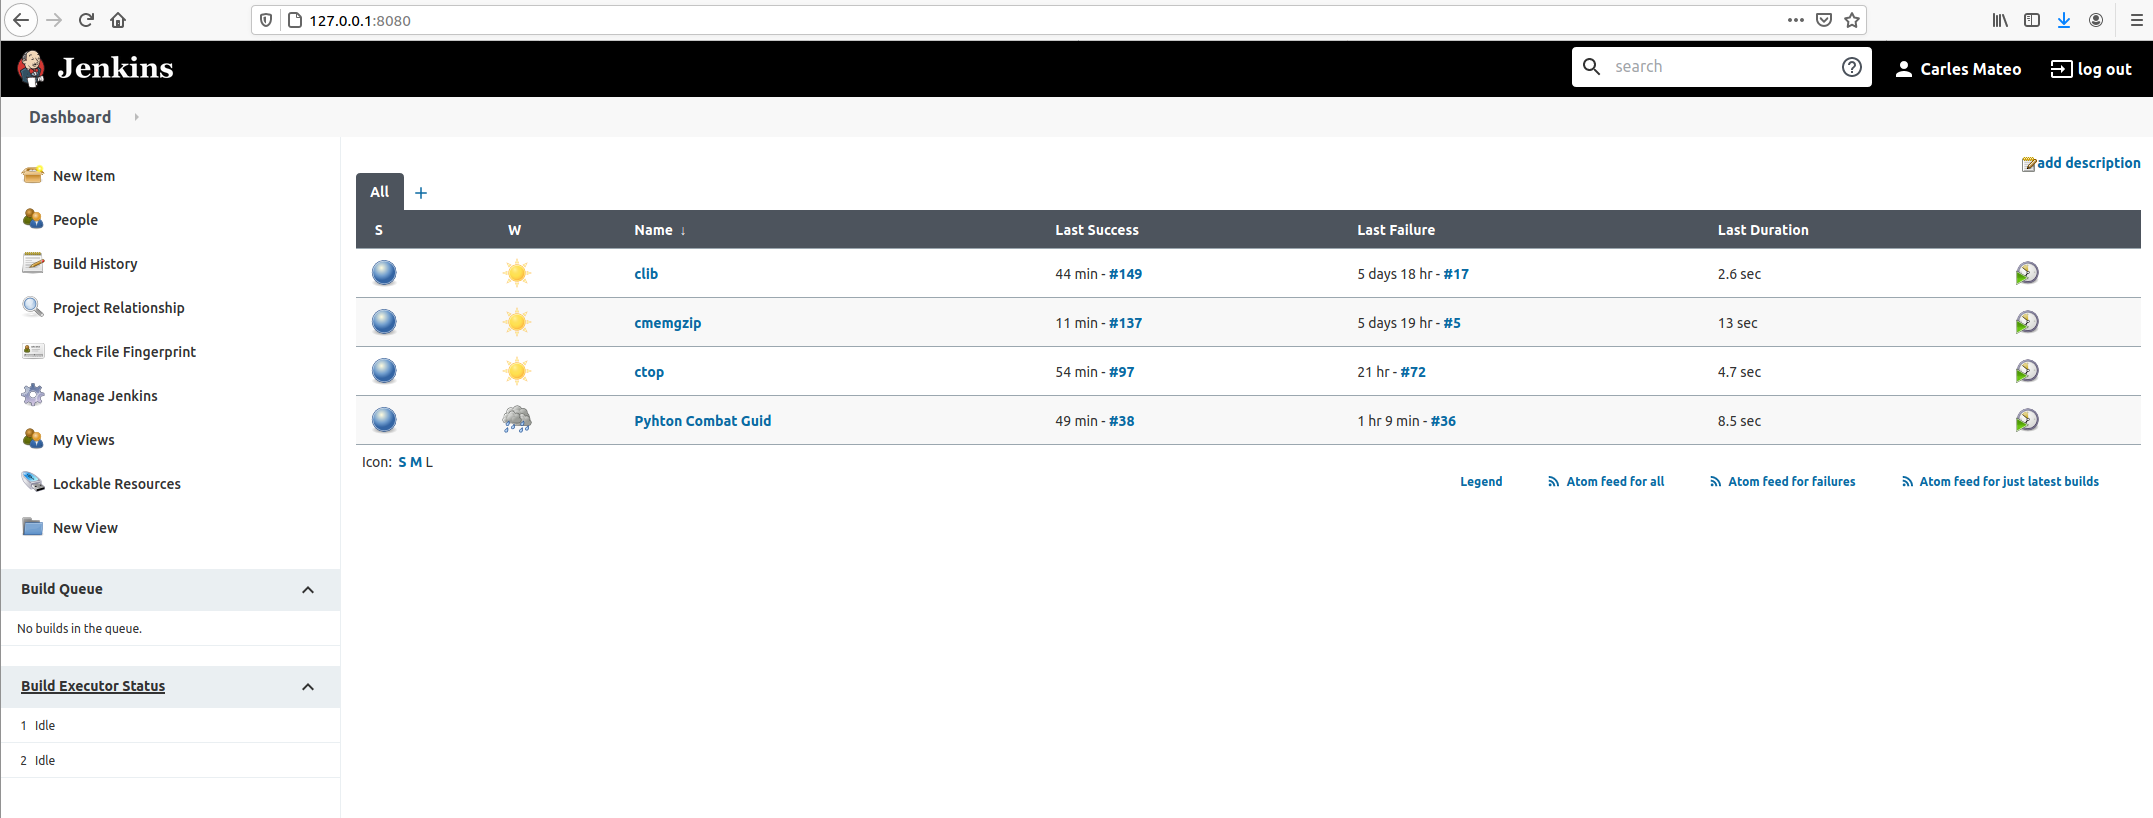
Obviously for companies is a must, but if you work in your own projects, it will be super great that you configure Jenkins, so you have continuous feedback about if something breaks.
I’ll show you how to configure Jenkins for several projects using only your main computer/laptop.
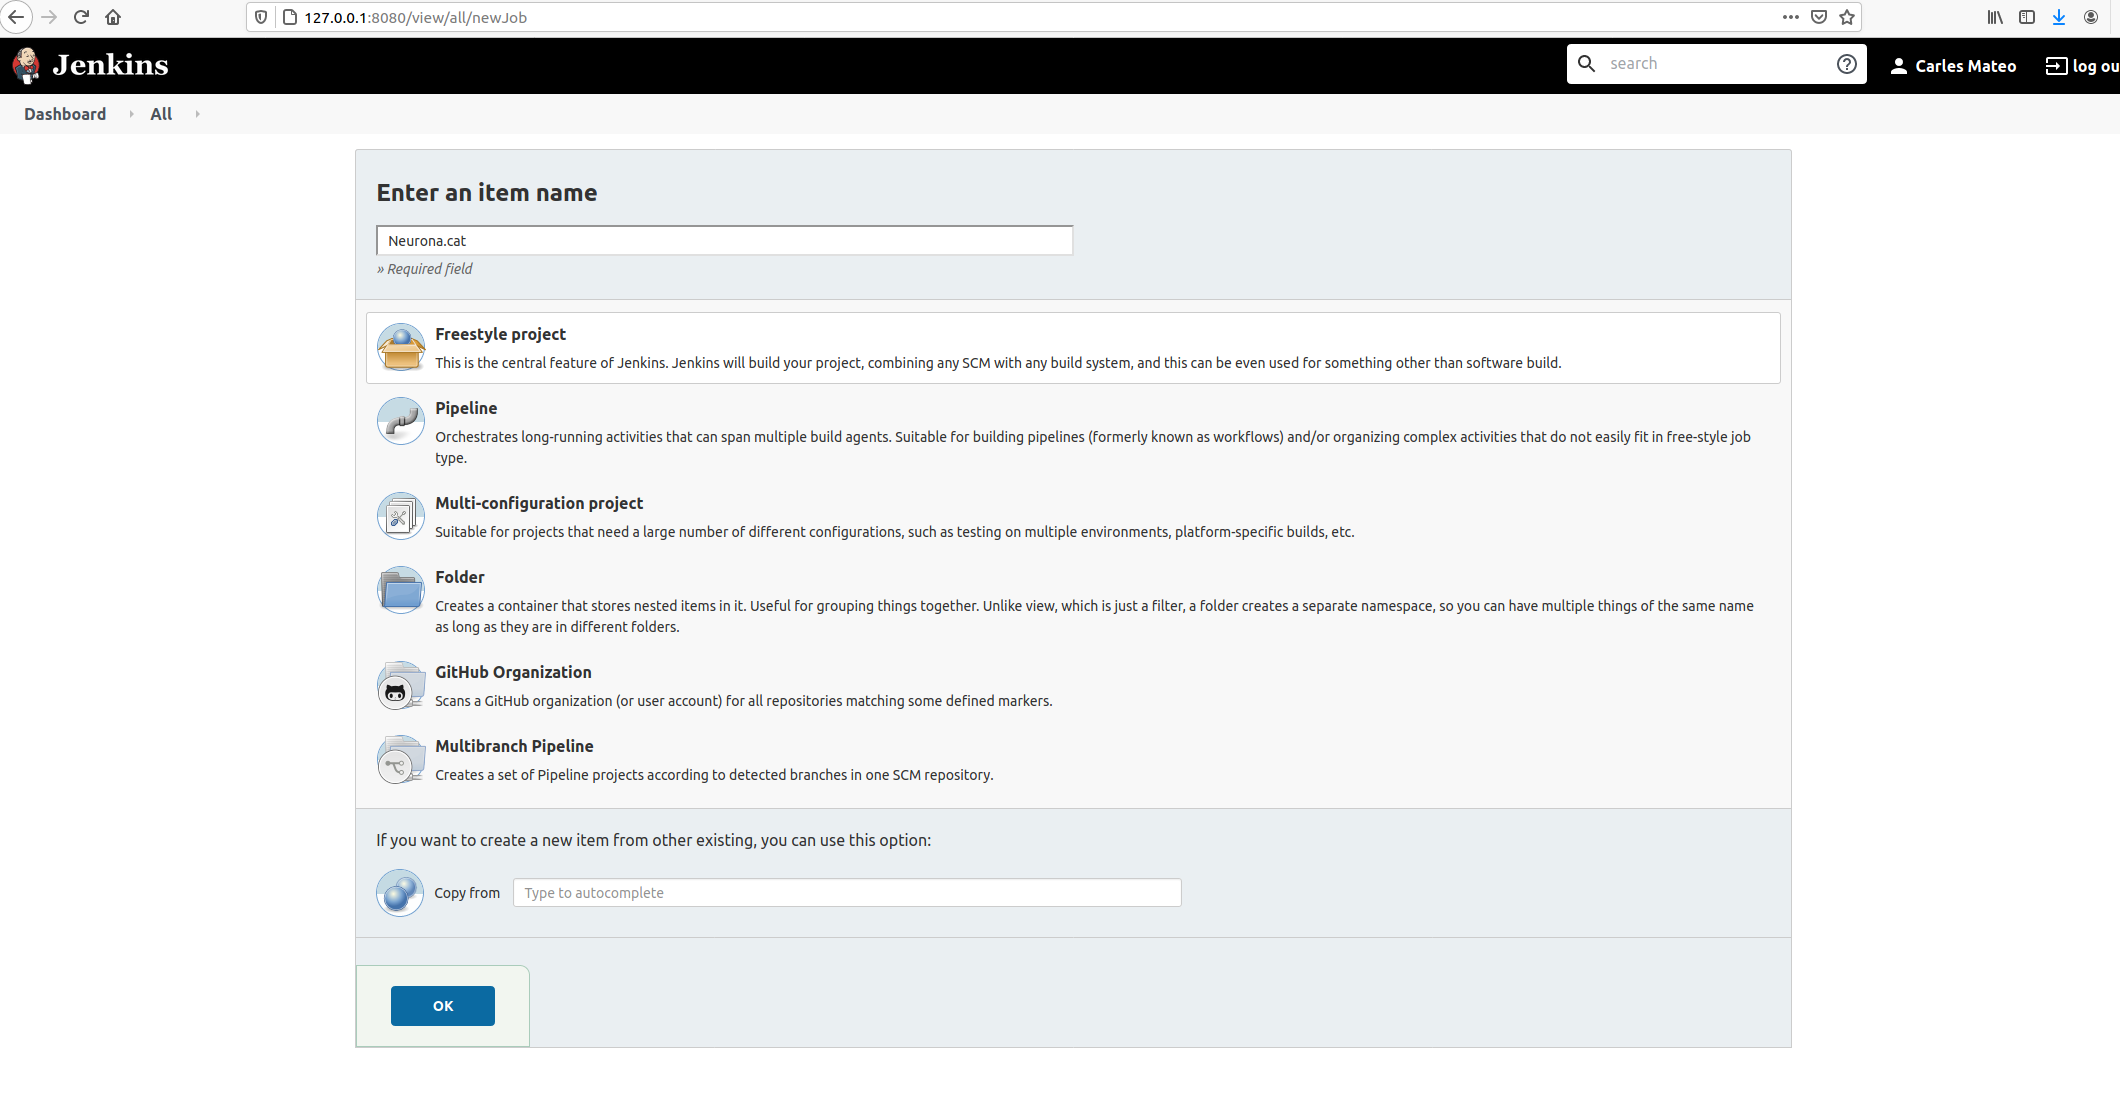
Then give it an appropriate name and choose Freestyle Project.
Take in count that the name given will be used as the name of the workspace, so you may want to avoid special characters.
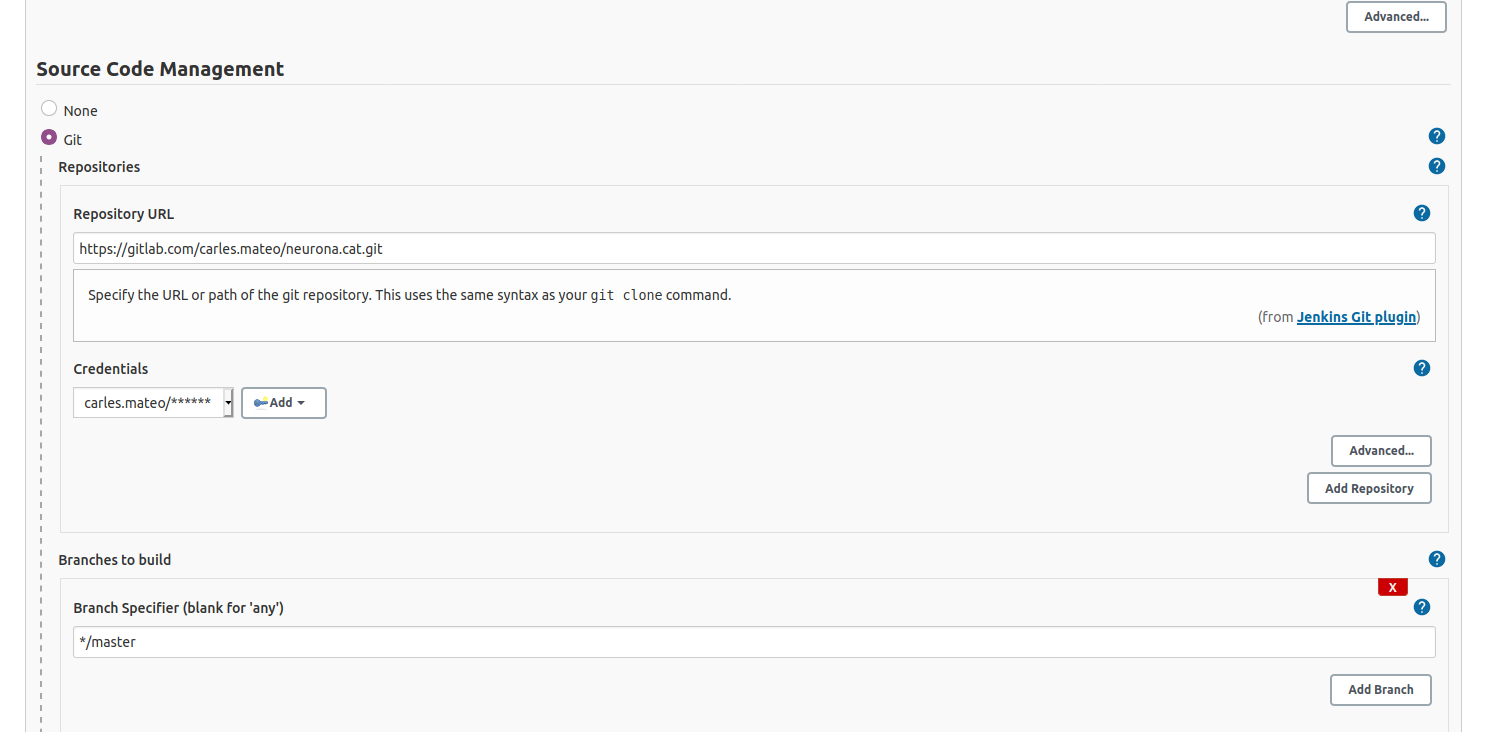
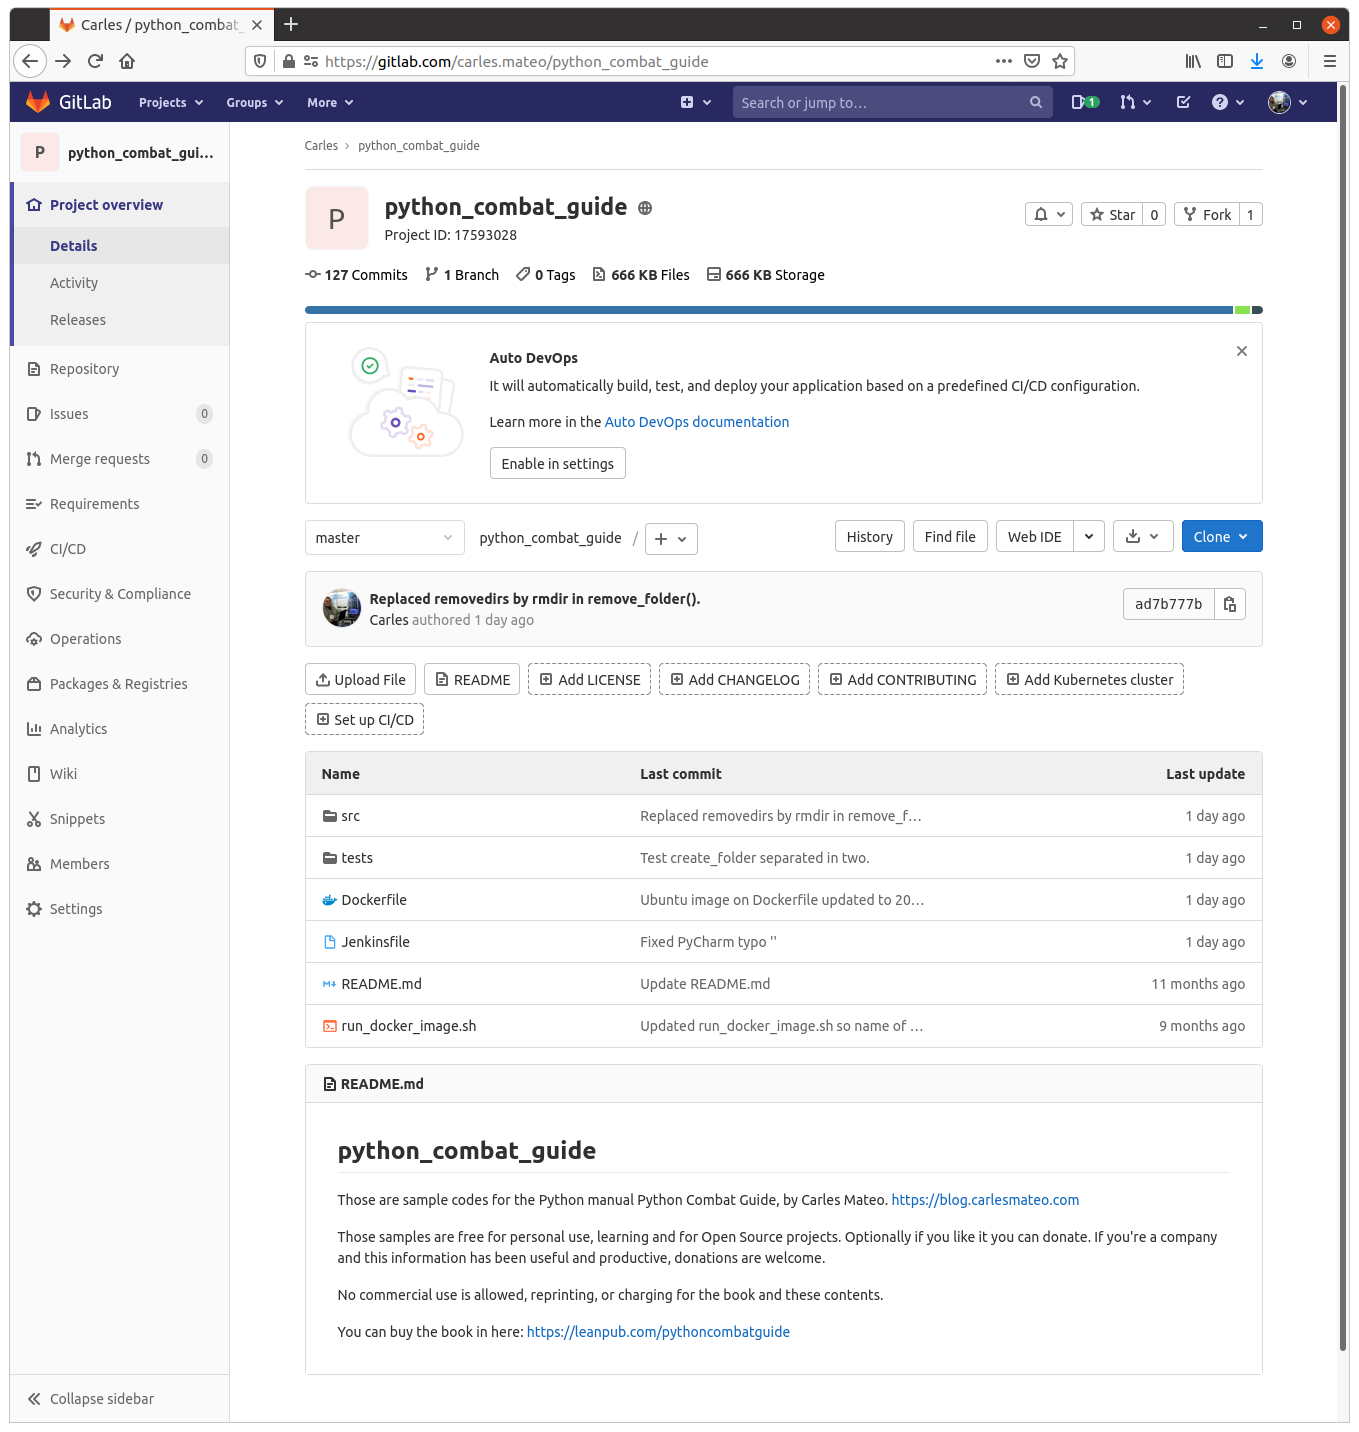
It is very convenient to let Jenkins deal with your repository changes instead of using shell commands. So I’m going to fill this section.
I also provided credentials, so Jenkins can log to my Gitlab.
This kind of project is the most simple and we will use the same Docker Container where Jenkins resides, to run the Unit Testing of our code.
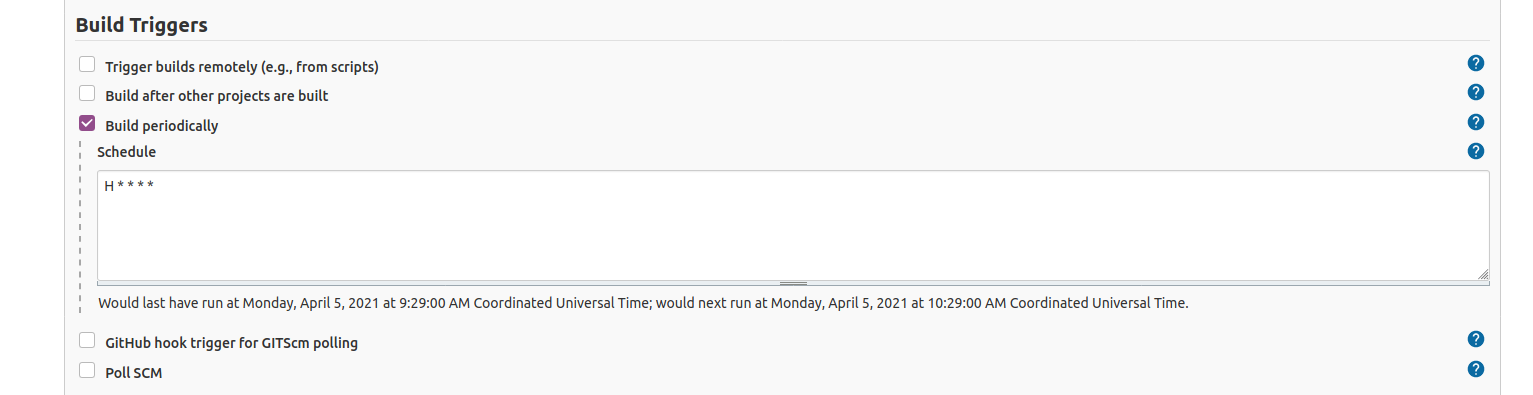
We are going to select to Build periodically.
If your Server is in Internet, you can active the Web Hooks so your Jenkins is noticed via a web connection from GitLab, GitHub or your CVS provider. As I’m strictly running this at home, Jenkins will be periodically check for changes in the repository and do nothing if there are no changes.
I’ll set H * * * * so Jenkins will try every hour.
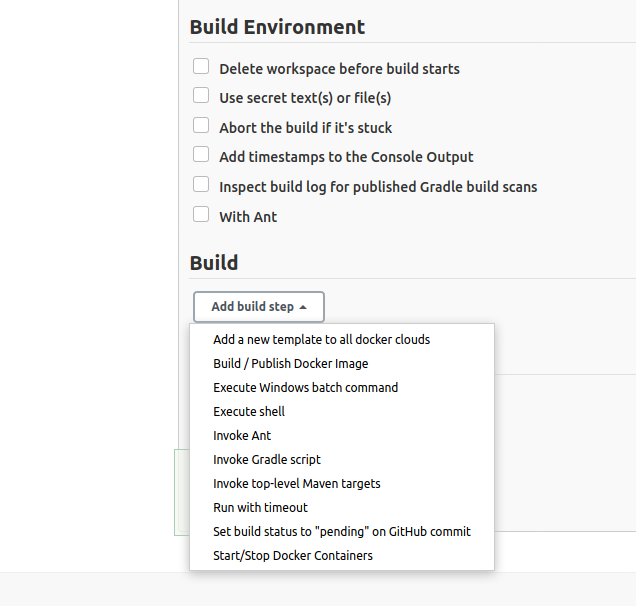
Go down and select Add Build Step:
Select Execute shell.
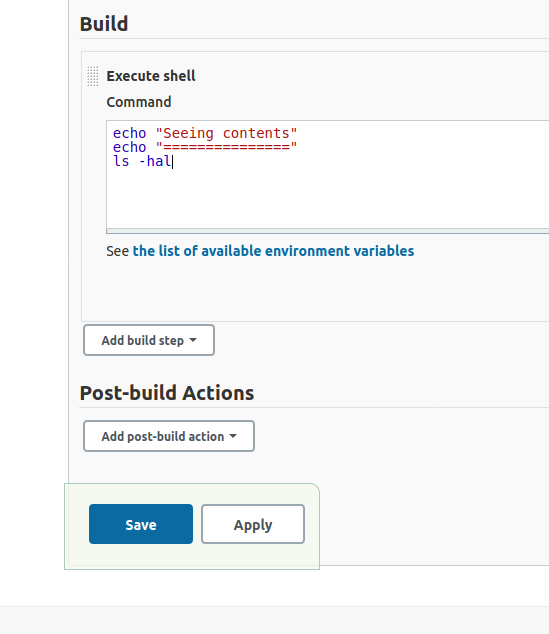
Then add a basic echo command to print in the Console Output, and ls command so you see what is in the default’s directory your shell script is executing in.
Now save your project.
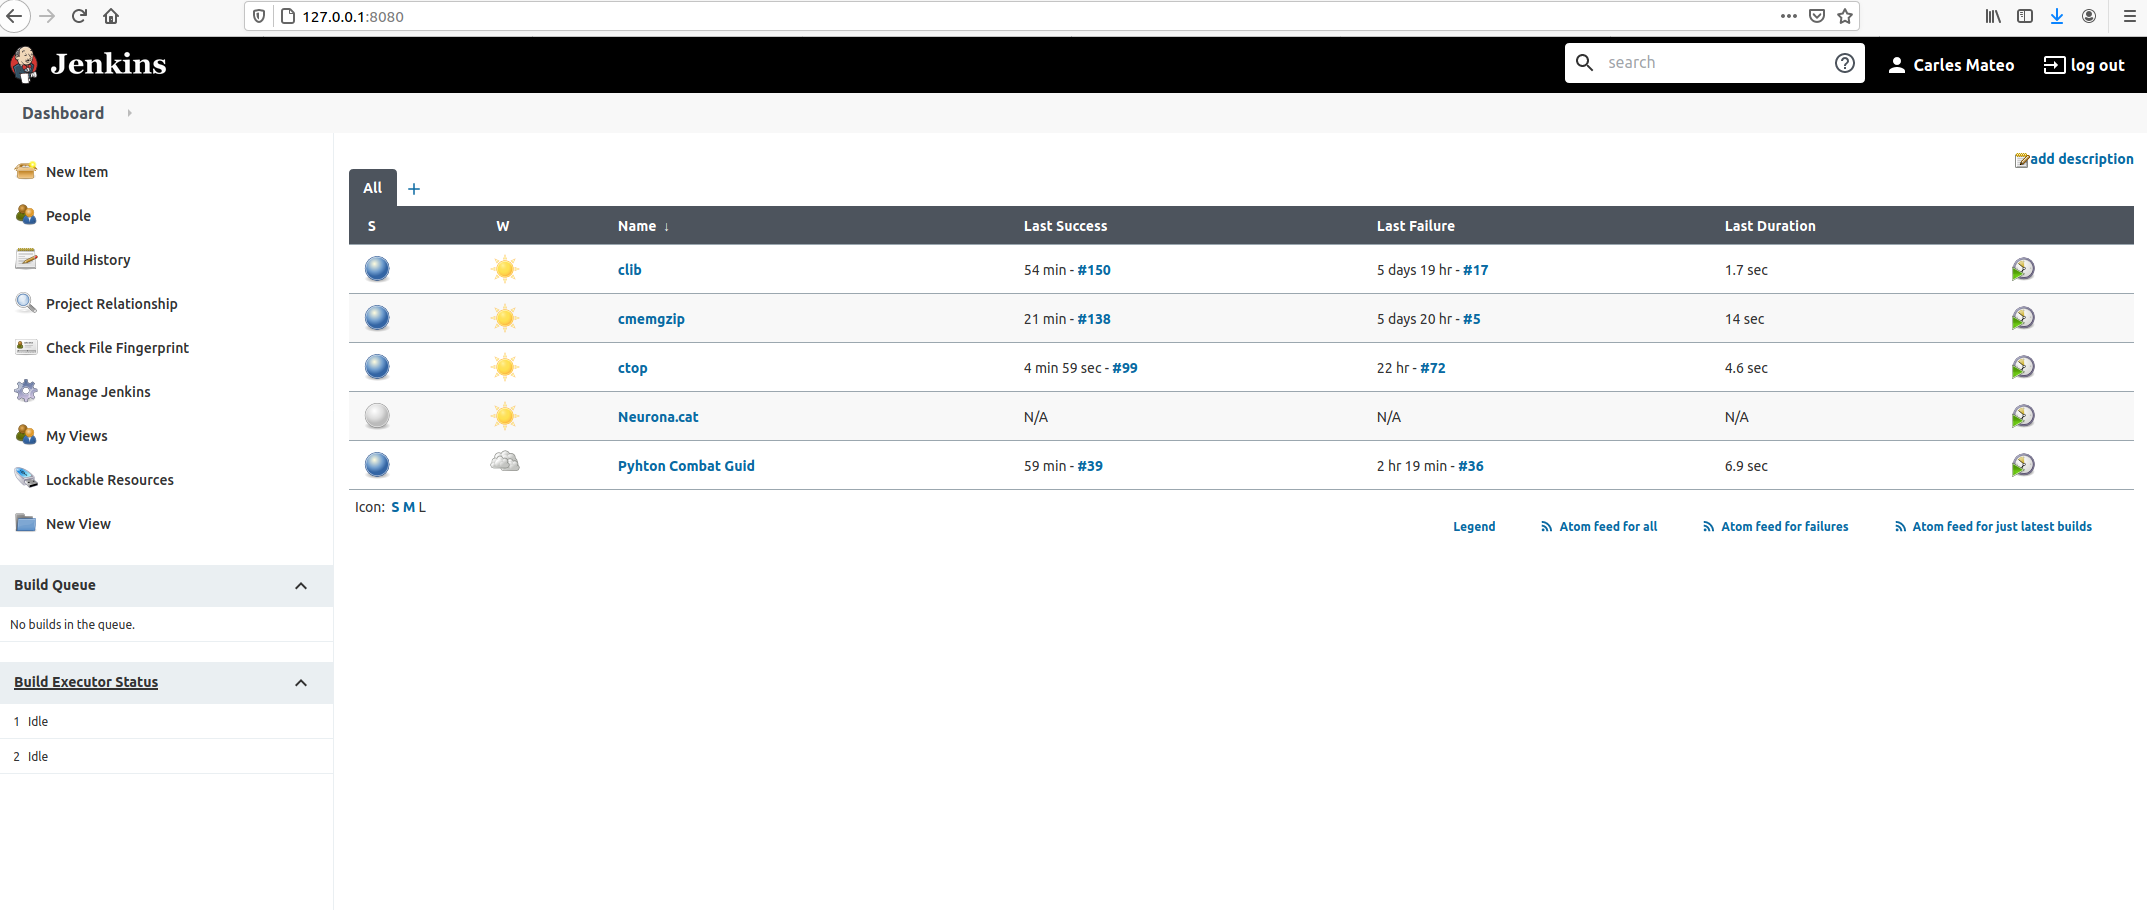
And go back to Dashboard.
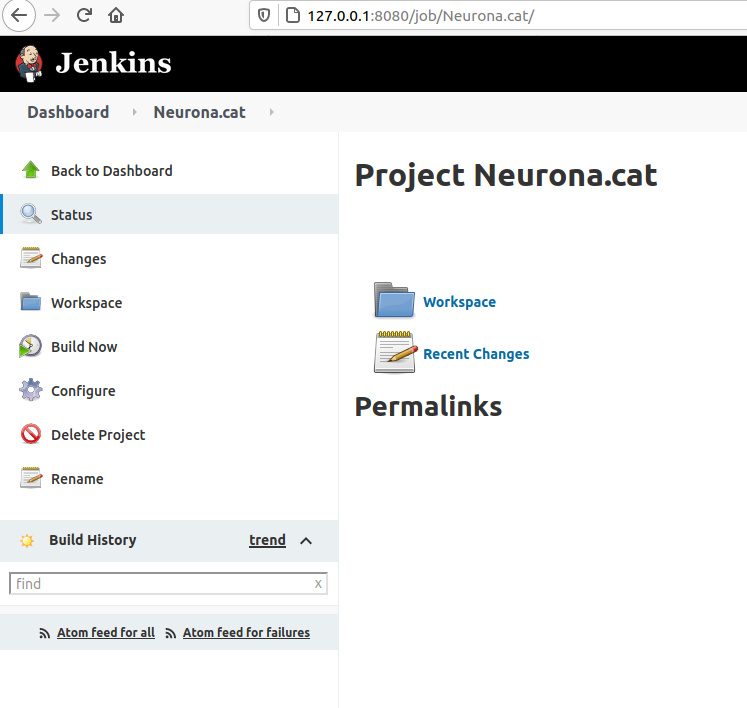
Click inside of Neurona.cat to view Project’s Dashboard.
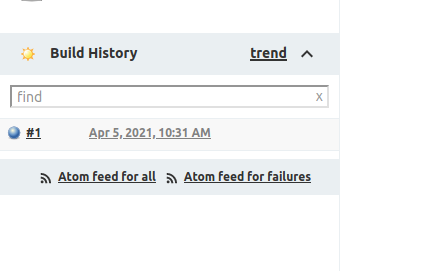
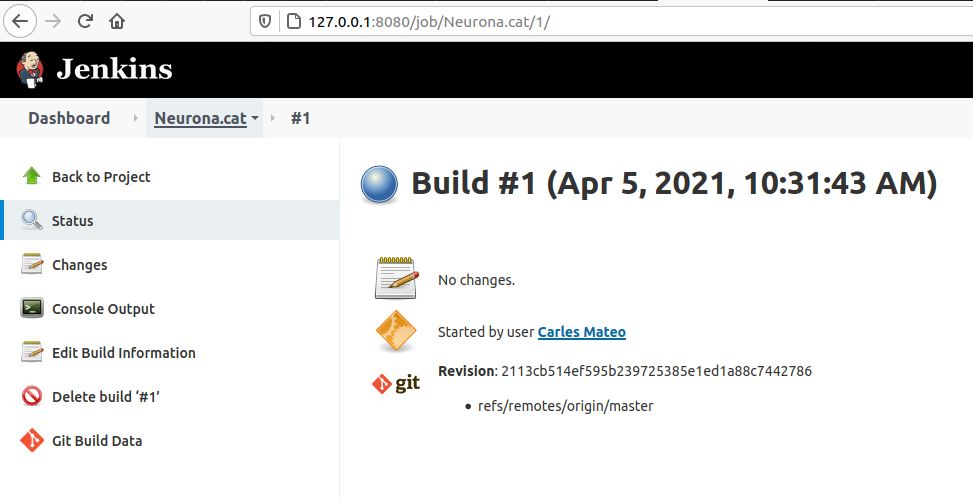
Click: Build Now. And then click on the Build task (Apr 5, 2021, 10:31 AM)
Click on Console Output.
You’ll see a verbose log of everything that happened.
You’ll see for example that Jenkins has put the script on the path of the git project folder that we instructed before to clone/pull.
This example doesn’t have test. Let’s see one with Unit Test.
Running Unit Testing with pytest
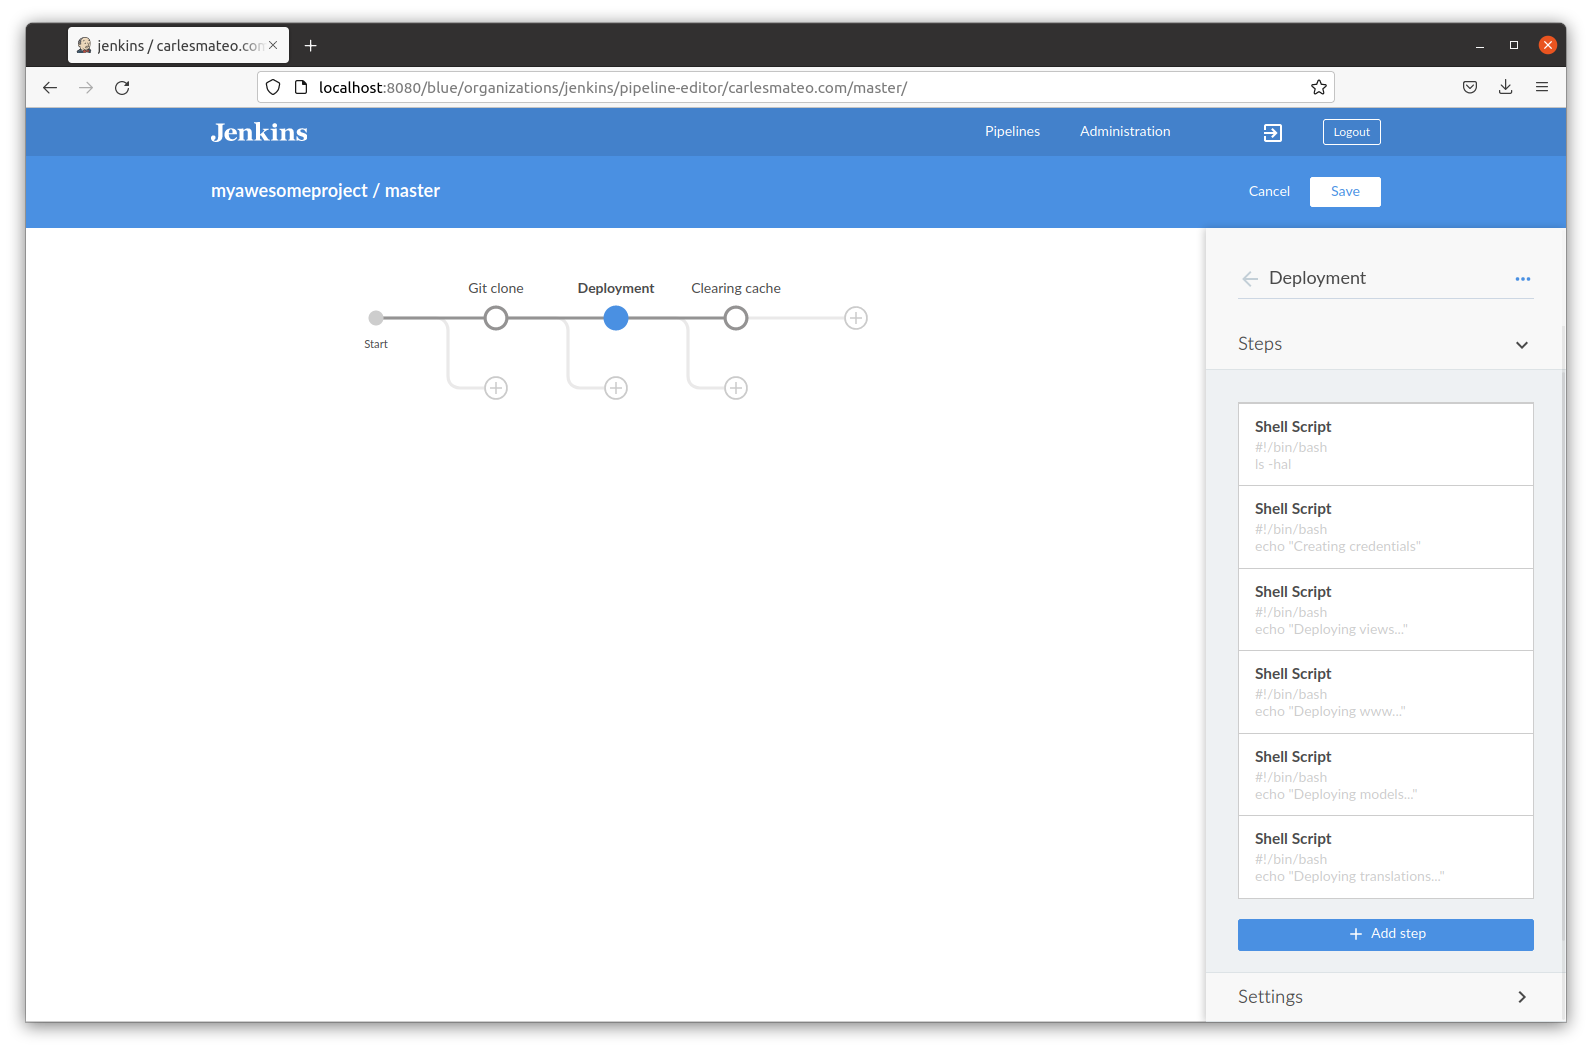
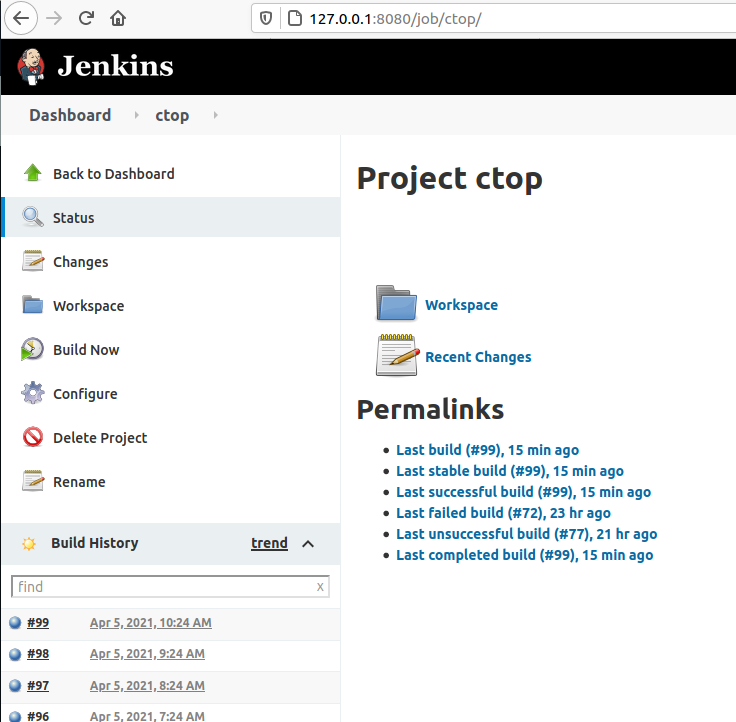
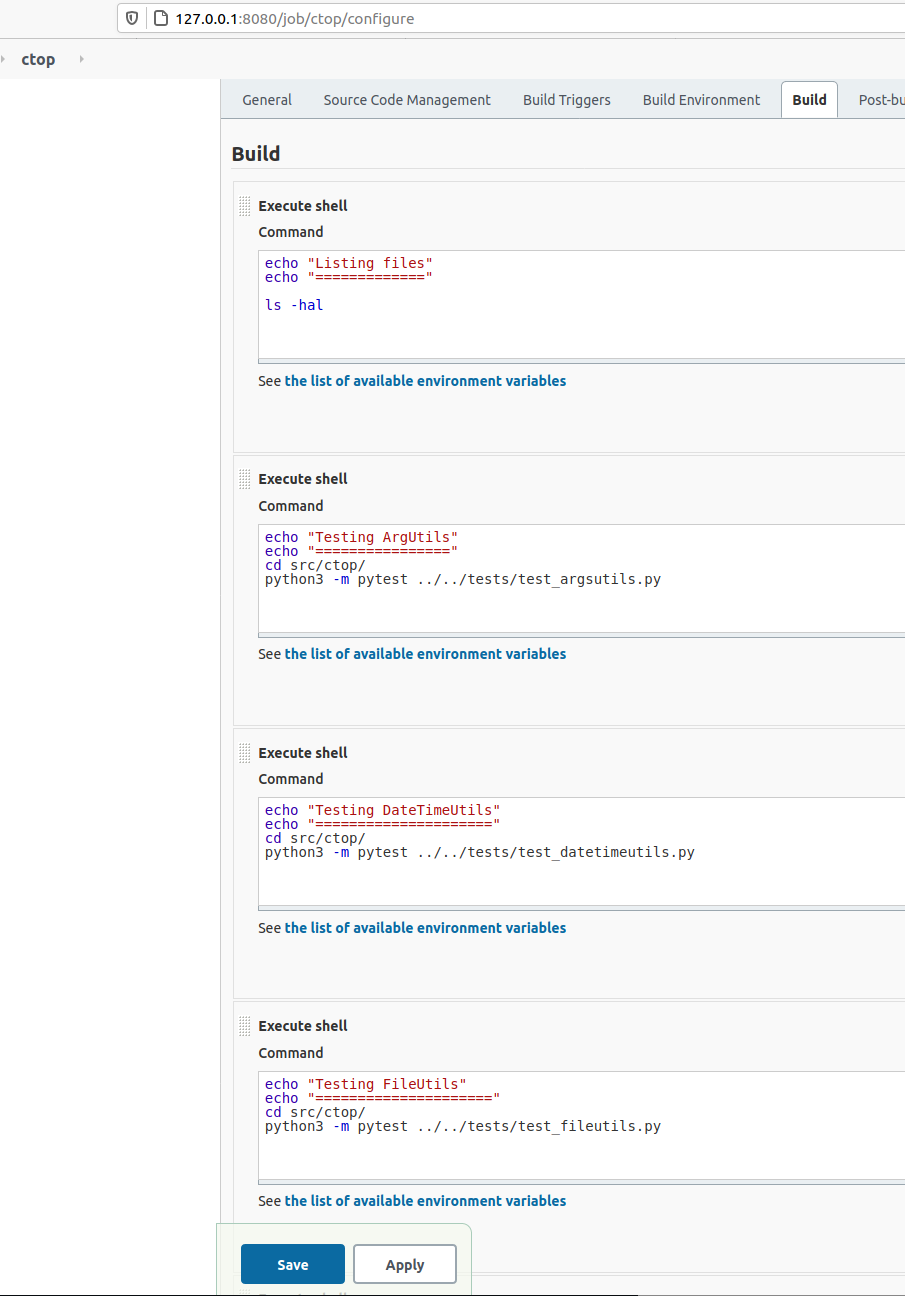
If we enter the project CTOP and then select Configure you’ll see the steps I did for making it do the Unite Testing.
In my case I wanted to have several steps, one per each Unit Test file.
If each one of them I’ve to enter the right directory before launching any test.
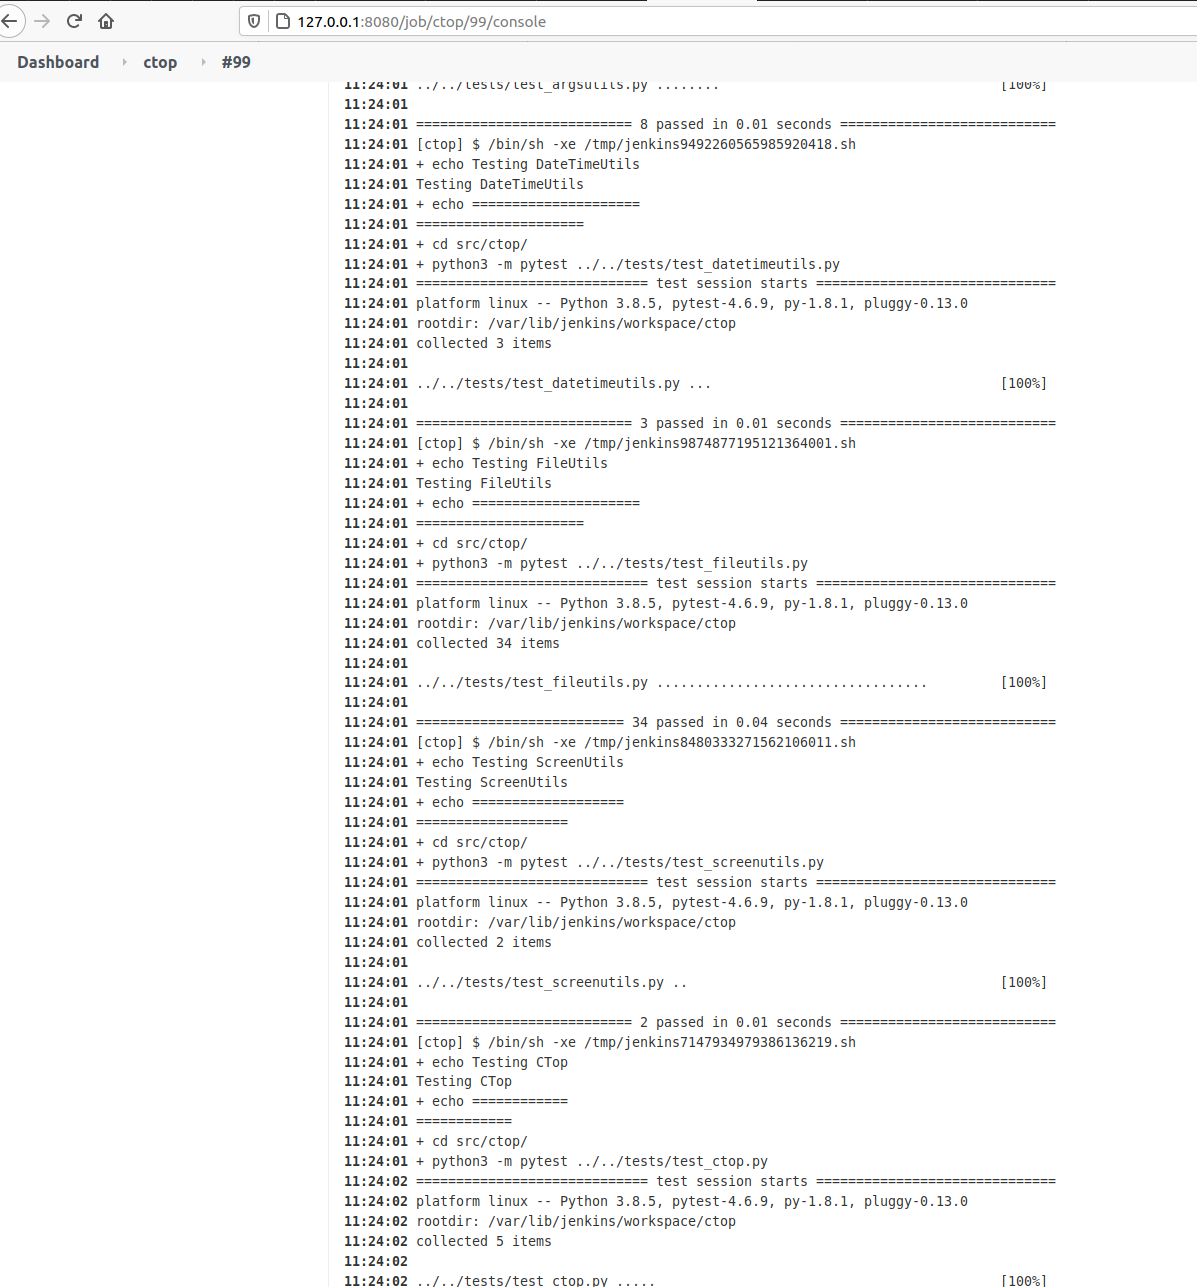
If you open the last successful build and and select Console Output you’ll see all the tests, going well.
If a test will go wrong, pytest will exit with Exit Code different of 0, and so Jenkins will detect it and show that the Build Fails.
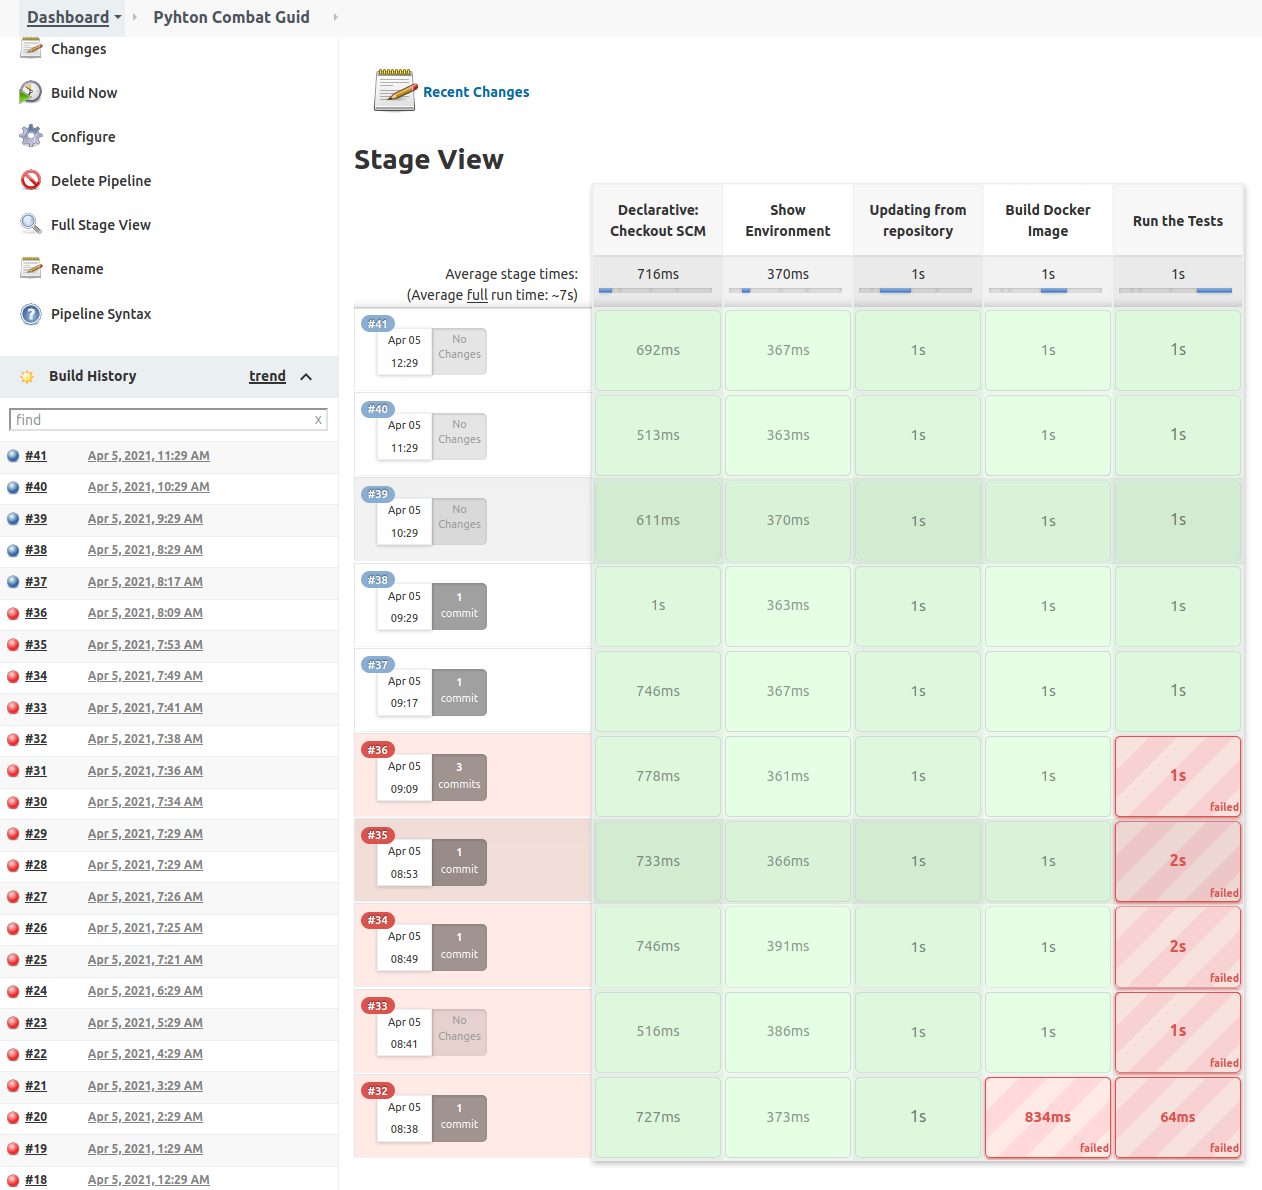
Building a Project from Pipeline
Pipeline is the set of plugins that allow us to do Continuous Deployment.
Inform the information about your git project.
Then in your gitlab or github project create a file named Jenkinsfile.
Jenkins will look for it when it clones your repo, to build the Pipeline.
pipeline {
    agent any
    stages {
        stage('Show Environment') {
            steps {
                echo 'Showing the environment'
                sh 'ls -hal'
            }
        }
        stage('Updating from repository') {
            steps {
                echo 'Grabbing from repository'
                withCredentials([usernamePassword(credentialsId: 'ssh-fast', usernameVariable: 'USERNAME', passwordVariable: 'USERPASS')]) {
                    script {
                        sh "sshpass -p '$USERPASS' -v ssh -o StrictHostKeyChecking=no $USERNAME@$ip_fast 'git clone https://gitlab.com/carles.mateo/python_combat_guide.git; cd python_combat_guide; git pull'"
                    }
                }
            }
        }
        stage('Build Docker Image') {
            steps {
                echo 'Building Docker Container'
                withCredentials([usernamePassword(credentialsId: 'ssh-fast', usernameVariable: 'USERNAME', passwordVariable: 'USERPASS')]) {
                    script {
                        sh "sshpass -p '$USERPASS' -v ssh -o StrictHostKeyChecking=no $USERNAME@$ip_fast 'cd python_combat_guide; docker build -t python_combat_guide .'"
                    }
                }
            }
        }
        stage('Run the Tests') {
            steps {
                echo "Running the tests from the Container"
                withCredentials([usernamePassword(credentialsId: 'ssh-fast', usernameVariable: 'USERNAME', passwordVariable: 'USERPASS')]) {
                    script {
                        sh "sshpass -p '$USERPASS' -v ssh -o StrictHostKeyChecking=no $USERNAME@$ip_fast 'cd python_combat_guide; docker run  python_combat_guide'"
                    }
                }
            }
        }
    }
}
My Jenkins Docker installation has the sshpass command, and I use it to connect via SSH, with username and Password to the server defined by ip_fast environment variable.
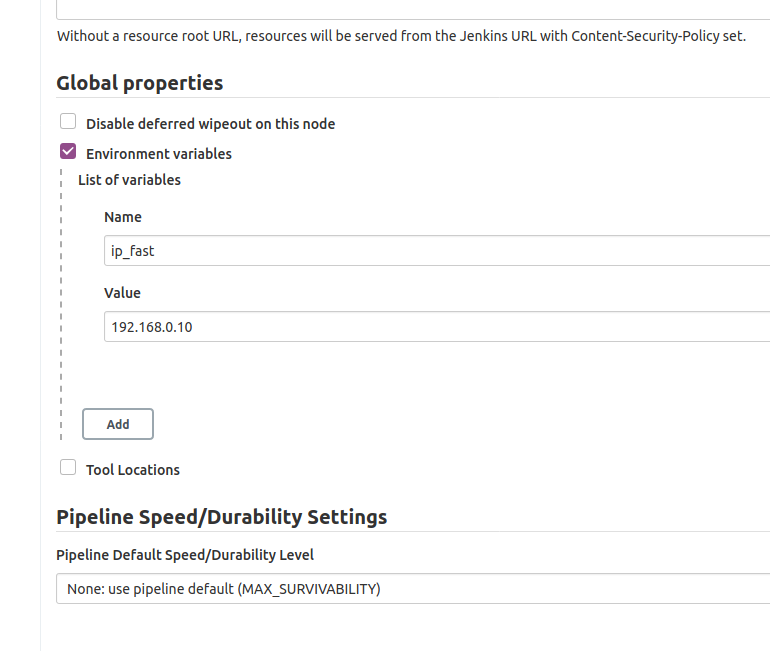
We defined the variable ip_fast in Manage Jenkins > Configure System.
There in Global Properties , Environment Variables I defined ip_fast:
In the Build Server I’ll make a new user and allow it to build Docker:
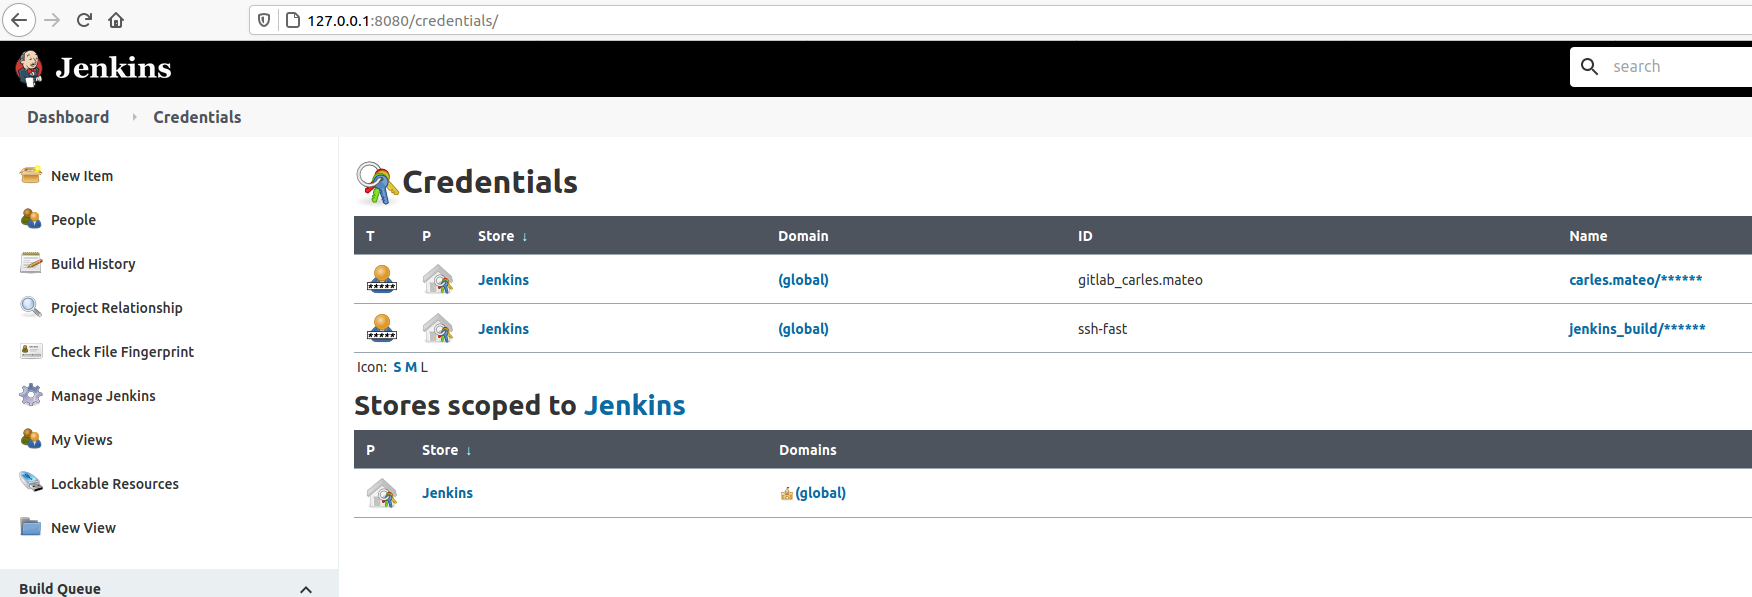
The Credentials can be managed from Manage Jenkins > Manage Credentials.
You can see how I use all this combined in the Jenkinsfile so I don’t have to store credentials in the CVS and Jenkins (Docker Container) will connect via SSH to make the computer after ip_fast Ip, to build and run another Container. That Container will run with a command to do the Unit Testing. If something goes wrong, that is, if any program return an Exit Code different from 0, Jenkins will consider the build fail.
Take in count that $? only stores the Exit Code of the last program. So be careful if you pass multiple commands in one single line, as this may mask an error.
Separating the execution in multiple Stages helps to save time, as after a failure, execution will not continue.