ctop.py is an Open Source tool for Linux System Administration that I’ve written in Python3. It uses only the System (/proc), and not third party libraries, in order to get all the information required. I use only this modules, so it’s ideal to run in all the farm of Servers and Dockers:
os
sys
time
shutil (for getting the Terminal width and height)
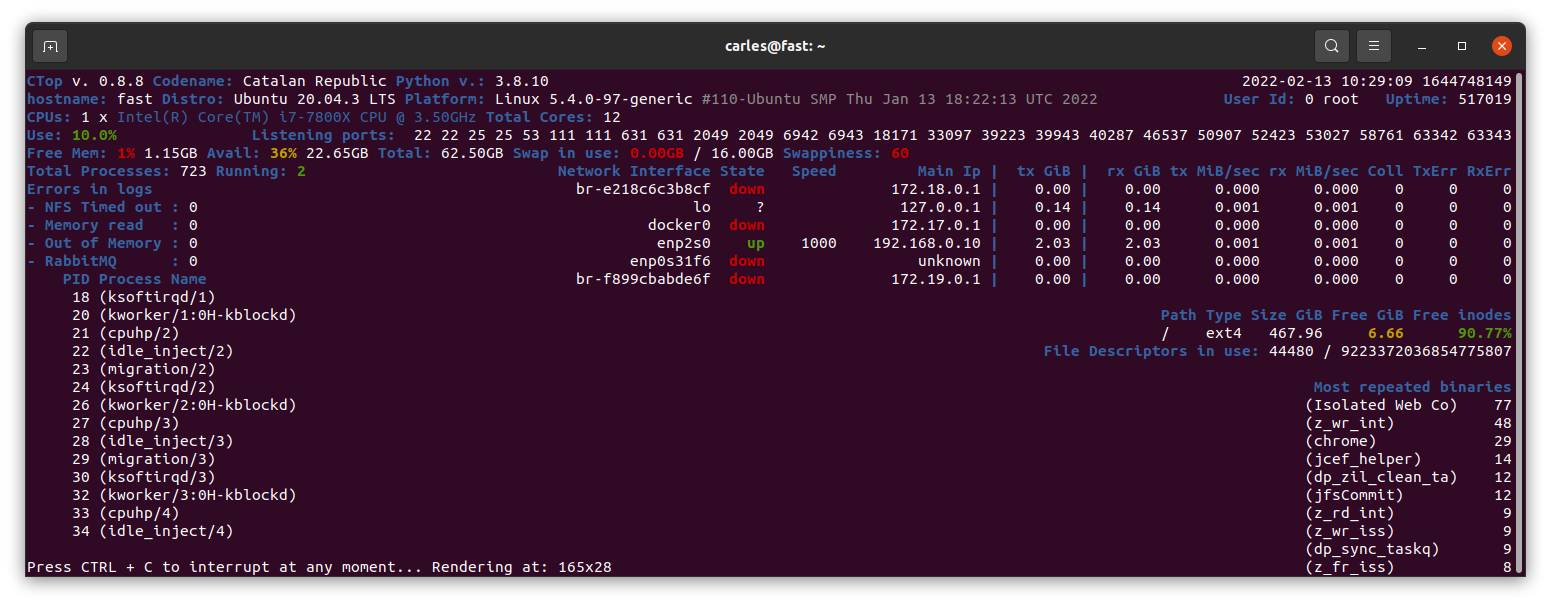
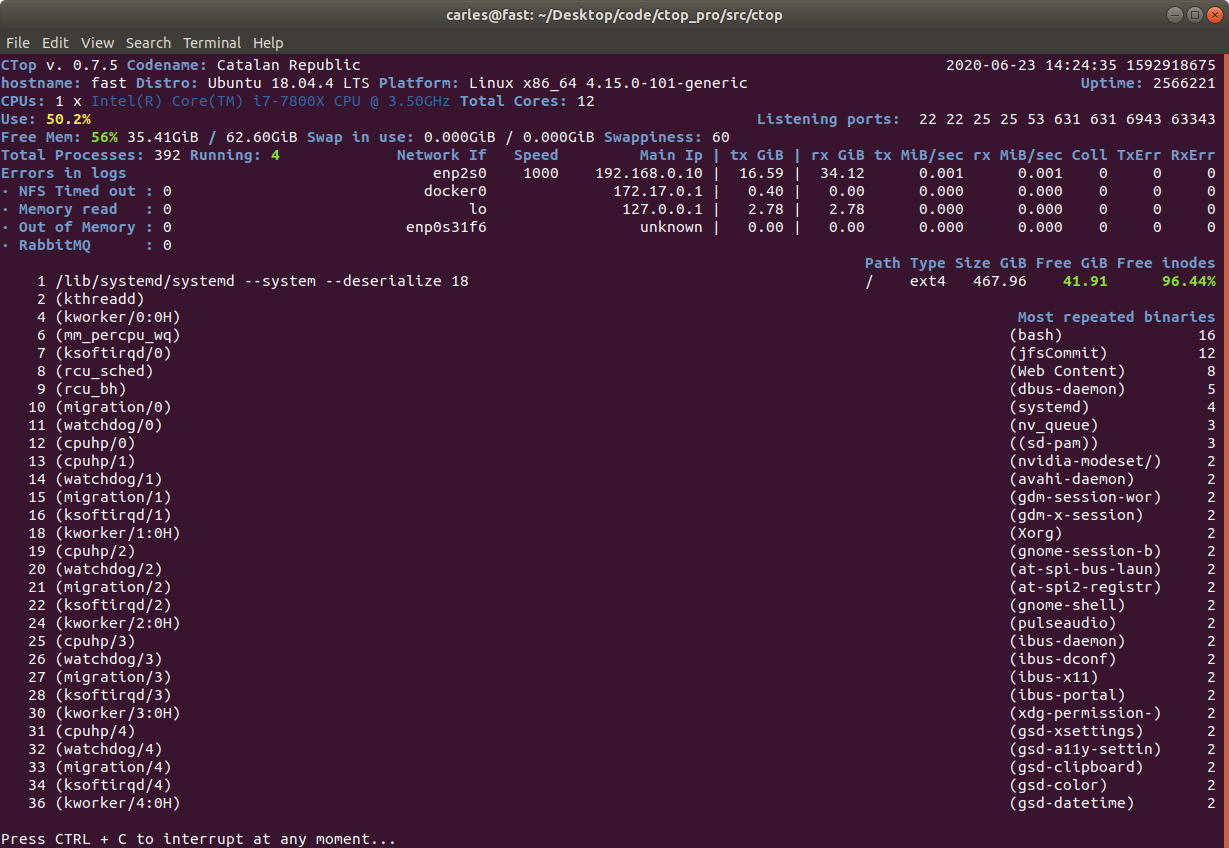
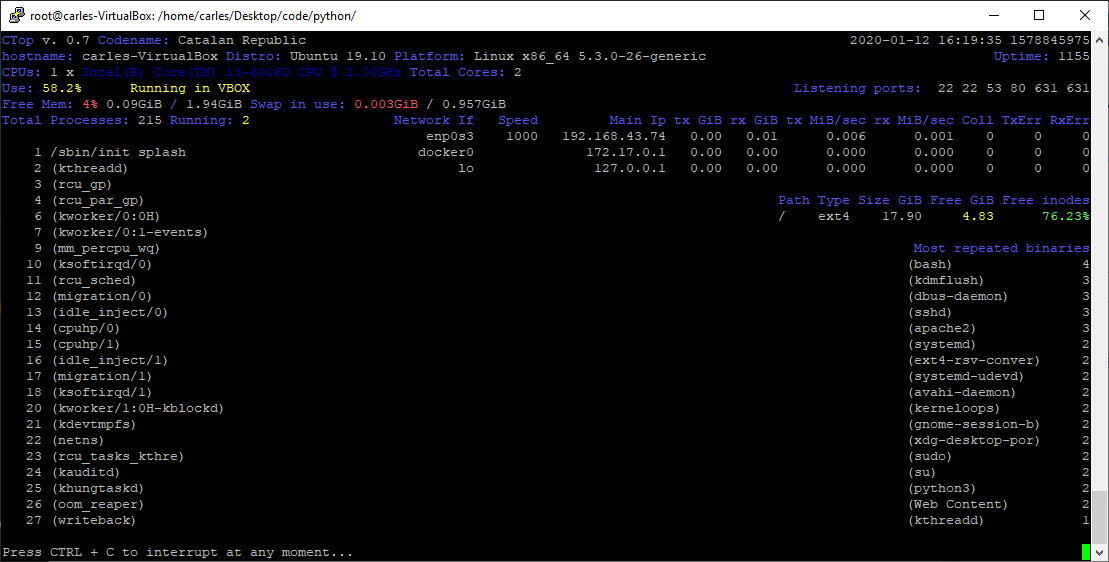
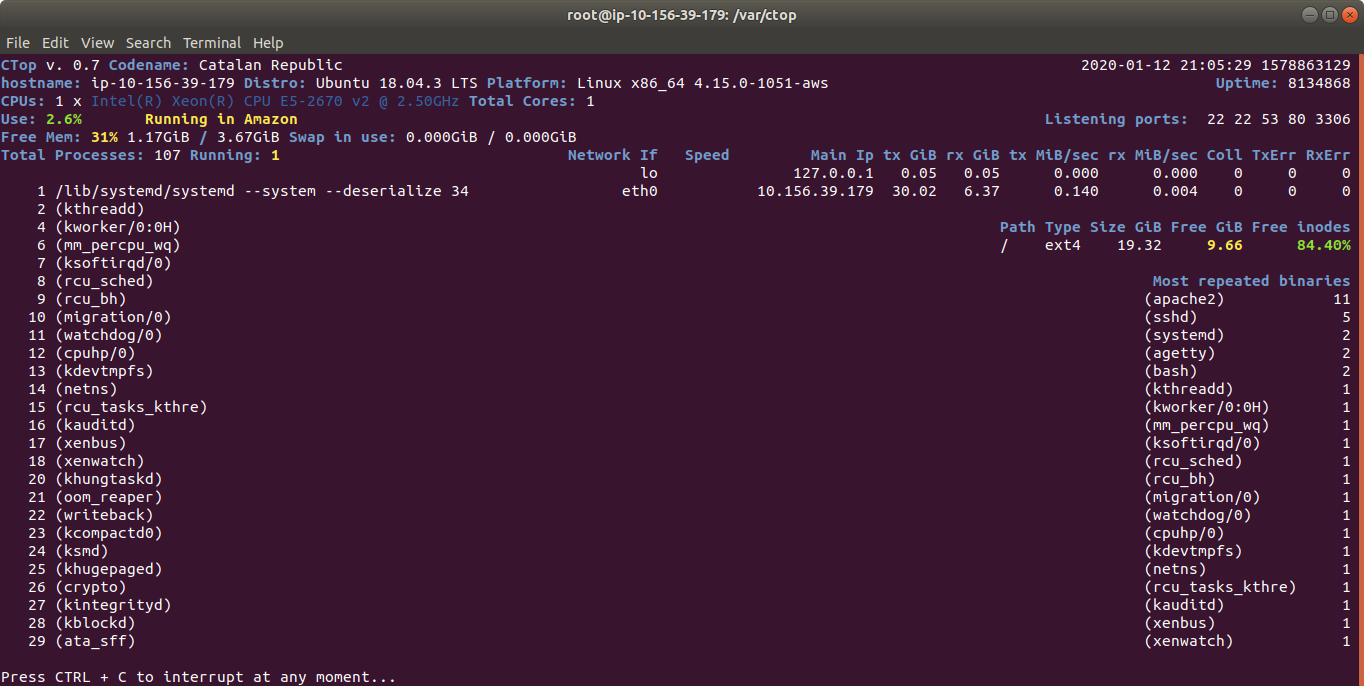
The purpose of this tool is to help to troubleshot and to identify problems with a single view to a single tool that has all the typical indicators.
It provides in a single view information that is typically provided by many programs:
top, htop for the CPU usage, process list, memory usage
meminfo
cpuinfo
hostname
uptime
df to see the free space in / and the free inodes
iftop to see real-time bandwidth usage
ip addr list to see the main Ip for the interfaces
netstat or lsof to see the list of listening TCP Ports
uname -a to see the Kernel version
Other cool things it does is:
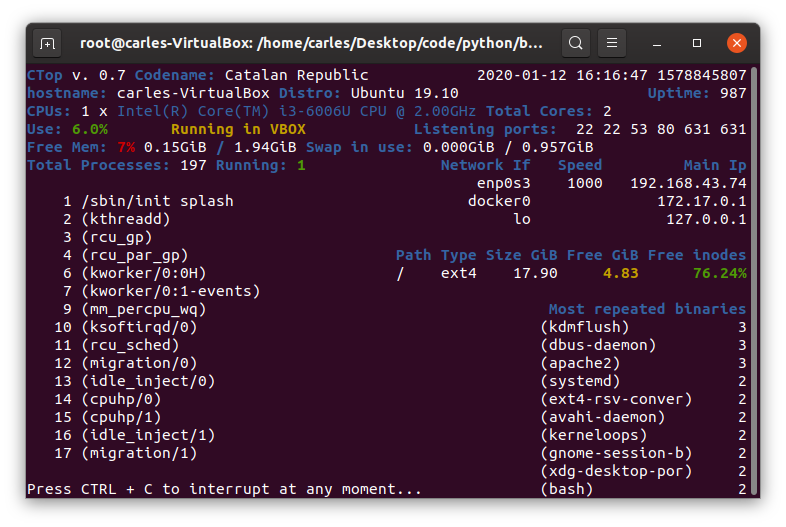
Identifying if you’re inside an Amazon VM, Google GCP, OpenStack VMs, Virtual Box VMs, Docker Containers or lxc.
Compatible with Raspberry Pi (tested on 3 and 4, on Raspbian and Ubuntu 20.04LTS)
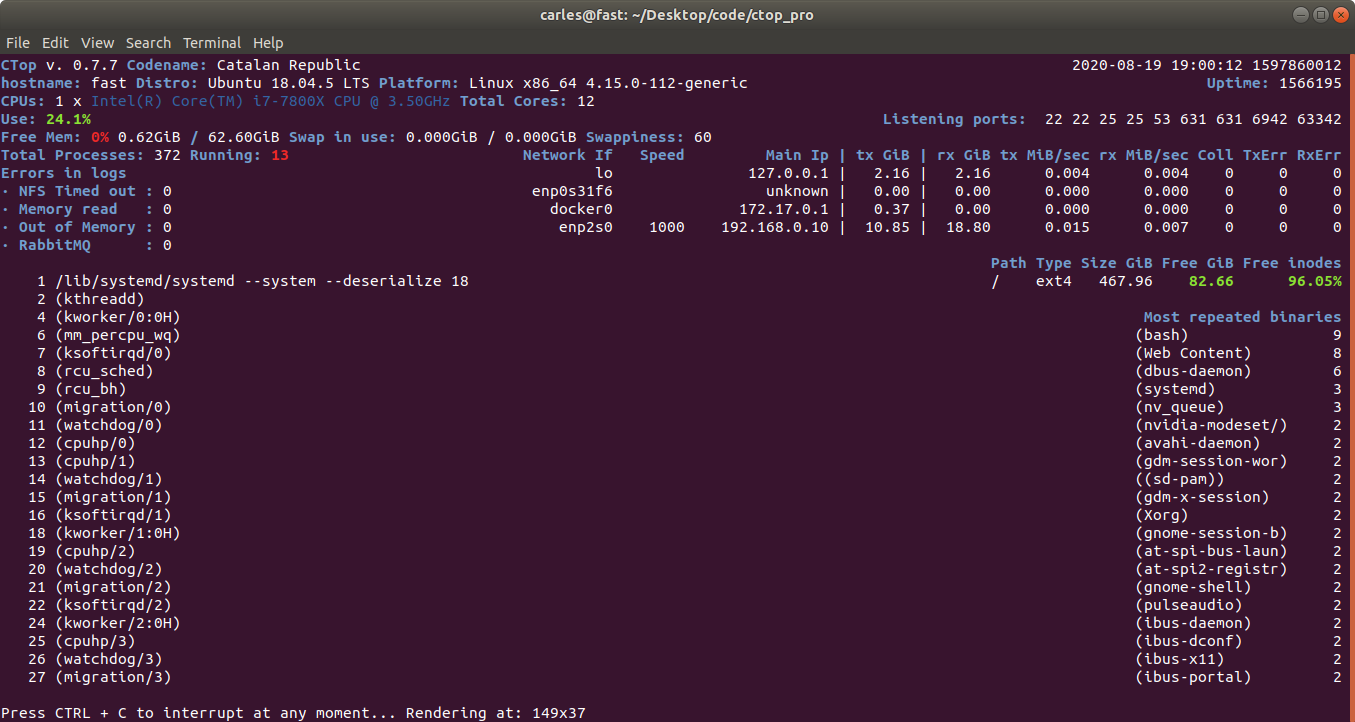
Uses colors, and marks in yellow the warnings and in red the errors, problems like few disk space reaming or high CPU usage according to the available cores and CPUs.
Redraws the screen and adjust to the size of the Terminal, bigger terminal displays more information
It doesn’t use external libraries, and does not escape to shell. It reads everything from /proc /sys or /etc files.
Identifies the Linux distribution
Supports Plugins loaded on demand.
Shows the most repeated binaries, so you can identify DDoS attacks (like having 5,000 apache instances where you have normally 500 or many instances of Python)
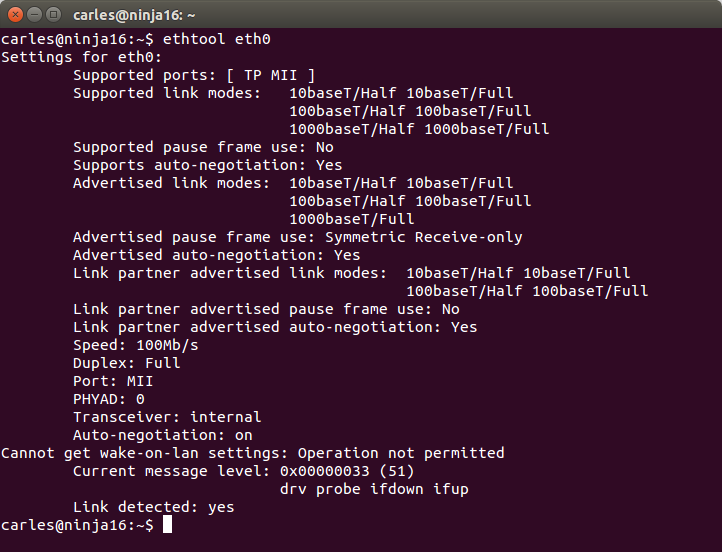
Indicates if an interface has the cable connected or disconnected
Shows the Speed of the Network Connection (useful for Mellanox cards than can operate and 200Gbit/sec, 100, 50, 40, 25, 10…)
It displays the local time and the Linux Epoch Time, which is universal (very useful for logs and to detect when there was an issue, for example if your system restarted, your SSH Session would keep latest Epoch captured)
No root required
Displays recent errors like NFS Timed outs or Memory Read Errors.
You can enforce the output to be in a determined number of columns and rows, for data scrapping.
You can specify the number of loops (1 for scrapping, by default is infinite)
You can specify the time between screen refreshes, for long placed SSH sessions
You can specify to see the output in b/w or in color (default)
Plugins allow you to extend the functionality effortlessly, without having to learn all the code. I provide a Plugin sample for starting lights on a Raspberry Pi, depending on the CPU Load, and playing a message “The system is healthy” or “Warning. The CPU is at 80%”.
Limitations:
It only works for Linux, not for Mac or for Windows. Although the idea is to help with Server’s Linux Administration and Troubleshot, and Mac and Windows do not have /proc
The list of process of the System is read every 30 seconds, to avoid adding much overhead on the System, other info every second
It does not run in Python 2.x, requires Python 3 (tested on 3.5, 3.6, 3.7, 3.8, 3.9)
I decided to code name the version 0.7 as “Catalan Republic” to support the dreams and hopes and democratic requests of the Catalan people, to become and independent republic.
I created this tool as Open Source and if you want to help I need people to test under different versions of:
Atypical Linux distributions
If you are a Cloud Provider and want me to implement the detection of your VMs, so the tool knows that is a instance of the Amazon, Google, Azure, Cloudsigma, Digital Ocean… contact me through my LinkedIn.
Monitoring an Amazon Instance, take a look at the amount of traffic sent and received
Some of the features I’m working on are parsing the logs checking for errors, kernel panics, processed killed due to lack of memory, iscsi disconnects, nfs errors, checking the logs of mysql and Oracle databases to locate errors
Some additional command-line tools that I use to install and use on my text client Systems. Initially here were not listed commands that are shipped with every Linux, but the additional tools I install in every Workstation or Server.
Apache benchmarks (ab)
To stress a Web Server
atop
A good complement to htop, iftop… monitoring tools
bzip2
Cool compressor better than gzip and that also accepts streams.
cfdisk
Nice tool to work with partitions through modern menus.
ctop
Command line / text based Linux Containers monitoring tool.
Very nice System Stats tool. You can specify individual stats, like a drive.
edac-util
Error reporting utility
edac-util --verbose
mc0: 0 Uncorrected Errors with no DIMM info
mc0: 0 Corrected Errors with no DIMM info
mc0: csrow0: 0 Uncorrected Errors
mc0: csrow0: CPU_SrcID#0_MC#0_Chan#0_DIMM#0: 0 Corrected Errors
mc0: csrow0: CPU_SrcID#0_MC#0_Chan#1_DIMM#0: 0 Corrected Errors
mc0: csrow0: CPU_SrcID#0_MC#0_Chan#2_DIMM#0: 0 Corrected Errors
mc1: 0 Uncorrected Errors with no DIMM info
mc1: 0 Corrected Errors with no DIMM info
mc1: csrow0: 0 Uncorrected Errors
mc1: csrow0: CPU_SrcID#0_MC#1_Chan#0_DIMM#0: 0 Corrected Errors
mc1: csrow0: CPU_SrcID#0_MC#1_Chan#1_DIMM#0: 0 Corrected Errors
mc1: csrow0: CPU_SrcID#0_MC#1_Chan#2_DIMM#0: 0 Corrected Errors
mc2: 0 Uncorrected Errors with no DIMM info
mc2: 0 Corrected Errors with no DIMM info
mc2: csrow0: 0 Uncorrected Errors
mc2: csrow0: CPU_SrcID#1_MC#0_Chan#0_DIMM#0: 0 Corrected Errors
mc2: csrow0: CPU_SrcID#1_MC#0_Chan#1_DIMM#0: 0 Corrected Errors
mc2: csrow0: CPU_SrcID#1_MC#0_Chan#2_DIMM#0: 0 Corrected Errors
mc3: 0 Uncorrected Errors with no DIMM info
mc3: 0 Corrected Errors with no DIMM info
mc3: csrow0: 0 Uncorrected Errors
mc3: csrow0: CPU_SrcID#1_MC#1_Chan#0_DIMM#0: 0 Corrected Errors
mc3: csrow0: CPU_SrcID#1_MC#1_Chan#1_DIMM#0: 0 Corrected Errors
mc3: csrow0: CPU_SrcID#1_MC#1_Chan#2_DIMM#0: 0 Corrected Errors
ethtool
fatrace Reports file access events from all running processes in real time.
flock With flock several processes can have a shared lock at the same time, or be waiting to acquire a write lock. With lslocks from util-linux package you can get a list of these processes.
fstrim
discard unused blocks on a mounted filesystem (local or remote). Is useful for freeing blocks no longer used in ZFS zvols. That can also be achieved by mount -o discard
fuser Show which processes use the named files, sockets, or filesystems.
To set the metrics of all IPV4 routes attached to a given network interface
ifstat
Pretty network interfaces stats.
iftop
To watch metrics for a network interface (or wireless)
iostat
CPU and IO devices stats. I modified some collectors for telegraf and influxdb consumed by grafana for fetching the Write KB/s, Read KB/s, Bandwidth of the Magnetic Spinning drives and SSD during declustered rebuild.
iotop
iperf
Perform network throughput tests
ipmitool
iptables
iscsiadm
java (jre Oracle and OpenJDK)
journalctl
ldap-utils
ldapsearch and the other tools to work with LDAP.
less According to manpages, the opposite of more. :) What it does is display a file, and you can scroll up/down, you can search for patterns… Examples: cat /etc/passwd | less less /etc/passwd # -n doesn’t count the lines, to save time # For a specific Offset less -n +500000000P /var/log/apache2/giant.log # For 50% point less -n +50p /var/log/apache2/giant.log
lrzip /lrztar
Compressor that compresses very efficiently big files, specially GB of of source code.
lrzsz (Zmodem)
An utility to send files to the Server through a terminal.
Very useful when you don’t want to scp or rsftp, for example because that requires MFA (Multi Factor Authentication) to be performed again and you already have a session open.
Moba xTerm for Windows is one of the Terminal clients that accepts Upload/Download of Z-modem
apt install lrzsz
lsblk
List the block devices. Also is handy blkid but you can get this from /dev/disk/by-id/
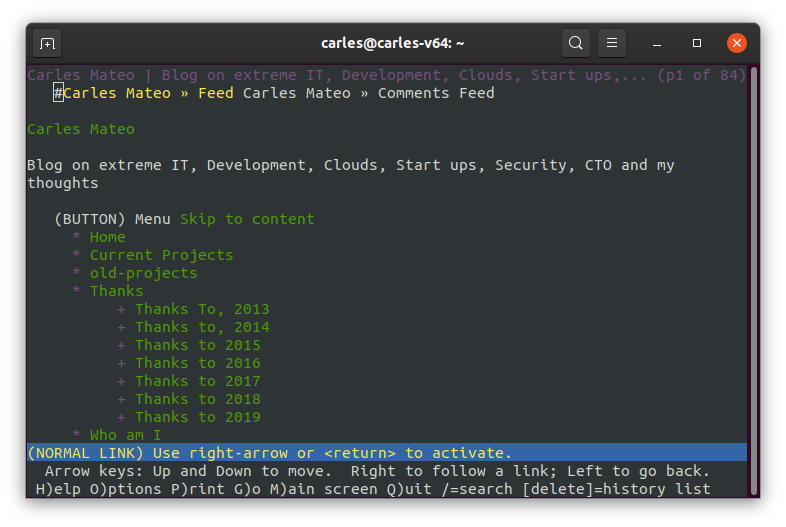
lynx
Text browser. really handy.
ltrace To trace library calls.
mc
Midnight Commander
md5sum
memtester
Basically for testing Memory.
This will allocate 4GB of RAM and run the test 10 times.
sudo memtester 4096 10
mtr
Network tool mix between ping and traceroute.
mytop
To see in real time queries and slow queries to mysql
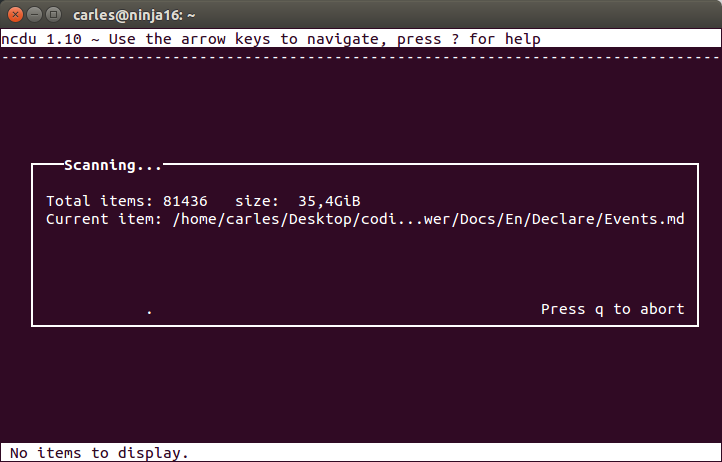
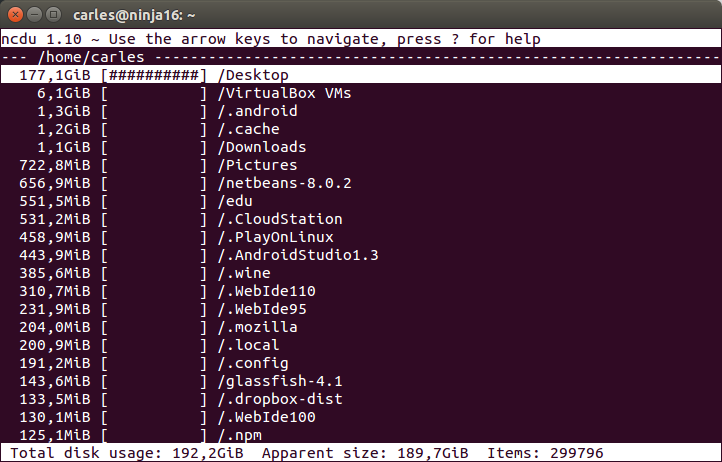
ncdu
Show the space used by any directory and subdirectory
nginx (fpm-php) and apache
The webservers
nfs client
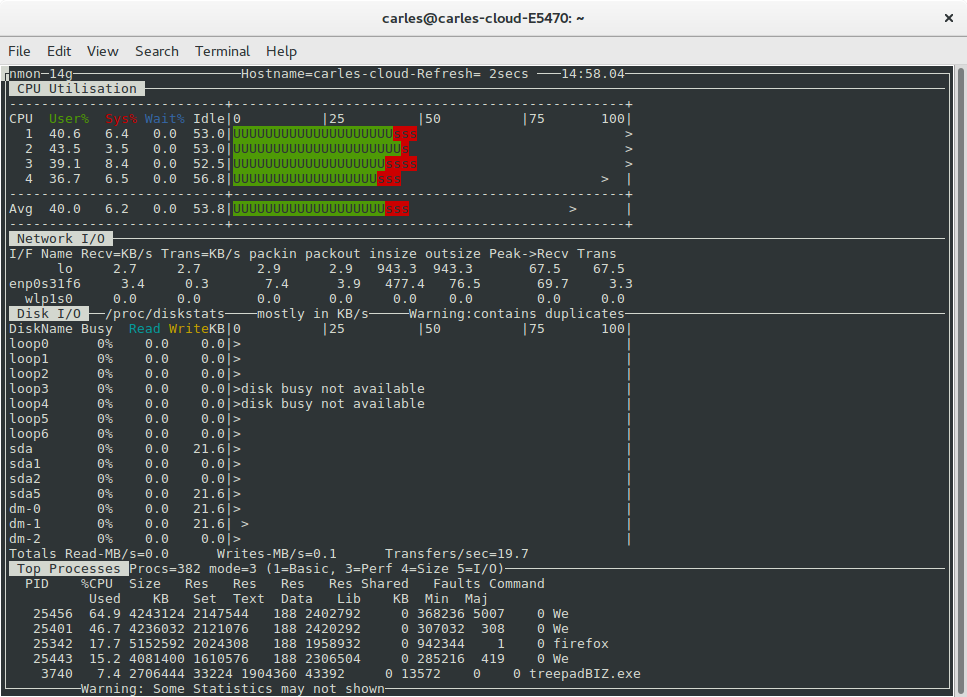
nmon
Offers monitoring of different aspects: Network, Disk, Processes…
open-vpn
openssh-server
parted
Partition manipulation
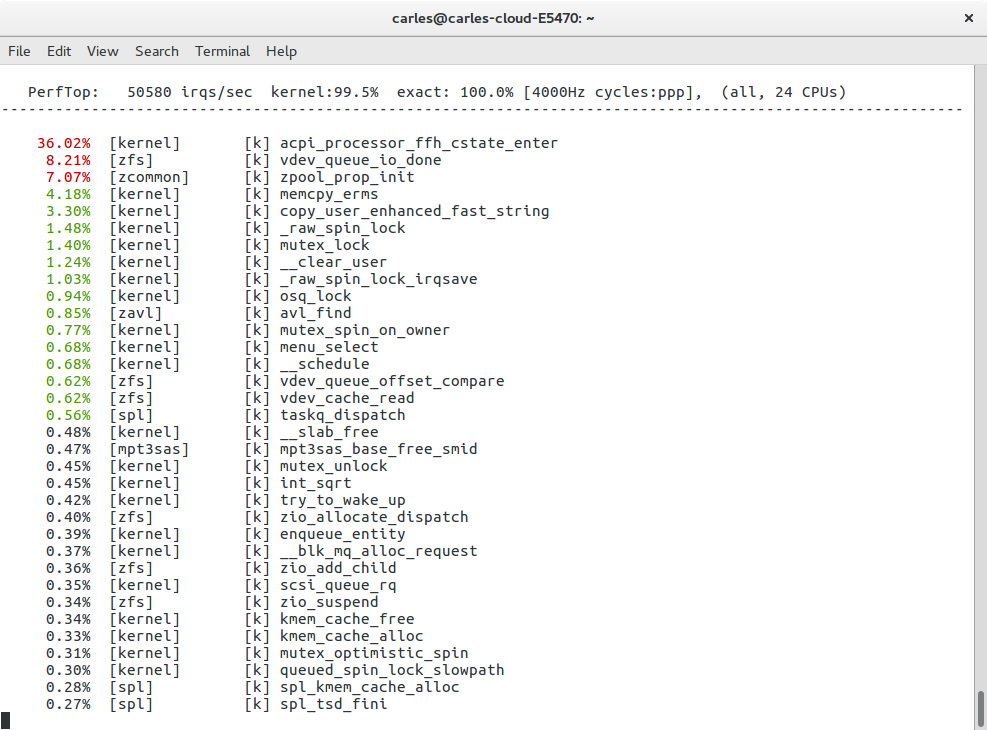
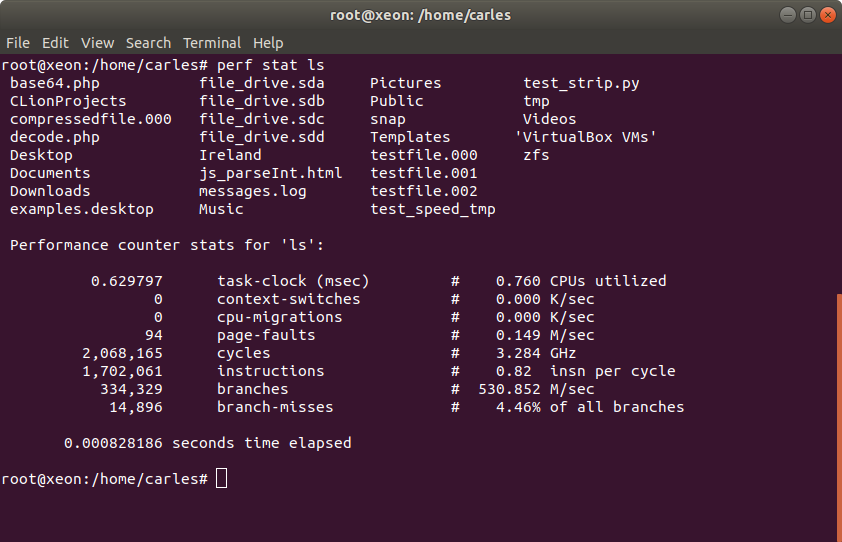
perf
Performance profiler.
Ie: perf top perf stat ls
PHP + curl + mysql (hhvm)
pixz
A parallel, multiprocessor, variant of gzip/bzip2 that can leverage several processors to speed up the compression over files.
If the input looks like a tar archive, it also creates an index of all the files in the archive. This allows the extraction of only a small segment of the tarball, without needing to decompress the entire archive.
postcat
postcat -q ID shows the details of a message in the queue
python-pip and pypy
pv Pipe Viewer – is a terminal-based tool for monitoring the progress of data through a pipeline. It can be inserted into any normal pipeline between two processes to give a visual indication of how quickly data is passing through, how long it has taken, how near to completion it is, and an estimate of how long it will be until completion.
dd if=/dev/urandom | pv | dd of=/dev/null
Output:
1,74MB 0:00:09 [ 198kB/s] [ <=> ]
Probably you’ll prefer to use dd with status=progress option, it’s just a sample.
Utility to work with partitions that can export and import configs through STDIN and STDOUT to automate partitions operations.
slabtop Displays Kernel slab cache information in real time.
smartctl
Utility for dealing with the S.M.A.R.T. features of the disks, knowing errors…
split Split a file into several, based by text lines, or binary: number of bytes per file.
sha512sum
sshfs
Mount a mountpoint on a remote Server by using SSH.
sshpass SSH without typing the password. -f for reading it from a file. sshpass -p “mypassword” ssh -o StrictHostKeyChecking=no root@10.251.35.251
In this sample passing the command ls, so this will be executed, and logout. sshpass -p “mypassword” ssh -o StrictHostKeyChecking=no root@10.251.35.251 ls
sshuttle
A poor’s man VPN through SSH that is available for Linux and Mac OS X.
Tree simply shows the directory hierarchy in a graphical (text mode) way. Useful to see where files and subfolders are.
xxd Make a hexdump or do the reverse
sudo xxd /dev/nvme0n1p1 | less
zcat Just like cat, but for compressed filed.
zcat logs.tar.gz | grep "Error"
zcat logs.tar.gz | less
zless
zram-config
Sergey Davidoff stumbled upon a project called compcache that creates a RAM based block device which acts as a swap disk, but is compressed and stored in memory instead of swap disk (which is slow), allowing very fast I/O and increasing the amount of memory available before the system starts swapping to disk. compcache was later re-written under the name zRam and is now integrated into the Linux kernel.
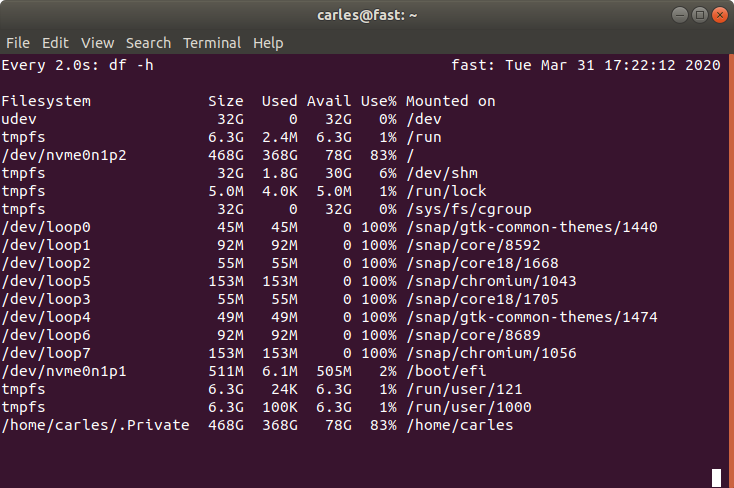
Whatch allow you to execuate a command and what it (refresh it) at a given intervals, for example every two seconds. For example, if normally I would do:
while [ true ]; do zpool status | head -n10 ; sleep 10; done
while [ true ]; do df -h; sleep 60; done
while [ true ]; do ls -al /tmp | head -n5 ; sleep 2; done
Then I can do:
watch -n10 zpool status
Or:
watch -n60 df -h
Or
watch "ls -al /tmp | head -n5"
For my Dockers, and cloudinit with Ubuntu, my defaults are:
apt update; apt install htop mc ncdu strace git binutils