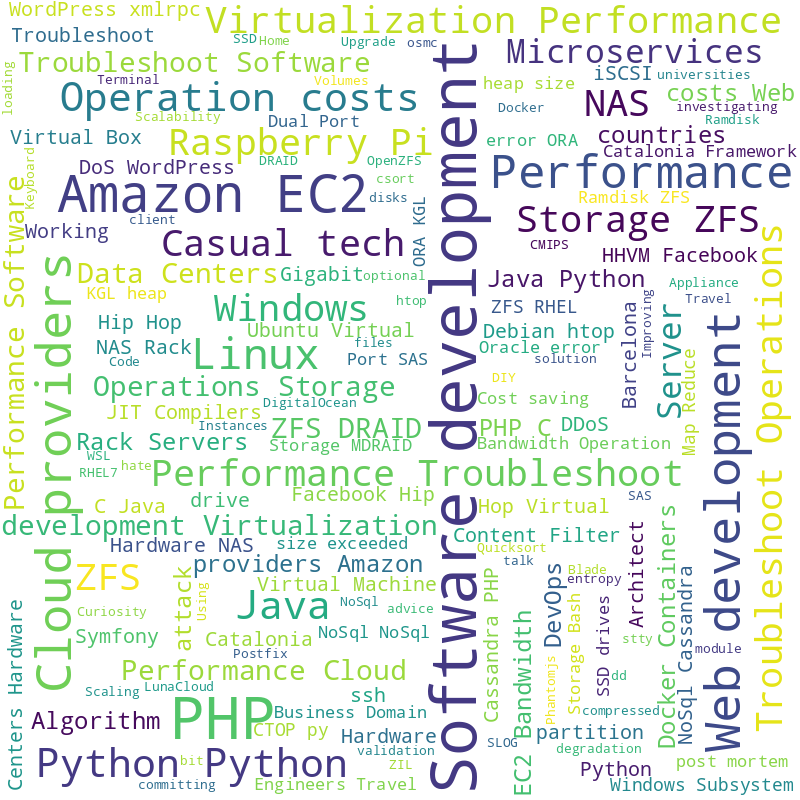
This is a very simple code but generates very cool Word Cloud result in PNG format.
from wordcloud import WordCloud

# Add your tags in here separated by commas and as many times as they appear
s_text = "Python, Software development, PHP, Cloud providers, Python, Python, Software development, Scaling"

o_word_cloud = WordCloud(height=800,
                         width=800,
                         background_color="white",
                         max_words=150,
                         min_font_size=5,
                         collocation_threshold=10).generate_from_text(s_text)

o_word_cloud.to_file("words.png")
That version generated the image .PNG file.
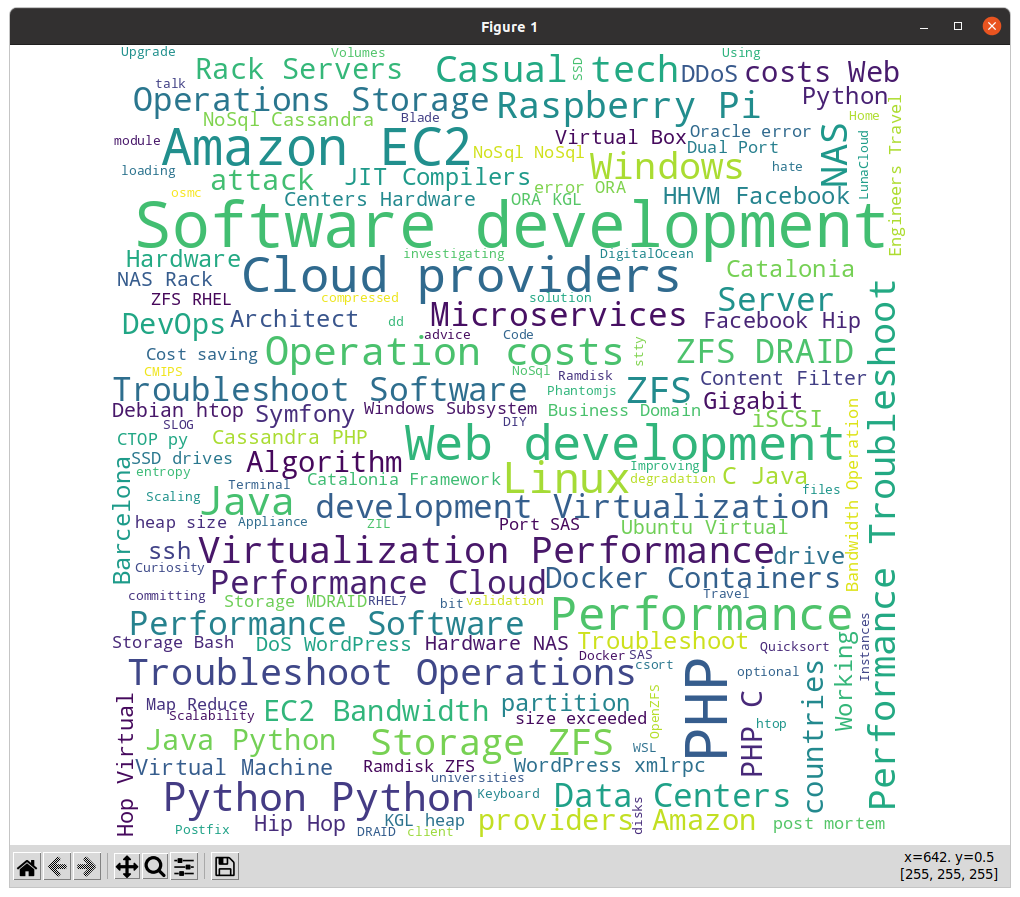
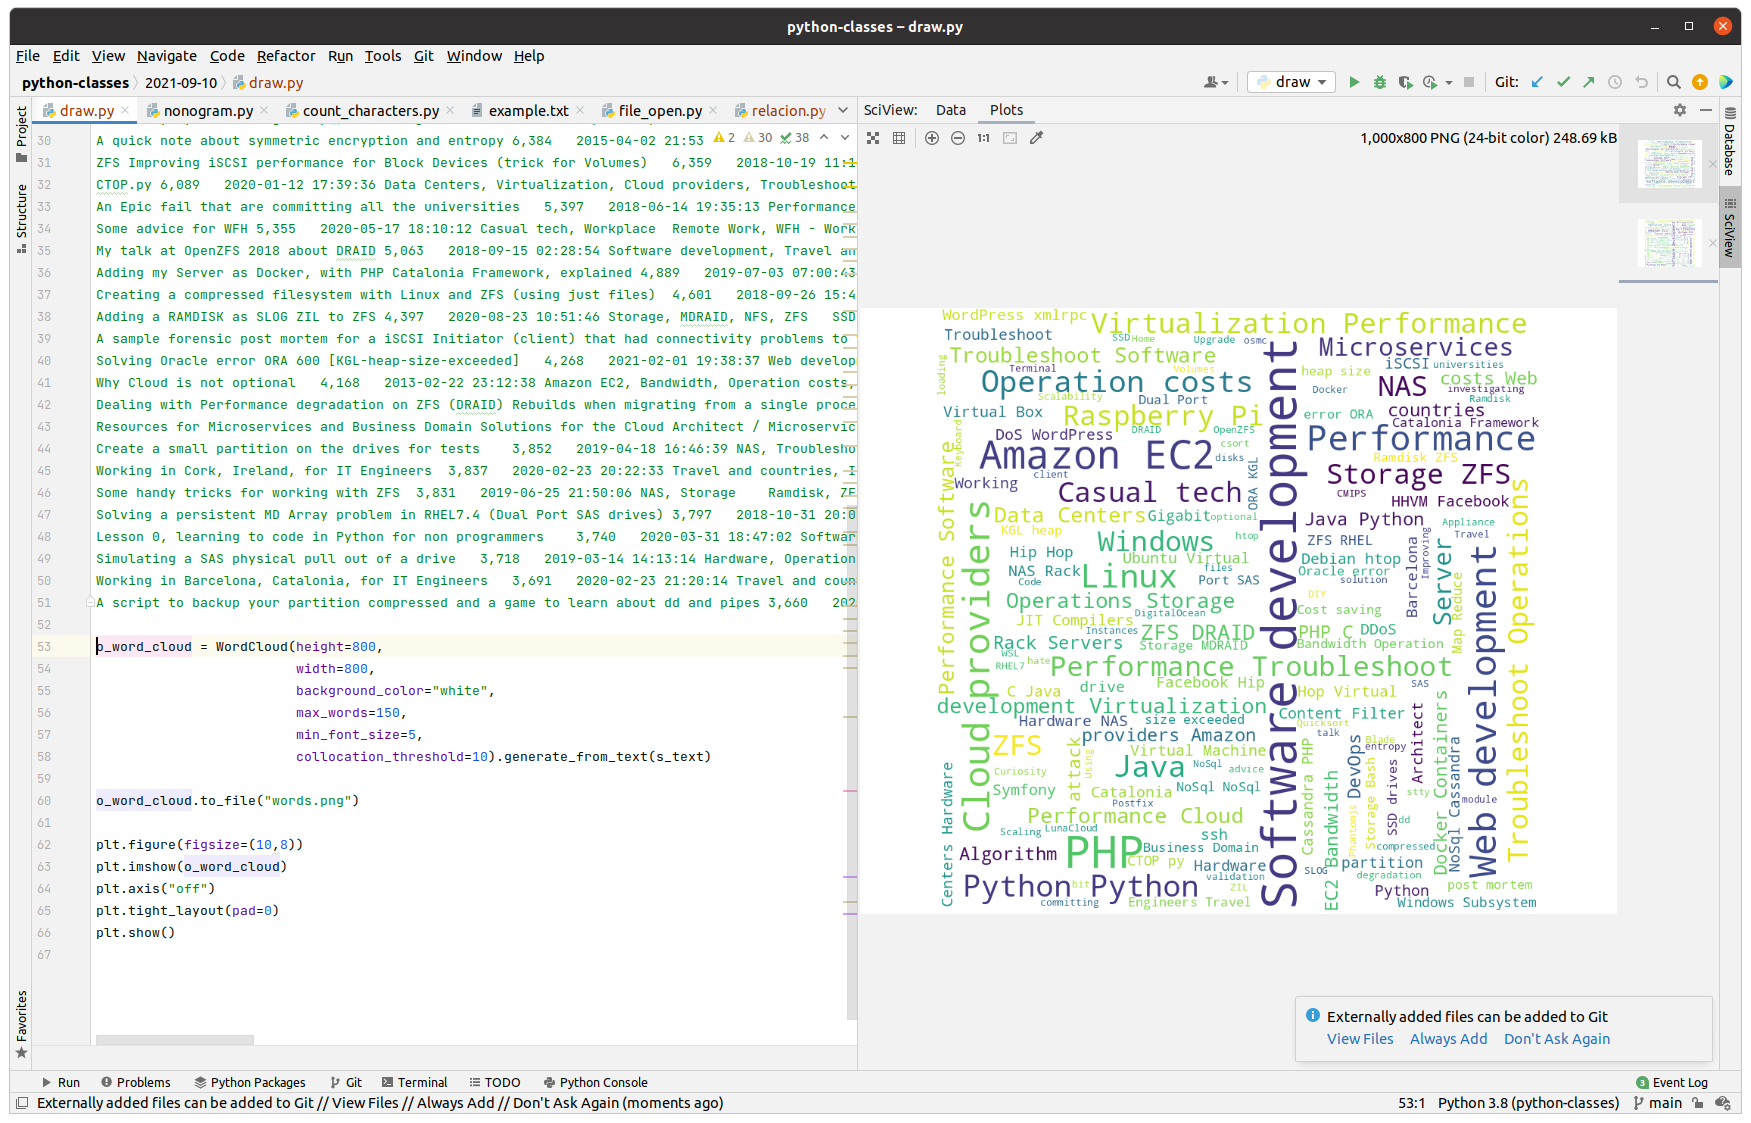
If you want to display this in mathlib or inside PyCharm embedded view, you can install matplotlib with:
pip3 install matplotlib
Then with this code you can display a matplotlib viewer:
import matplotlib.pyplot as plt
from wordcloud import WordCloud

if __name__ == "__main__":
    # Add your tags in here separated by commas and as many times as they appear
    s_text = "Python, Software development, PHP, Cloud providers, Python, Python, Software development, Scaling"

    o_word_cloud = WordCloud(height=800,
                             width=800,
                             background_color="white",
                             max_words=150,
                             min_font_size=5,
                             collocation_threshold=10).generate_from_text(s_text)

    plt.figure(figsize=(10,8))
    plt.imshow(o_word_cloud)
    plt.axis("off")
    plt.tight_layout(pad=0)
    plt.show()