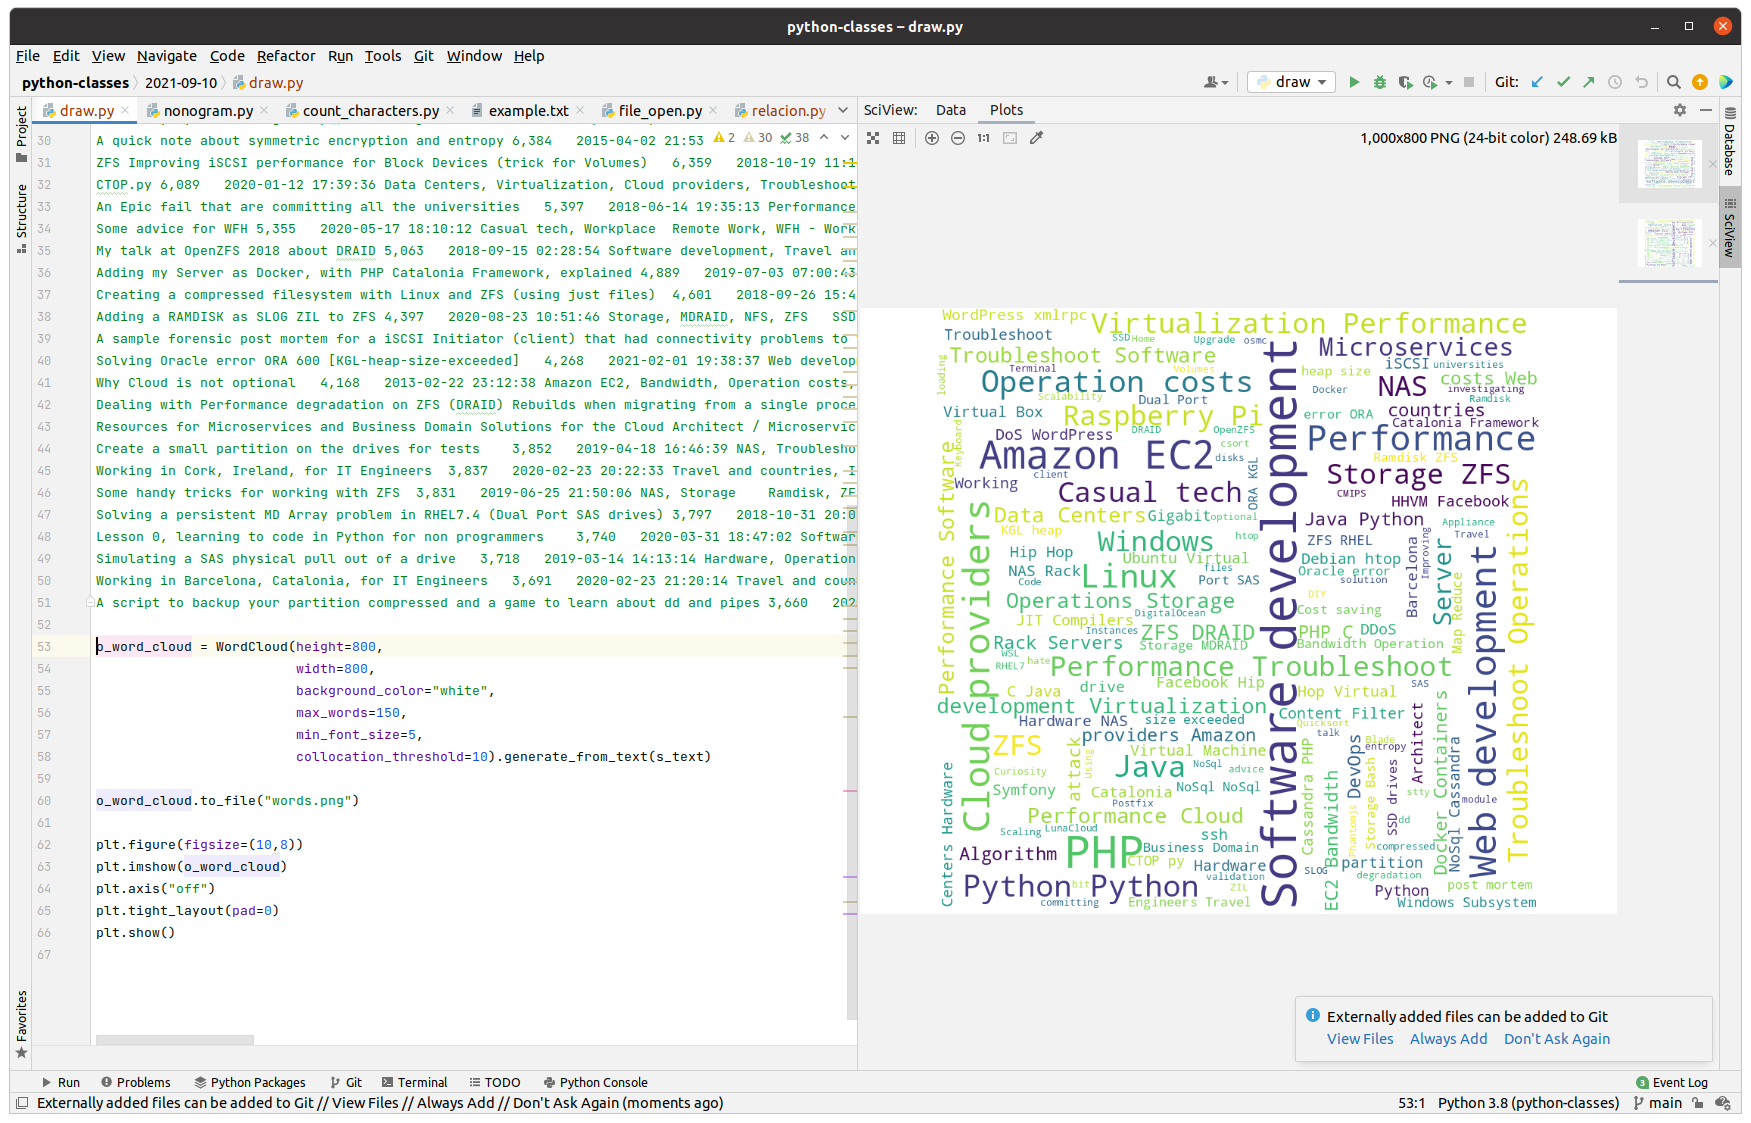
Recently I showed you how to generate a Cloud Tag.
You may like some of other graphs that can be easily generated with matlib package.
I’ve been always working on BackEnd and APIs and I don’t work on FrontEnd, although I programmed some videogames by myself and I’ve fixed some huge bugs in JavaScript in some of the companies I work, but they considered myself the last resource, so I would fix a FrontEnd bug when nobody else could. But even if you work 99.9% of your time in BackEnd, Scaling, Architecture… like me, it is useful being able to draw graphics, for example, when you create a tool that shows the number of players per minute, and its evolution over time, or web visitors in real time, etc…
I wrote this article with two simple examples for my book Python 3 exercises for beginners.
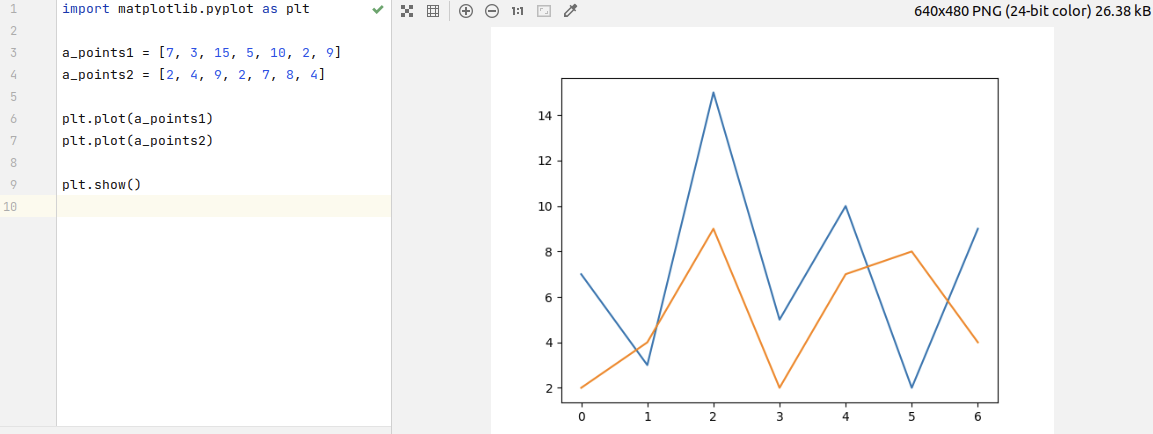
You can find this source code here:
https://gitlab.com/carles.mateo/python-classes/-/blob/main/2021-09-10/draw_points.py
import matplotlib.pyplot as plt

a_points1 = [7, 3, 15, 5, 10, 2, 9]
a_points2 = [2, 4, 9, 2, 7, 8, 4]

plt.plot(a_points1)
plt.plot(a_points2)

plt.show()
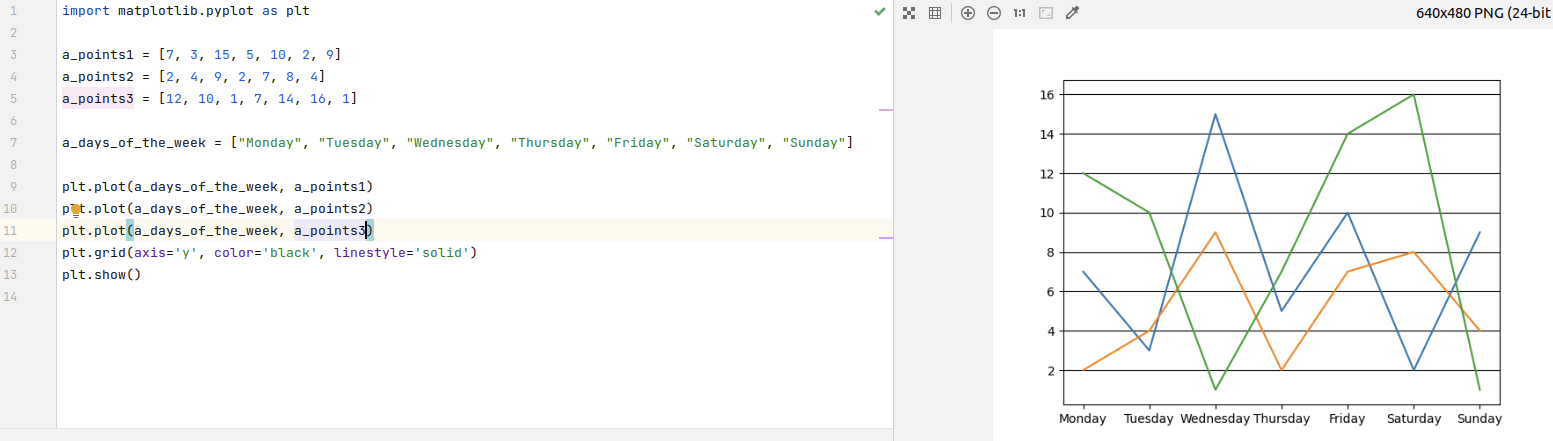
We can also add customized axis:
https://gitlab.com/carles.mateo/python-classes/-/blob/main/2021-09-10/draw_points2.py
import matplotlib.pyplot as plt

a_points1 = [7, 3, 15, 5, 10, 2, 9]
a_points2 = [2, 4, 9, 2, 7, 8, 4]
a_points3 = [12, 10, 1, 7, 14, 16, 1]

a_days_of_the_week = ["Monday", "Tuesday", "Wednesday", "Thursday", "Friday", "Saturday", "Sunday"]

plt.plot(a_days_of_the_week, a_points1)
plt.plot(a_days_of_the_week, a_points2)
plt.plot(a_days_of_the_week, a_points3)
plt.grid(axis='y', color='black', linestyle='solid')
plt.show()
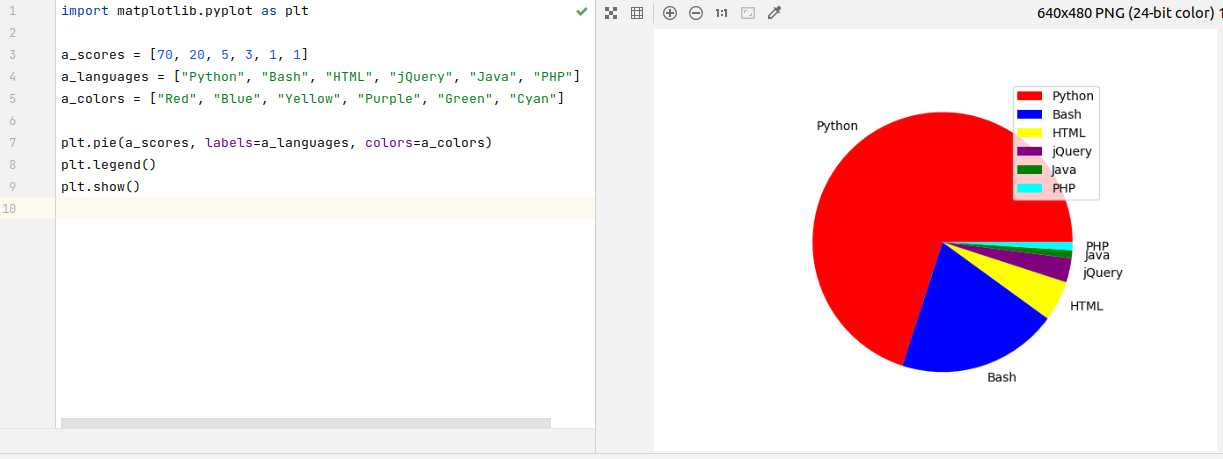
Draw a pie chart
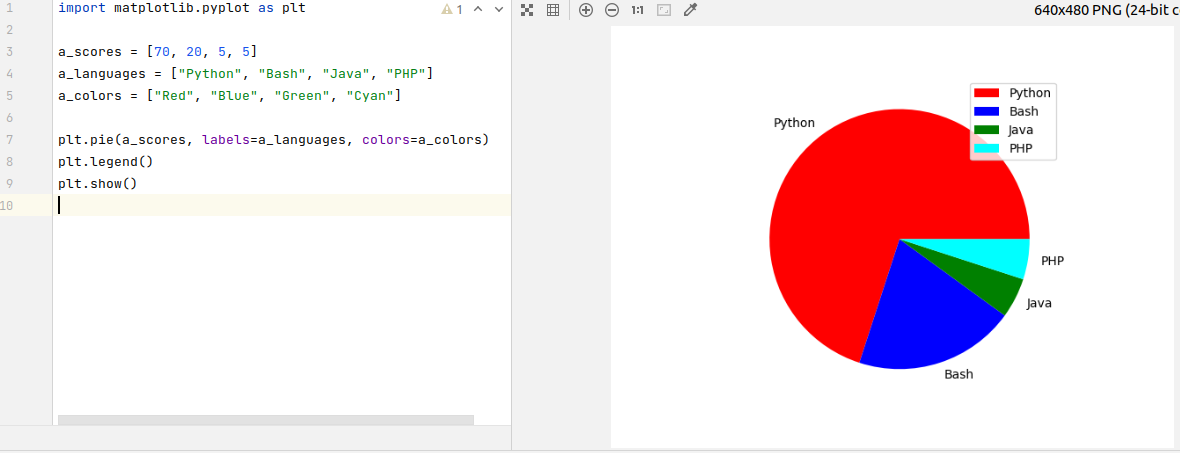
import matplotlib.pyplot as plt

a_scores = [70, 20, 5, 5]
a_languages = ["Python", "Bash", "Java", "PHP"]
a_colors = ["Red", "Blue", "Green", "Cyan"]

plt.pie(a_scores, labels=a_languages, colors=a_colors)
plt.legend()
plt.show()
This graphic represents in which languages I use my time nowadays, or if I update it by adding HTML and jQuery:
https://gitlab.com/carles.mateo/python-classes/-/blob/main/2021-09-10/draw_circle.py