Tag Archives: iostat

Swap, swappiness, Servers not responding

I have read a lot of wrong recommendations about the use of Swap and Swappiness so I want to bring some light about it.

The first to say is that every project is different, so it is not possible to make a general rule. However in most of the cases we want systems to operate as fast and efficiently as possible.

So this suggestions try to covert 99% of the cases.

By default Linux will try to be as efficient as possible. So for example, it will use Free Memory to keep IO efficient by keeping in Memory cache and buffers.

That means that if you are using files often, Linux will keep that information cached in RAM.

The swappiness Kernel setting defines what tradeoff will take Linux between keeping buffers with Free Memory and using the available Swap Memory.

# sysctl vm.swappiness
vm.swappiness = 60

The default value is 60 and more or less means that when RAM memory gets to 60%, swap will start to be used.

And so we can find Servers with 256GB of RAM, that when they start to use more than 153 GB of RAM, they start to swap.

Let’s analyze the output of free -h:

carles@vbi78g:~/Desktop/Software/checkswap$ free -h
              total        used        free      shared  buff/cache   available
Mem:          2.9Gi       1.6Gi       148Mi        77Mi       1.2Gi       1.1Gi
Swap:         2.0Gi        27Mi       2.0Gi

So from this VM that has 2.9GB of RAM Memory, 1.6GB are used by applications.

The are 148MB that can immediately used by Applications, and there are 1.2GB in buffers/cache. Does that means that we can only use 148MB (plus swap)?. No, that mean that Linux tried to optimize io speed by keeping 1.2GB of RAM memory in buffers. But this is the best effort of Linux to have performance, for real applications will be also able to use 1.1GB that corresponds to the available field.

About swap, from 2GB, only 27MB have been used.

As vm.swappiness is set to 60, more RAM will be swapped out to swap, even if we have lots available.

As I said every case is different. If we are talking about a Desktop that has NVMe drives, the impact will be low. But if we are talking about a Server that is a hypervisor running VMs and has high usage on CPU and has the swap partition or the swap in a file, that could lead to huge problems. If there is a physical Server with a single spinning drive (or logical unit through RAID), and one partition is for Swap, and the other for mountpoints, and a process is heavily reading/writing to a partition mounted (an elastic search, or a telegraf, prometheus…), and the System tries to swap, then they will be competing for the magnetic head of disk, slowing down everything.

If you take a look on how the process of swapping memory pages from the memory to disk, you will understand that applications may need certain pages before being able to run, so in many cases we get to lock situations, that force everything to wait.

In my career I found Servers that temporarily stopped responding to ping. After a while ping came back, I was able to ssh and uptime showed that the Server did not reboot.

I troubleshooted that, and I saw a combination of high CPU usage spikes and Swap usage.

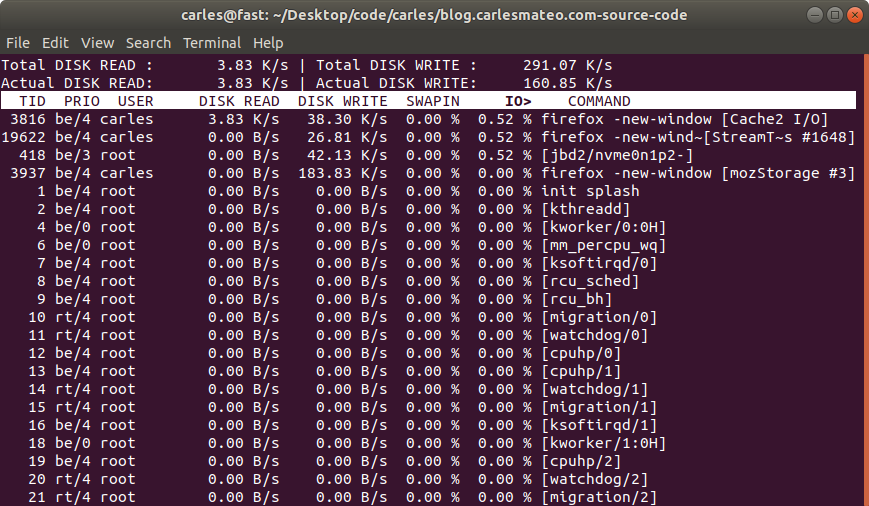
Using iostat and iotop I monitored what was speed of transference of only 1 MB/second!!.

I even did swapoff and it took one hour to free 4 GB swap partition!.

I also saw swap partition being in a spinning disk, and in another partition of the same spinning drive, having a swapfile. Magnetic spinning drives can only access one are of the drive at the same time, so that situation, using swap is very bad.

And I have seen situations were the swap or swapfile was mounted in a block device shared via network with the Server (like iSCSI or NFS), causing terrible performance when swapping.

So you have to adapt the strategy according to the project.

My preferred strategy for Compute Nodes and NoSQL Databases is to not use swap at all. In other cases, like MySQL Databases I may set swappiness to preferably to 1 or to 10.

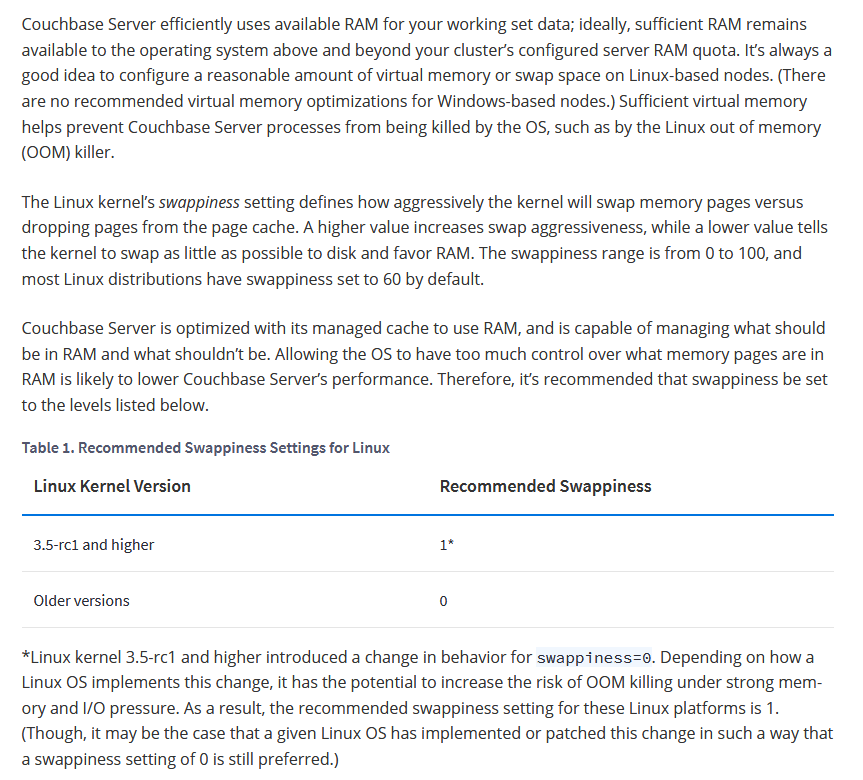
I quote here the recommendations from couchbase docs:

The Linux kernel’s swappiness setting defines how aggressively the kernel will swap memory pages versus dropping pages from the page cache. A higher value increases swap aggressiveness, while a lower value tells the kernel to swap as little as possible to disk and favor RAM. The swappiness range is from 0 to 100, and most Linux distributions have swappiness set to 60 by default.

Couchbase Server is optimized with its managed cache to use RAM, and is capable of managing what should be in RAM and what shouldn’t be. Allowing the OS to have too much control over what memory pages are in RAM is likely to lower Couchbase Server’s performance. Therefore, it’s recommended that swappiness be set to the levels listed below.

https://docs.couchbase.com/server/current/install/install-swap-space.html

Another theme, is when you log to a Server and you see all the Swap memory in use.

Linux may have moved the pages that were less used, and that may be Ok for some cases, for example a Cron Service that waits and runs every 24 hours. It is safe to swap that (as long as the swap IO is decent).

When Kernel Swaps it may generate locks.

But if we log to a Server and all the Swap is in use, how can we know that the Swap has been quiet there?.

Well, you can use iostat or iotop or you can:

cat /proc/vmstat

This file contains a lot of values related to Memory, we will focus on:

pswpin 508992338
pswpout 280871088

In https://superuser.com/questions/785447/what-is-the-exact-difference-between-the-parameters-pgpgin-pswpin-and-pswpou you can find very interesting description of those values. I paste here an excerpt:

Paging refers to writing portions, termed pages, of a process’ memory to disk.
Swapping, strictly speaking, refers to writing the entire process, not just part, to disk.
In Linux, true swapping is exceedingly rare, but the terms paging and swapping often are used interchangeably.

page-out: The system’s free memory is less than a threshold “lotsfree” and unnused / least used pages are moved to the swap area.
page-in: One process which is running requested for a page that is not in the current memory (page-fault), it’s pages are being brought back to memory.
swap-out: System is thrashing and has deactivated a process and it’s memory pages are moved into the swap area.
swap-in: A deactivated process is back to work and it’s pages are being brought into the memory.

Values from /proc/vmstat:

pgpgin, pgpgout – number of pages that are read from disk and written to memory, you usually don’t need to care that much about these numbers

pswpin, pswpout – you may want to track these numbers per time (via some monitoring like prometheus), if there are spikes it means system is heavily swapping and you have a problem.

In this actual example that means that since the start of the Server there has been 508992338 Page Swap In (with 4K memory pages this is 1,941 GB, so almost 2 TB transferred) and for Page Swat Out (with 4K memory pages this is 1,071 GB, so 1 TB of transferred). I’m talking about a Server that had a 4GB swap partition in a spinning disk and a 12 GB swapfile in another ext4 partition of the same spinning disk.

The 16 GB of swap were in use and iotop showed only two sources of IO, one being 2 VMs writing, another was a journaling process writing to the mountpoint where the swapfile was. That was an spinning drive (underlying hardware was raid, for simplicity I refer to one single drive. I checked that both spinning drives were healthy and fast). I saw small variations in the size of the Swap, so I decided to monitor the changes in pswpin and pswpout in /proc/vmstat to see how much was transferred from/to swap.

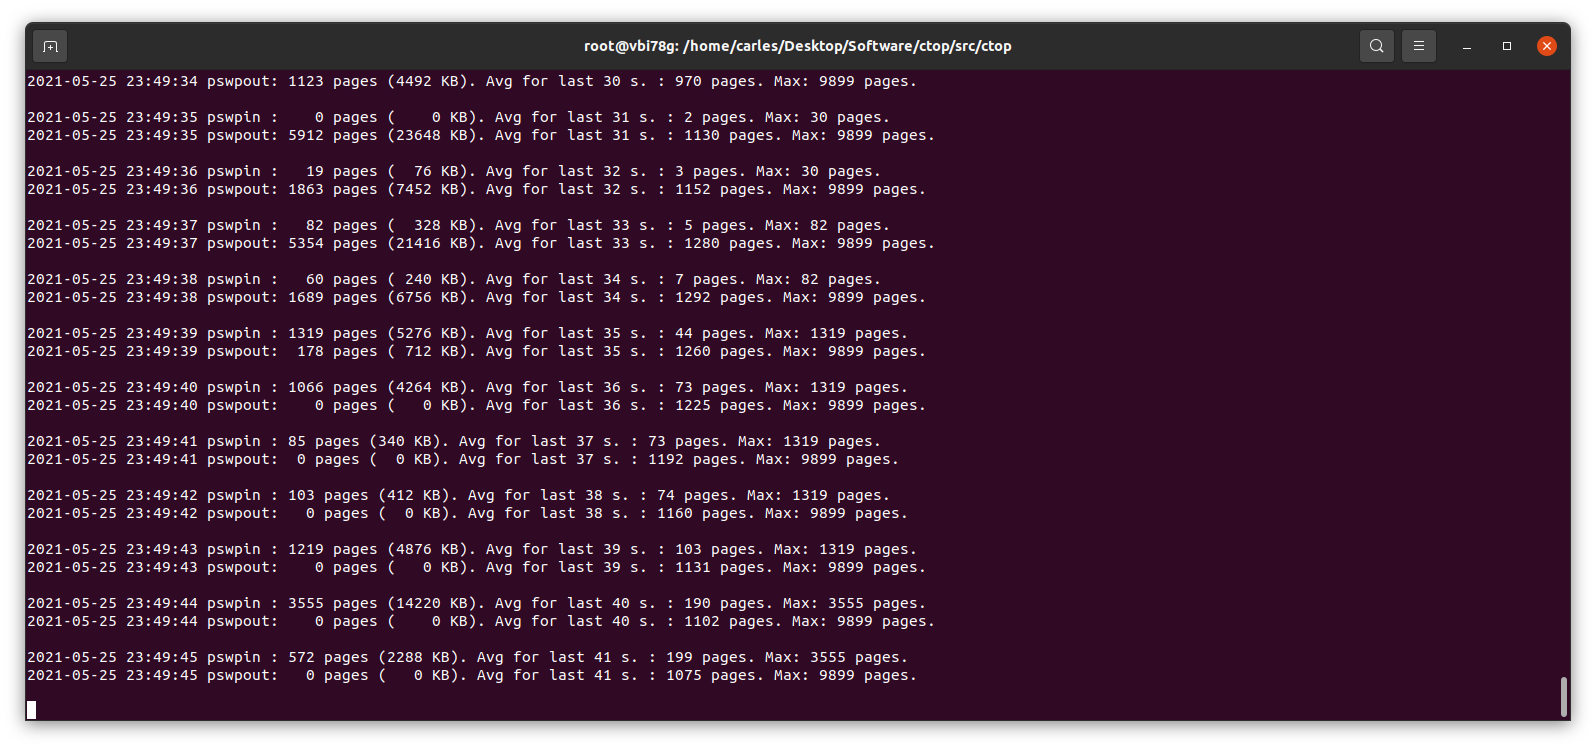
I saw then how many pages were being transferred!.

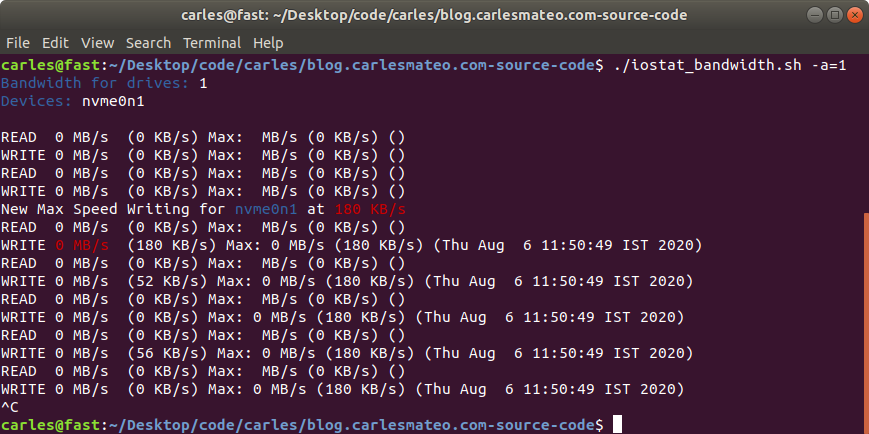
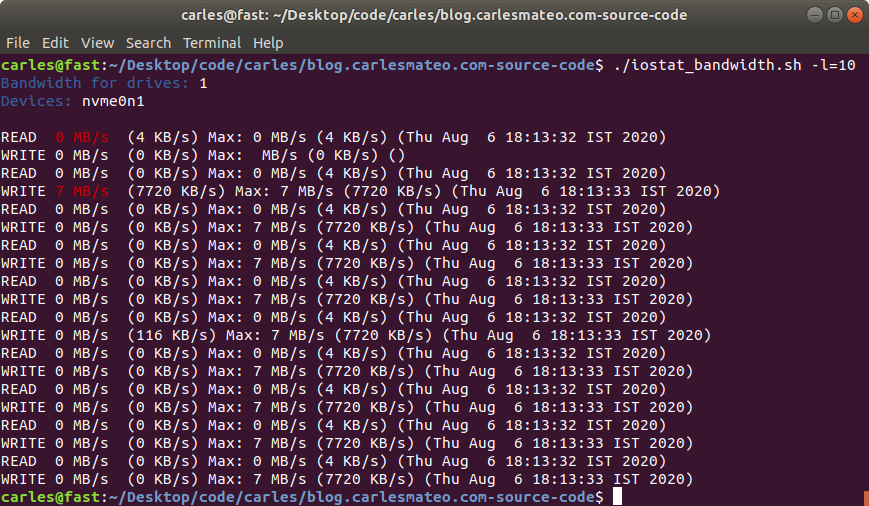
I wrote a small Python program to track those changes:

https://gitlab.com/carles.mateo/checkswap

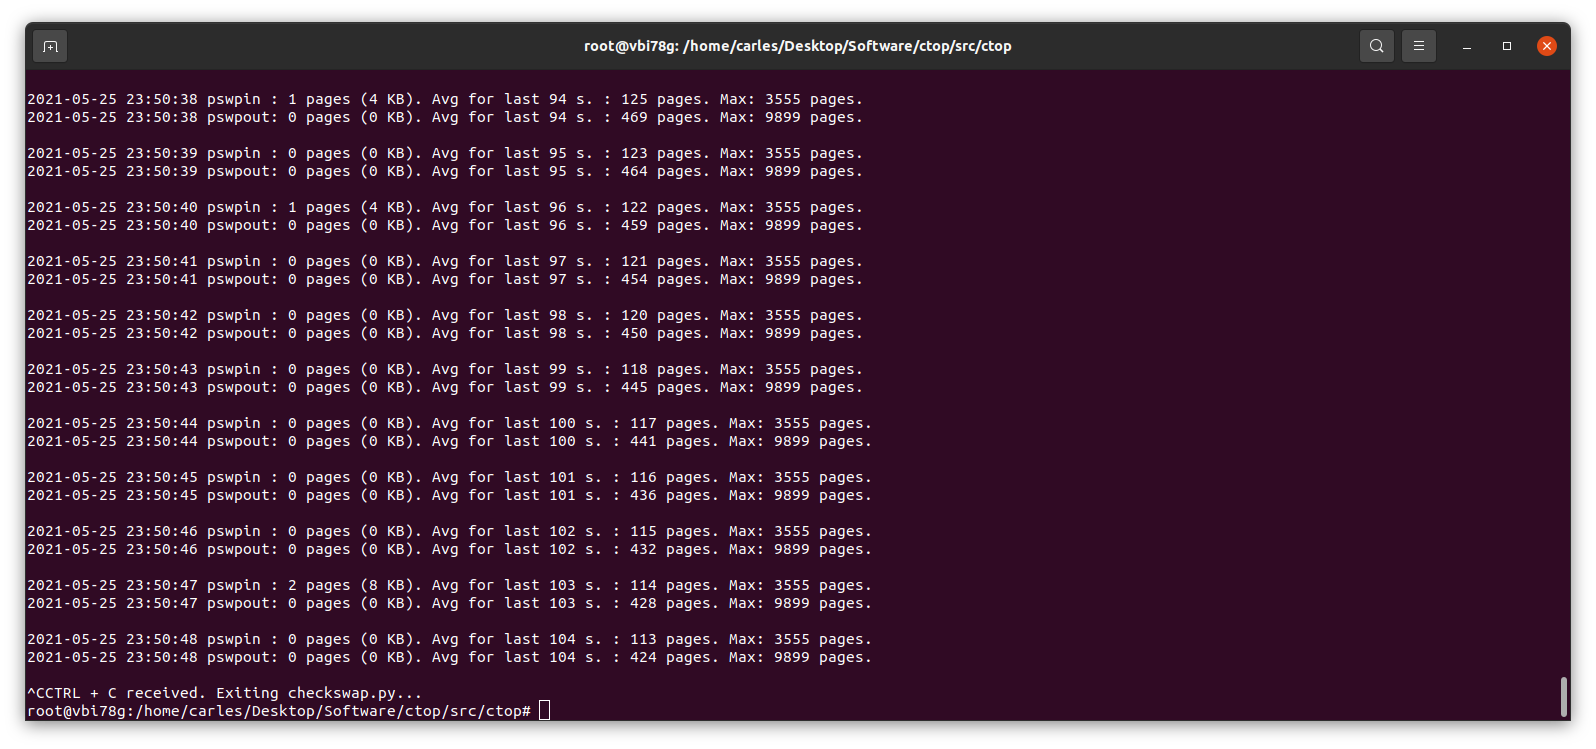
This little program works in Python 2 and Python 3, and will show the evolution of pswpin and pswpout in /proc/vmstat and will offer the average for last 5 minutes and keep the max value detected as well.

As those values show the page swaps since the start of the Server, my little program, makes the adjustments to show the Page Swaps per second.

A cheap way to reproduce collapse by using swap is using VirtualBox: install an Ubuntu 20.04 LTS in there, with 2 GB of less of memory, and one single core. Ping that VM from elsewhere.

Then you may run a little program like this in order to force it to swap:

#!/usr/bin/env python3
a_items = []
i_total = 0
# Add zeros if your VM has more memory
for i in range(0, 10000000):
    i_total = i_total + i
    a_items.append(i_total)

And checkswap will show you the spikes:

Many voices are discordant. Some say swappiness default value of 60 is good, as Linux will use the RAM memory to optimize the IO. In my experience, I’ve seen Hypervisors Servers running Virtual Machines that fit on the available physical RAM and were doing pure CPU calculations, no IO, and the Hypervisor was swapping just because it had swappiness to 60. Also having swap on spinning drives, mixing swap partition and swapfile, and that slowing down everything. In a case like that it would be much better not using Swap at all.

In most cases the price of Swapping to disk is much more higher than the advantage than a buffer for IO brings. And in the case of a swapfile, well, it’s also a file, so my suspect is that the swapfile is also buffered. Nothing I recommend, honestly.

My program https://gitlab.com/carles.mateo/checkswap may help you to demonstrate how much damage the swapping is doing in terms of IO. Combine it with iostat and iotop --only to see how much bandwidth is wasted writing and reading from/to swap.

You may run checkswap from a screen session and launch it with tee so results are logged. For example:

python3 checkswap.py | tee 2021-05-27-2107-checkswap.log

If you want to automatically add the datetime you can use:

python3 checkswap.py | tee `date +%Y-%m-%d-%H%M`-checkswap.log

Press CTRL + a and then d, in order to leave the screen session and return to regular Bash.

Type screen -r to resume your session if this was the only screen session running in background.

An interesting reflection from help Ubuntu:

The “diminishing returns” means that if you need more swap space than twice your RAM size, you’d better add more RAM as Hard Disk Drive (HDD) access is about 10³ slower then RAM access, so something that would take 1 second, suddenly takes more then 15 minutes! And still more then a minute on a fast Solid State Drive (SSD)…

https://help.ubuntu.com/community/SwapFaq

Do you have a swap history that you want to share?.

iostat_bandwitdth.sh – Utility to calculate the bandwidth used by all your drives

This is a shell script I made long time ago and I use it to monitor in real time what’s the total or individual bandwidth and maximum bandwidth achieved, for READ and WRITE, of Hard drives and NMVe devices.

It uses iostat to capture the metrics, and then processes the maximum values, the combined speed of all the drives… has also an interesting feature to let out the booting device. That’s very handy for Rack Servers where you boot from an SSD card or and SD, and you want to monitor the speed of the other (SAS probably) devices.

I used it to monitor the total bandwidth achieved by our 4U60 and 4U90 Servers, the All-Flash-Arrays 2U and the NVMe 1U units in Sanmina and the real throughput of IOC (Input Output Controllers).

I used also to compare what was the real data written to ZFS and mdraid RAID systems, and to disks and the combined speed with different pool configurations, as well as the efficiency of iSCSI and NFS from clients to the Servers.

You can specify how many times the information will be printed, whether you want to keep the max speed of each device per separate, and specify a drive to exclude. Normally it will be the boot drive.

If you want to test performance metrics you should make sure that other programs are not running or using the swap, to prevent bias. You should disable the boot drive if it doesn’t form part of your tests (like in the 4U60 with an SSD boot drive in a card, and 60 hard drive bays SAS or SATA).

You may find useful tools like iotop.

You can find the code here, and in my gitlab repo:

https://gitlab.com/carles.mateo/blog.carlesmateo.com-source-code/-/blob/master/iostat_bandwidth.sh

#!/usr/bin/env bash

AUTHOR="Carles Mateo"
VERSION="1.4"

# Changelog
# 1.4
# Added support for NVMe drives
# 1.3
# Fixed Decimals in KB count that were causing errors
# 1.2
# Added new parameter to output per drive stats
# Counting is performed in KB

# Leave boot device empty if you want to add its activity to the results
# Specially thinking about booting SD card or SSD devices versus SAS drives bandwidth calculation.
# Otherwise use i.e.: s_BOOT_DEVICE="sdcv"
s_BOOT_DEVICE=""
# If this value is positive the loop will be kept n times
# If is negative ie: -1 it will loop forever
i_LOOP_TIMES=-1
# Display all drives separatedly
i_ALL_SEPARATEDLY=0
# Display in KB or MB
s_DISPLAY_UNIT="M"

# Init variables
i_READ_MAX=0
i_WRITE_MAX=0
s_READ_MAX_DATE=""
s_WRITE_MAX_DATE=""
i_IOSTAT_READ_KB=0
i_IOSTAT_WRITE_KB=0

# Internal variables
i_NUMBER_OF_DRIVES=0
s_LIST_OF_DRIVES=""
i_UNKNOWN_OPTION=0

# So if you run in screen you see colors :)
export TERM=xterm

# ANSI colors
s_COLOR_RED='\033[0;31m'
s_COLOR_BLUE='\033[0;34m'
s_COLOR_NONE='\033[0m'

for i in "$@"
do
    case $i in
        -b=*|--boot_device=*)
        s_BOOT_DEVICE="${i#*=}"
        shift # past argument=value
        ;;
        -l=*|--loop_times=*)
        i_LOOP_TIMES="${i#*=}"
        shift # past argument=value
        ;;
        -a=*|--all_separatedly=*)
        i_ALL_SEPARATEDLY="${i#*=}"
        shift # past argument=value
        ;;
        *)
        # unknown option
        i_UNKNOWN_OPTION=1
        ;;
    esac
done

if [[ "${i_UNKNOWN_OPTION}" -eq 1 ]]; then
    echo -e "${s_COLOR_RED}Unknown option${s_COLOR_NONE}"
    echo "Use: [-b|--boot_device=sda -l|--loop_times=-1 -a|--all-separatedly=1]"
    exit 1
fi

if [ -z "${s_BOOT_DEVICE}" ]; then
    i_NUMBER_OF_DRIVES=`iostat -d -m | grep "sd\|nvm" | wc --lines`
    s_LIST_OF_DRIVES=`iostat -d -m | grep "sd\|nvm" | awk '{printf $1" ";}'`
else
    echo -e "${s_COLOR_BLUE}Excluding Boot Device:${s_COLOR_NONE} ${s_BOOT_DEVICE}"
    # Add an space after the name of the device to prevent something like booting with sda leaving out drives like sdaa sdab sdac...
    i_NUMBER_OF_DRIVES=`iostat -d -m | grep "sd\|nvm" | grep -v "${s_BOOT_DEVICE} " | wc --lines`
    s_LIST_OF_DRIVES=`iostat -d -m | grep "sd\|nvm" | grep -v "${s_BOOT_DEVICE} " | awk '{printf $1" ";}'`
fi

AR_DRIVES=(${s_LIST_OF_DRIVES})
i_COUNTER_LOOP=0
for s_DRIVE in ${AR_DRIVES};
do
    AR_DRIVES_VALUES_AVG[i_COUNTER_LOOP]=0
    AR_DRIVES_VALUES_READ_MAX[i_COUNTER_LOOP]=0
    AR_DRIVES_VALUES_WRITE_MAX[i_COUNTER_LOOP]=0
    i_COUNTER_LOOP=$((i_COUNTER_LOOP+1))
done


echo -e "${s_COLOR_BLUE}Bandwidth for drives:${s_COLOR_NONE} ${i_NUMBER_OF_DRIVES}"
echo -e "${s_COLOR_BLUE}Devices:${s_COLOR_NONE} ${s_LIST_OF_DRIVES}"
echo ""

while [ "${i_LOOP_TIMES}" -lt 0 ] || [ "${i_LOOP_TIMES}" -gt 0 ] ;
do
    s_READ_PRE_COLOR=""
    s_READ_POS_COLOR=""
    s_WRITE_PRE_COLOR=""
    s_WRITE_POS_COLOR=""
    # In MB
    # s_IOSTAT_OUTPUT_ALL_DRIVES=`iostat -d -m -y 1 1 | grep "sd\|nvm"`
    # In KB
    s_IOSTAT_OUTPUT_ALL_DRIVES=`iostat -d -y 1 1 | grep "sd\|nvm"`
    if [ -z "${s_BOOT_DEVICE}" ]; then
        s_IOSTAT_OUTPUT=`printf "${s_IOSTAT_OUTPUT_ALL_DRIVES}" | awk '{sum_read += $3} {sum_write += $4} END {printf sum_read"|"sum_write"\n"}'`
    else
        # Add an space after the name of the device to prevent something like booting with sda leaving out drives like sdaa sdab sdac...
        s_IOSTAT_OUTPUT=`printf "${s_IOSTAT_OUTPUT_ALL_DRIVES}" | grep -v "${s_BOOT_DEVICE} " | awk '{sum_read += $3} {sum_write += $4} END {printf sum_read"|"sum_write"\n"}'`
    fi

    if [ "${i_ALL_SEPARATEDLY}" -eq 1 ]; then
        i_COUNTER_LOOP=0
        for s_DRIVE in ${AR_DRIVES};
        do
            s_IOSTAT_DRIVE=`printf "${s_IOSTAT_OUTPUT_ALL_DRIVES}" | grep $s_DRIVE | head --lines=1 | awk '{sum_read += $3} {sum_write += $4} END {printf sum_read"|"sum_write"\n"}'`
            i_IOSTAT_READ_KB=`printf "%s" "${s_IOSTAT_DRIVE}" | awk -F '|' '{print $1;}'`
            i_IOSTAT_WRITE_KB=`printf "%s" "${s_IOSTAT_DRIVE}" | awk -F '|' '{print $2;}'`
            if [ "${i_IOSTAT_READ_KB%.*}" -gt ${AR_DRIVES_VALUES_READ_MAX[i_COUNTER_LOOP]%.*} ]; then
                AR_DRIVES_VALUES_READ_MAX[i_COUNTER_LOOP]=${i_IOSTAT_READ_KB}
                echo -e "New Max Speed Reading for ${s_COLOR_BLUE}$s_DRIVE${s_COLOR_NONE} at ${s_COLOR_RED}${i_IOSTAT_READ_KB} KB/s${s_COLOR_NONE}"
            echo
            fi
            if [ "${i_IOSTAT_WRITE_KB%.*}" -gt ${AR_DRIVES_VALUES_WRITE_MAX[i_COUNTER_LOOP]%.*} ]; then
                AR_DRIVES_VALUES_WRITE_MAX[i_COUNTER_LOOP]=${i_IOSTAT_WRITE_KB}
                echo -e "New Max Speed Writing for ${s_COLOR_BLUE}$s_DRIVE${s_COLOR_NONE} at ${s_COLOR_RED}${i_IOSTAT_WRITE_KB} KB/s${s_COLOR_NONE}"
            fi

            i_COUNTER_LOOP=$((i_COUNTER_LOOP+1))
        done
    fi

    i_IOSTAT_READ_KB=`printf "%s" "${s_IOSTAT_OUTPUT}" | awk -F '|' '{print $1;}'`
    i_IOSTAT_WRITE_KB=`printf "%s" "${s_IOSTAT_OUTPUT}" | awk -F '|' '{print $2;}'`

    # CAST to Integer
    if [ "${i_IOSTAT_READ_KB%.*}" -gt ${i_READ_MAX%.*} ]; then
        i_READ_MAX=${i_IOSTAT_READ_KB%.*}
        s_READ_PRE_COLOR="${s_COLOR_RED}"
        s_READ_POS_COLOR="${s_COLOR_NONE}"
        s_READ_MAX_DATE=`date`
        i_READ_MAX_MB=$((i_READ_MAX/1024))
    fi
    # CAST to Integer
    if [ "${i_IOSTAT_WRITE_KB%.*}" -gt ${i_WRITE_MAX%.*} ]; then
        i_WRITE_MAX=${i_IOSTAT_WRITE_KB%.*}
        s_WRITE_PRE_COLOR="${s_COLOR_RED}"
        s_WRITE_POS_COLOR="${s_COLOR_NONE}"
        s_WRITE_MAX_DATE=`date`
        i_WRITE_MAX_MB=$((i_WRITE_MAX/1024))
    fi

    if [ "${s_DISPLAY_UNIT}" == "M" ]; then
        # Get MB
        i_IOSTAT_READ_UNIT=${i_IOSTAT_READ_KB%.*}
        i_IOSTAT_WRITE_UNIT=${i_IOSTAT_WRITE_KB%.*}
        i_IOSTAT_READ_UNIT=$((i_IOSTAT_READ_UNIT/1024))
        i_IOSTAT_WRITE_UNIT=$((i_IOSTAT_WRITE_UNIT/1024))
    fi

    # When a MAX is detected it will be displayed in RED
    echo -e "READ  ${s_READ_PRE_COLOR}${i_IOSTAT_READ_UNIT} MB/s ${s_READ_POS_COLOR} (${i_IOSTAT_READ_KB} KB/s) Max: ${i_READ_MAX_MB} MB/s (${i_READ_MAX} KB/s) (${s_READ_MAX_DATE})"
    echo -e "WRITE ${s_WRITE_PRE_COLOR}${i_IOSTAT_WRITE_UNIT} MB/s ${s_WRITE_POS_COLOR} (${i_IOSTAT_WRITE_KB} KB/s) Max: ${i_WRITE_MAX_MB} MB/s (${i_WRITE_MAX} KB/s) (${s_WRITE_MAX_DATE})"
    if [ "$i_LOOP_TIMES" -gt 0 ]; then
        i_LOOP_TIMES=$((i_LOOP_TIMES-1))
    fi
done

The Ethernet standards group announces a new 800 GbE specification

Here is the link to the new: https://www.pcgamer.com/amp/the-ethernet-standards-group-developed-a-new-speed-so-fast-it-had-to-change-its-name/

This is a great new for scaling performance in the Data Centers. For routers, switches…

And this makes me think about all the Architects that are using Memcached and Redis in different Servers, in Networks of 1Gbps and makes me want to share with you what a nonsense, is often, that.

So the idea of having Memcache or Redis is just to cache the queries and unload the Database from those queries.

But 1Gbps is equivalent to 125MB (Megabytes) per second.

Local RAM Memory in Servers can perform at 24GB and more (24,000,000 Megabytes) per second, even more.

A PCIE NVMe drive at 3.5GB per second.

A local SSD drive without RAID 550 MB/s.

A SSD in the Cloud, varies a lot on the provider, number of drives, etc… but I’ve seen between 200 MB/s and 2.5GB/s aggregated in RAID.

In fact I have worked with Servers equipped with several IO Controllers, that were delivering 24GB/s of throughput writing or reading to HDD spinning drives.

If you’re in the Cloud. Instead of having 2 Load Balancers, 100 Front Web servers, with a cluster of 5 Redis with huge amount of RAM, and 1 MySQL Master and 1 Slave, all communicating at 1Gbps, probably you’ll get a better performance having the 2 LBs, and 11 Front Web with some more memory and having the Redis instance in the same machine and saving the money of that many small Front and from the 5 huge dedicated Redis.

The same applies if you’re using Docker or K8s.

Even if you just cache the queries to drive, speed will be better than sending everything through 1 Gbps.

This will matter for you if your site is really under heavy load. Most of the sites just query the MySQL Server using 1 Gbps lines, or 2 Gbps in bonding, and that’s enough.

Dealing with Performance degradation on ZFS (DRAID) Rebuilds when migrating from a single processor to a multiprocessor platform

This is the history it happen to me some time ago, and so the commands I used to troubleshot. The purpose is to share knowledge in a interactive way. There are some hidden gems that you’ll acquire if you have the patience to go over all the document and read it all…

I had qualified Intel Xeon single processor platform to run my DRAID (ZFS Declustered RAID) project for my employer.

The platforms I qualified were:

1) single processor for Cold Storage (SAS Spinning drives): 4U60, newest models 4602

2) for multiprocessor: the 4U90 (90 Spinning drives) and Flash: All-Flash-Arrays.

The amounts of RAM I was using for my tests range for 64GB to 384GB.

Somebody in the company, at executive level, assembled an experimental config that was totally new for us and wanted to try by their own. It was the 4602 with multiprocessor and 32GB of RAM.

When they were unable to make it work at the expected speed, they required me to troubleshot and to make it work.

The 4602 single processor had two IOC (Input Output Controller, LSI Logic / Symbios Logic SAS3008 PCI-Express Fusion-MPT SAS-3 (rev 02) ), while the 4602 double processor had four IOC, so given that each of those IOC can perform at peaks of 6GB/s, with a maximum total of 24 GB/s, the performance when reading/writing from all the drives should be better.

But this Server was returning double times for Rebuilding, respect the single processor version, which didn’t make any sense.

I had to check everything. There was the commands I ran:

Check the upgrade of the CPU:

htop
lscpu

Changing the Zoning.

Those Servers use SAS drives dual ported, which means that two different computers can be connected to the same drive and operate at the same time. Is up to you to make sure you don’t introduce corruption. Those systems are used mainly for HA (High Availability).

Those Systems allow to be configured in different zoning modes. That’s the way on how each of the two servers (Controllers) see the disk. In one zoning each Controller sees only 30 drives, in another each IOC sees all the drives (for redundancy but performance constrained to 1 IOC Speed).

The config I set is each IOC will see 15 drives, so each one of the 4 IOC will have 6GB/s for 15 drives. Given that these spinning drives perform in the outtermost part of the cylinder at 265MB/s, that means that at maximum speed one IOC will be using 3.97 GB/s, will say 4GB/s. Plenty of bandwidth.

Note: Spinning drives have different performance depending on how close you’re to the cylinder. In the innermost part it goes under 145 MB/s, and if you read all of those drive sequentially with dd it will return an average speed of 145 MB/s.

With this command you can sive live how it performs and the average read speed in real time. Use skip to jump to that position (relative to bs) in the drive, so you can test directly the speed at the innermost close to the cylinder part of t.

dd if=/dev/sda of=/dev/null bs=1M status=progress

I saw that the zoning was not right one, so I set it correctly:

[root@4602Carles ~]# sg_map -i | grep NEWISYS
/dev/sg30  NEWISYS   NDS-4602-CS       0112
/dev/sg61  NEWISYS   NDS-4602-CS       0112
/dev/sg63  NEWISYS   NDS-4602-CS       0112
/dev/sg64  NEWISYS   NDS-4602-CS       0112
[root@4602Carles10 ~]# sg_senddiag /dev/sg30  --pf --raw=04,00,00,01,53
[root@4602Carles10 ~]# sleep 50
[root@4602Carles10 ~]# sg_senddiag /dev/sg30 --pf -r 04,00,00,01,43
[root@4602Carles10 ~]# sleep 50
[root@4602Carles10 ~]# reboot

The sleeps after rebooting the expanders are recommended. Rebooting the Operating System too, to avoid problems with some Software as the expanders changed live.

If you have ZFS pools or workloads stop them and export the pool before messing with the expanders.

In order to check to which drives is connected each IOC:

[root@4602Carles10 ~]# sg_map -i -x
/dev/sg0  0 0 0 0  0  /dev/sda  TOSHIBA   MG07SCA14TA       0101
/dev/sg1  0 0 1 0  0  /dev/sdb  TOSHIBA   MG07SCA14TA       0101
/dev/sg2  0 0 2 0  0  /dev/sdc  TOSHIBA   MG07SCA14TA       0101
/dev/sg3  0 0 3 0  0  /dev/sdd  TOSHIBA   MG07SCA14TA       0101
/dev/sg4  0 0 4 0  0  /dev/sde  TOSHIBA   MG07SCA14TA       0101
/dev/sg5  0 0 5 0  0  /dev/sdf  TOSHIBA   MG07SCA14TA       0101
/dev/sg6  0 0 6 0  0  /dev/sdg  TOSHIBA   MG07SCA14TA       0101
/dev/sg7  0 0 7 0  0  /dev/sdh  TOSHIBA   MG07SCA14TA       0101
/dev/sg8  1 0 8 0  0  /dev/sdi  TOSHIBA   MG07SCA14TA       0101
/dev/sg9  1 0 9 0  0  /dev/sdj  TOSHIBA   MG07SCA14TA       0101
/dev/sg10  1 0 10 0  0  /dev/sdk  TOSHIBA   MG07SCA14TA       0101
/dev/sg11  1 0 11 0  0  /dev/sdl  TOSHIBA   MG07SCA14TA       0101
[...]
/dev/sg16  4 0 16 0  0  /dev/sdq  TOSHIBA   MG07SCA14TA       0101
/dev/sg17  4 0 17 0  0  /dev/sdr  TOSHIBA   MG07SCA14TA       0101
[...]
/dev/sg30  0 0 30 0  13  NEWISYS   NDS-4602-CS       0112
[...]

Still after setting the right zone the Rebuilds were slow, the scan rate half of the obtained with a single processor.

I tested that the system was able to provide the expected performance by reading from all the drives at the same time. This is done with:

dd if=/dev/sda of=/dev/null bs=1M status=progress &
dd if=/dev/sdb of=/dev/null bs=1M status=progress &
dd if=/dev/sdc of=/dev/null bs=1M status=progress &
dd if=/dev/sdd of=/dev/null bs=1M status=progress &
[...]

I do this for all the drives at the same time and with iostat:

iostat -y 1 1

I check the status of the memory with:

slabtop
free
htop

I checked the memory and htop during a Rebuild. Memory was more than enough. However CPU usage was higher than expected.

The red bars in the image correspond to kernel processes, in this case is the DRAID Rebuild. I see that the load is higher than the usual with a single processor.

I capture all the parameters from ZFS with:

zfs get all

All this information is logged into my forensics document, so later can be checked by my Team or I can share with other Architects or other members of the company. I started this methodology after I knew how Google do their SRE forensics / postmortem documents. Also for myself is useful for the future to have a log of the commands I executed and a verbose output of the results.

I install the smp_utils

yum install smp_utils

Check things:

ls -al  /dev/bsg/
total 0drwxr-xr-x.  2 root root     3020 May 22 10:16 .
drwxr-xr-x. 20 root root     8680 May 22 10:16 ..
crw-------.  1 root root 248,  76 May 22 10:00 1:0:0:0
crw-------.  1 root root 248, 126 May 22 10:00 10:0:0:0
crw-------.  1 root root 248, 127 May 22 10:00 10:0:1:0
crw-------.  1 root root 248, 136 May 22 10:00 10:0:10:0
crw-------.  1 root root 248, 137 May 22 10:00 10:0:11:0
crw-------.  1 root root 248, 138 May 22 10:00 10:0:12:0
crw-------.  1 root root 248, 139 May 22 10:00 10:0:13:0
[...]
[root@4602Carles10 ~]# smp_discover /dev/bsg/expander-1:0
[...]
[root@4602Carles10 ~]# smp_discover /dev/bsg/expander-1:1

I check for errors in the expander that could justify the problems of performance:

for i in `seq 0 64`; do smp_rep_phy_err_log -p $i /dev/bsg/expander-1\:0 ; done
Report phy error log response:
  Expander change count: 567
  phy identifier: 0
  invalid dword count: 0
  running disparity error count: 0
  loss of dword synchronization count: 0
  phy reset problem count: 0
[...]
Report phy error log response:
  Expander change count: 567
  phy identifier: 52
  invalid dword count: 168
  running disparity error count: 172
  loss of dword synchronization count: 5
  phy reset problem count: 0
Report phy error log response:
  Expander change count: 567
  phy identifier: 53
  invalid dword count: 6
  running disparity error count: 6
  loss of dword synchronization count: 0
  phy reset problem count: 0
Report phy error log response:
  Expander change count: 567
  phy identifier: 54
  invalid dword count: 267
  running disparity error count: 270
  loss of dword synchronization count: 4
  phy reset problem count: 0
Report phy error log response:
  Expander change count: 567
  phy identifier: 55
  invalid dword count: 127
  running disparity error count: 131
  loss of dword synchronization count: 5
  phy reset problem count: 0
Report phy error log result: Phy vacant

There are some errors, and I check with the Hardware Team, which pass a battery of tests on the machine and say that the machine passes. They tell me that if the errors counted were in order of millions then it would be a problem, but having few of them is usual.

My colleagues previously reported that the memory was performing well, and the CPU too. They told me that the speed was exactly double respect a platform with one single CPU of the same kind.

Even if they told me that, I ran cmips tests to make sure.

git clone https://github.com/cmips/cmips_bin

It scored 16,000. The performance was Ok in general terms but the problem is that I didn’t have a baseline for that processor in single processor, so I cannot make sure that the memory bandwidth was Ok. The performance was less that an Amazon c3.8xlarge. The system I was testing is a two processor system, but each CPU is cheap, around USD $400.

Still my gut feeling was telling me that this double processor server should score more.

lscpu
[root@DRAID-1135-14TB-2CPU ~]# lscpu
 Architecture:          x86_64
 CPU op-mode(s):        32-bit, 64-bit
 Byte Order:            Little Endian
 CPU(s):                32
 On-line CPU(s) list:   0-31
 Thread(s) per core:    2
 Core(s) per socket:    8
 Socket(s):             2
 NUMA node(s):          2
 Vendor ID:             GenuineIntel
 CPU family:            6
 Model:                 79
 Model name:            Intel(R) Xeon(R) CPU E5-2620 v4 @ 2.10GHz
 Stepping:              1
 CPU MHz:               2299.951
 CPU max MHz:           3000.0000
 CPU min MHz:           1200.0000
 BogoMIPS:              4199.73
 Virtualization:        VT-x
 L1d cache:             32K
 L1i cache:             32K
 L2 cache:              256K
 L3 cache:              20480K
 NUMA node0 CPU(s):     0-7,16-23
 NUMA node1 CPU(s):     8-15,24-31
 Flags:                 fpu vme de pse tsc msr pae mce cx8 apic sep mtrr pge mca cmov pat pse36 clflush dts acpi mmx fxsr sse sse2 ss ht tm pbe syscall nx pdpe1gb rdtscp lm constant_tsc arch_perfmon pebs bts rep_good nopl xtopology nonstop_tsc aperfmperf eagerfpu pni pclmulqdq dtes64 monitor ds_cpl vmx smx est tm2 ssse3 sdbg fma cx16 xtpr pdcm pcid dca sse4_1 sse4_2 x2apic movbe popcnt tsc_deadline_timer aes xsave avx f16c rdrand lahf_lm abm 3dnowprefetch epb cat_l3 cdp_l3 intel_ppin intel_pt ibrs ibpb stibp tpr_shadow vnmi flexpriority ept vpid fsgsbase tsc_adjust bmi1 hle avx2 smep bmi2 erms invpcid rtm cqm rdt_a rdseed adx smap xsaveopt cqm_llc cqm_occup_llc cqm_mbm_total cqm_mbm_local dtherm ida arat pln pts spec_ctrl intel_stibp

I check the memory configuration with:

dmidecode -t memory

I examined the results, I see that the processor can only operate the DDR4 ECC 2400 Memory at 2133 and… I see something!. This Controller before was a single processor with 2 Memory Sticks of 16GB each, dual rank.

I see that now I have the same number of sticks in that machine, but I have two CPU!. So 2 Memory sticks in total, for 2 CPU.

That’s no good. The memory must be in pairs and in the right slots to get the maximum performance.

1 memory module for 1 CPU doesn’t allow to have Dual Channel and probably is affecting the performance. Many Servers will not even boot if you add an odd number of memory sticks per CPU.

And many Servers can operate at full speed only if all the banks are filled.

I request to the Engineers in Silicon Valley to add 4 modules in the right slots. They did, and I repeated the tests and the performance was doubled then.

After some days I had some time with the machine, I repeated the test and I got a CMIPS Score of around 20,000.

Multiprocessor world is far more complicated than single processor. Some times things can work not as expected, and not be evident, for example cache pipeline can act diferent for a program working in multiprocessor and single processor. Or the QPI could be saturated.

After this I shared my forensics document with as many Engineers as I could, so they could learn how I did to troubleshot the problem, and what was the origin of it, and I asked them to do the same so we can track their steps and progress if something needs to be troubleshoot.

After proper intensive testing the Server was qualified. Lesson here is that changes cannot be commited quickly, need their time.