I tested Google Cloud when they were in beta, years ago, and I helped their Team to improve the service. And I’ve been using Google Cloud for years.
Here I explain, how an incident, this August, almost made me leave Google Cloud for good. In fact, I migrated many services to other providers. I walk through the steps I took.
The best advice to start with, is, enable Cloud Billing alerts.
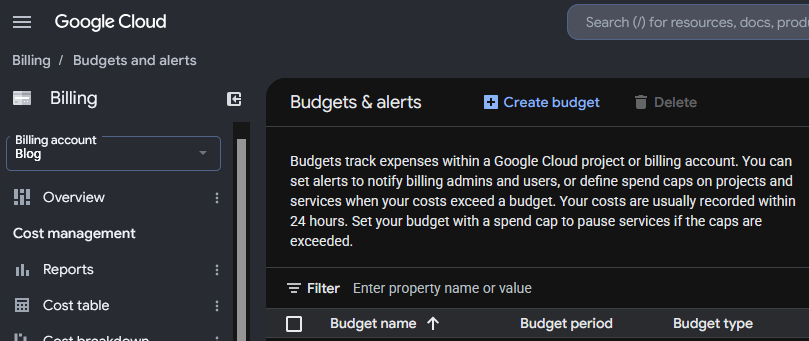
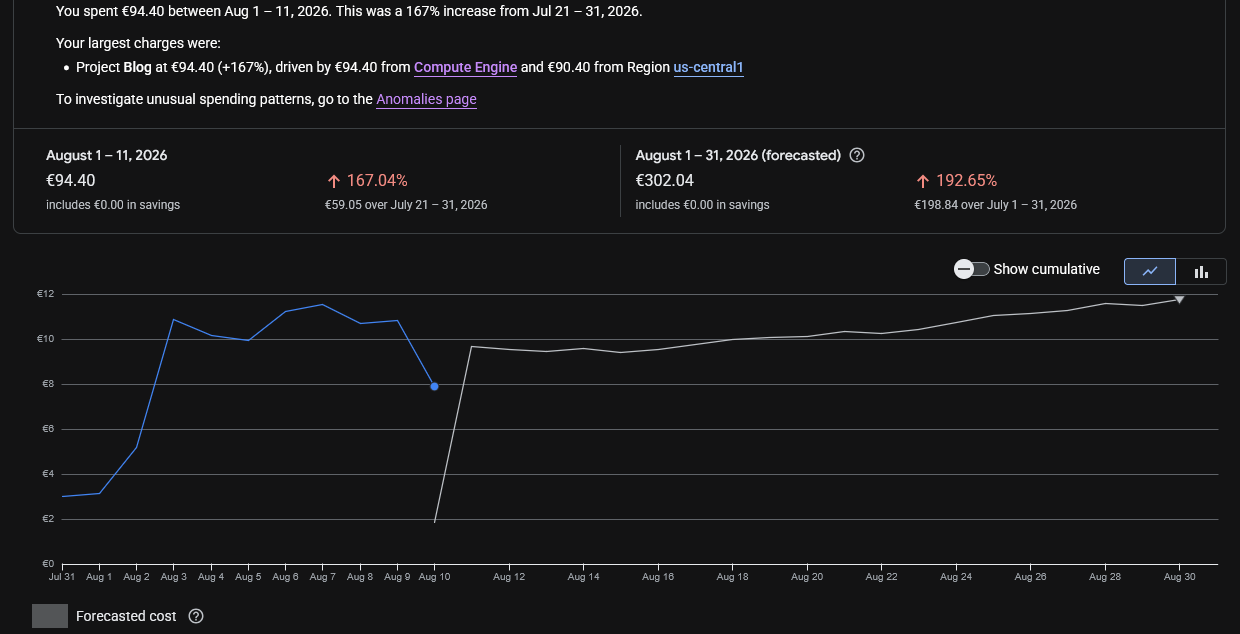
Everything started with the alert of Cloud Billing alerting me that half of the budget for the month had been exhausted around the 7th of the month. I checked the panel, and at the beginning I didn’t pay much attention to it, as Billing was indicating that the extra cost was in Compute in a specific region where I had provisioned new instances and more storage and it was just few euros.
Compute Engine Costs are mixed with the bandwidth consumption in the Dashboards which makes no sense:

So, I had to check different dashboards to realise it was a data transfer issue, and honestly, at the beginning I didn’t know where the problem was, but as I wrongly inferred, that the instance generating egress traffic was the one named “ubuntu26-04” I was investigating mainly that.
The first thing to learn that Google Cloud Billing shows the pure Compute and bandwidth usage together. I dislike it, for obvious reasons.
Next day budget for the month was almost gone.
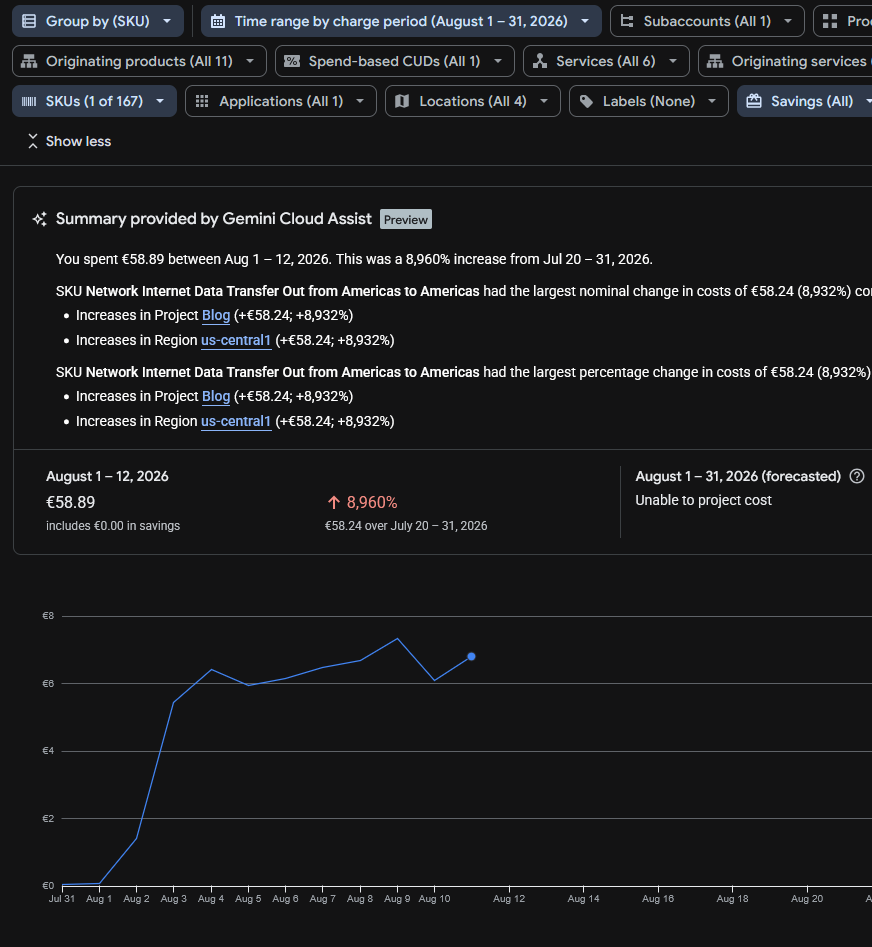
Running the reports I saw “SKU Network Internet Data Transfer Out from Americas to Americas” which was confusing, and initially made me think if it could be the new backups system, sending the backups to my centralised server using the AI compatible agent with the public IP for the API and encryption, but I discarded this very quickly due to the volume of data and I modified the system to use internal IPs instead of the public ones.
The only clear thing at this point was that Internet data transfer (egress) was being sent, and Google makes you pay for that.
I had released several projects recently, like https://read.carlesmateo.com/en Text-to-speech to generate MP3 from text files, or https://sendmeafile.carlesmateo.com/en to send and receive huge files, with resume, checksum verification, AI compatible… So my first thought was that one of the projects or its dependencies could have been compromised, or fanatic AI/crawlers were downloading the sample MP3 files again and again.
I made a mistake when checking Cloud Billing. It indicated that the expenses came from us-central1, so checked the list of instances’ regions and I thought the problem came from a new instance named “ubuntu26-04”.
But I made a mistake, because there are several zones in every region, like us-central1-a, us-central1-b, us-central1-c… My new instance for the new projects was in the zone us-central1-f but I had more than that one instance in the region, only that in different zones. But when I checked the zones for the instances I did not realise that there was more than one instance in the zone us-central1 and I assumed the new instance was the only one in the zone and should be the one generating the egress traffic.
I only had ports 80 and 443 opened in Google’s firewall, so there could be requests to the web server, or that the server got hacked. I analysed the nginx logs for the server and found no huge traffic or big files being requested.
Nowadays bots and crawlers and AI’s generate a crazy amount of traffic, so I had to discard this.
Also, recently Amazon had a problem were it presented huge bills (erroneous) of more than 1 Million dollars to some customers. I didn’t know if Google was calculating the bandwidth costs well.
The Billing Dashboard showed that the increment in data sent was costing me around 11€ per day, so it allowed me to start moving services from that server, with relative calm. The forecast for all the August month displayed that the bill would cost me 300€, which was not nice.
In the meantime I hired a VPS with unlimited data and started to migrate the Docker services there as fast as I could with the idea of shutting down the compromise instance to cut the costs.
One of the things that really made me angry, while I was migrating to avoid those over costs, is that I checked again, the next day, the Cloud Billing Reports, the web loaded and informed me that it had changed with news and showed some floating popups pointing how it work and some improvements pushed by the Google Dev Team, and when I continued, the Cloud Billing Report was displaying an unexpected amount of money to pay in August 2026, more than 10 times what I expected, instead of the forecast I saw previously. So it looked like I had to pay that amount for August, and I started to look at what caused that increment of costs quickly, which fas frustrating. And after a while, when I was thinking about stopping the services, I found that Google had changed the page of the reports and the filters were reset to yearly, and the page was showing the already paid costs from 1st August 2025 to 31th August 2026.
Later I reported how frustrating was the experience to Google as “you should not do that” and “users dislike frequent changes”.

Companies are not aware that when they change things, they often annoy the customers a lot.
Years ago I migrated from my long term account with Amazon AWS to Google Cloud Compute Engine cause I was feed up of the problems in Amazon, how many programming errors they had, the changes they did, causing problems, like to the identifiers of the objects (I had older created objects, with shorter hash, and some API calls did not work any more), and how difficult they made simple things. User Interface was bad, and they also lost two of my instances and communicated really poorly (I also reported that to a friend in Amazon and I had some conversations with Amazon’s AWS PMs), and they were over expensive for developers, so I ended migrating to Google Cloud. And now Google is repeating some of the same mistakes.
They are not only expensive. They make things that could be easy, difficult, for the developers.
These big companies force you to stay continuously learning they changes. They offer great solutions for the Enterprise, but for developers and Startups the costs could be overkill.
Probably they are over-kill and over-expensive for developers and Startups.
With Google Cloud I have experienced some technical issues too, as my older instance froze several times and became irresponsive and I had to do a stop from the web console and I had to wait until the command timed out and Google realised there was a problem so it would consider the instance finally shutdown and I could start it again in other non faulty hardware.
If you are a company with a Load Balancer, with health checks, and several front servers, and 20 developers, you can afford to have Web servers KO, as the Load Balancer will handle it nicely, but if you have a single server with WordPress sites, if the instance stops it means that nobody can access those sites.
As an example of costs, for a Google e2-medium (2 vCPUs, 4 GB of Memory and 20 GB of disk) in us-central1 I pay around 30 € per month. And it happens that the forecast for this month in bandwidth was 300 €.
Also storage is around 1€/month per 10GB for standard. So 200GB of regular space is 20 €/month.
For SSD 1.7€/month per 10GB, even tough provides more IOPS, but not more speed. 200GB of space more is 34 € more per month.
I migrated to a provider were I pay 30 € per month for a 8 vCPU and 24 GB of memory and includes 200 GB of NVMe, and I have unlimited bandwidth. Extra storage is also much more cheap. And the static IP is included (for Google you pay around 1.1€ per month).
The key in here was the unlimited bandwidth.
I also could have rented a dedicated server with 64GB of RAM for around 64 €/month, but these comes with some down sides, like if your server experiences a hardware error, you’ll have to wait for the System Administrators from the Cloud Provider to physically replace the components. With a VPS or instance, I can just launch it in a healthy hardware immediately.
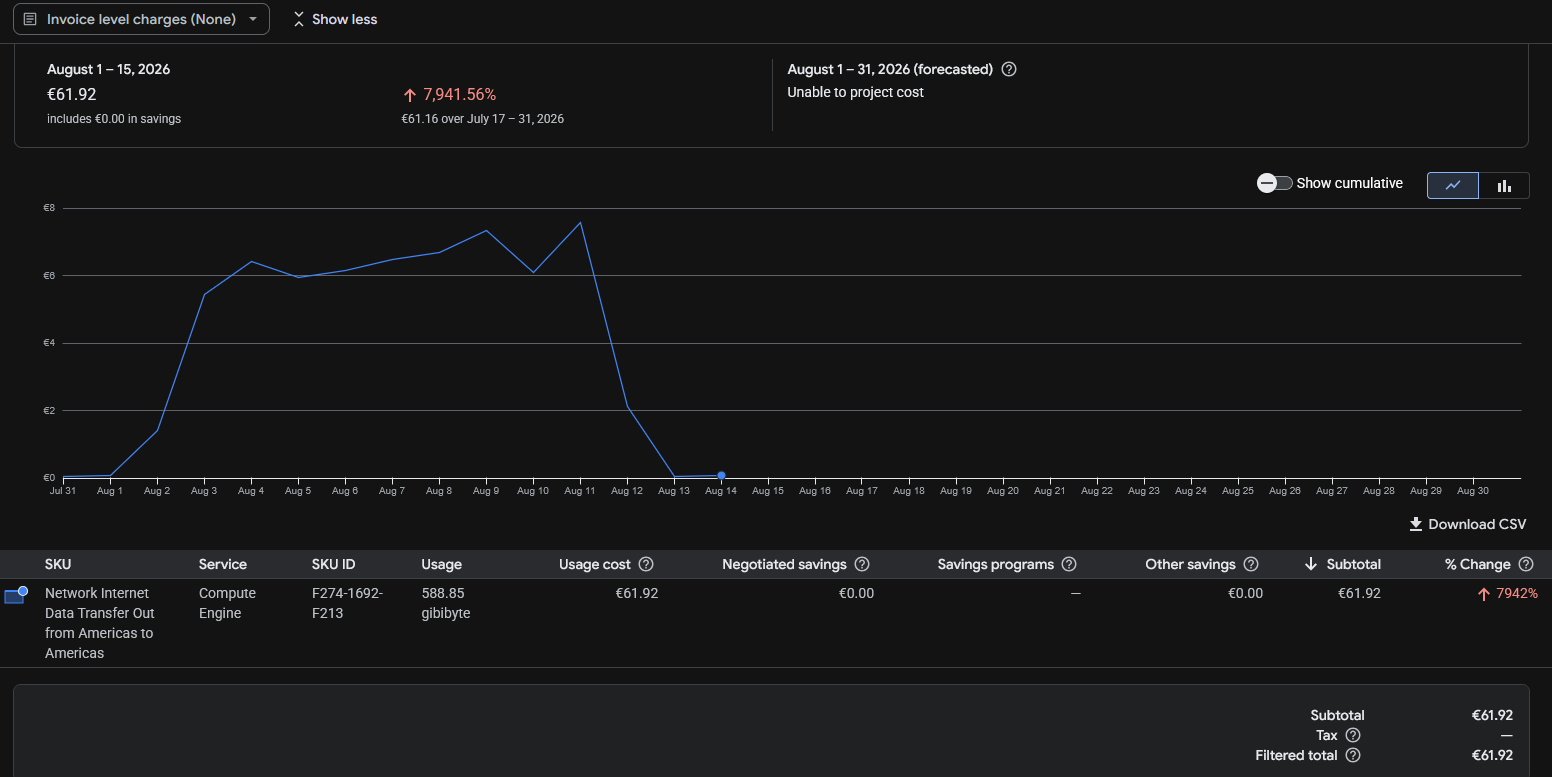
As I was migrating services and investigating the origin of the problems, I saw that 500 GB of data were transferred from us-central1 since the 1st of August.
The Billing Report didn’t allow me to filter for IP. It only helped to know the region, us-central1, which helped me to identify the possible services that could be having the problems.

To be honest, I should have located the origin of the problem quickly, but I did so well blocking bots and uneducated crawlers in the past years, that I had no problems for years, and GCE has mad many changes over time, so I did not remember that I could monitor real time network usage of my servers. Most of the servers I troubleshoot I have only SSH access, so I use network tools.
But as I told previously, I mistakenly thought that just one instance was running in us-central1, and that was not the case. They were in different zones of us-central1.
The live traffic inspection in the server with tools like ss, netstat, nethogs, iftop, iotop and ps revealed normal traffic and load.
A second revision from the nginx logs didn’t reveal any problem over time. And the only opened ports were 80 and 443. With the services I considered potentially more vulnerable (as they used python dependencies) migrated to the new VPS and stopped in the “ubuntu26-04” Google server, the usage shown and the forecast for bandwidth was not reduced and it was the same.
One thing I learned, and I suspected it from my tests with https://sendmeafile.carlesmateo.com/en is that the maximum speed that my instances were able to transfer from Google to Internet (egress) was around 50 Mbps per connection.
I didn’t see this in Google Cloud’s documentation, but in my tests transferring data from Google servers using the public interface and from different locations to this google server I consistently achieved always that top speed of around 50 Mbps per connection (around 6.25 MB/s), but when I communicated Google servers using their private interfaces, the speed for a single connection was much more higher. So I assumed that the bandwidth was capped. After seeing the data transferred in the Billing Cloud Report, it looks clear to me that an important part of the server’s bandwidth max was being used. Later, Apache logs, confirmed me many requests at the same exact second.
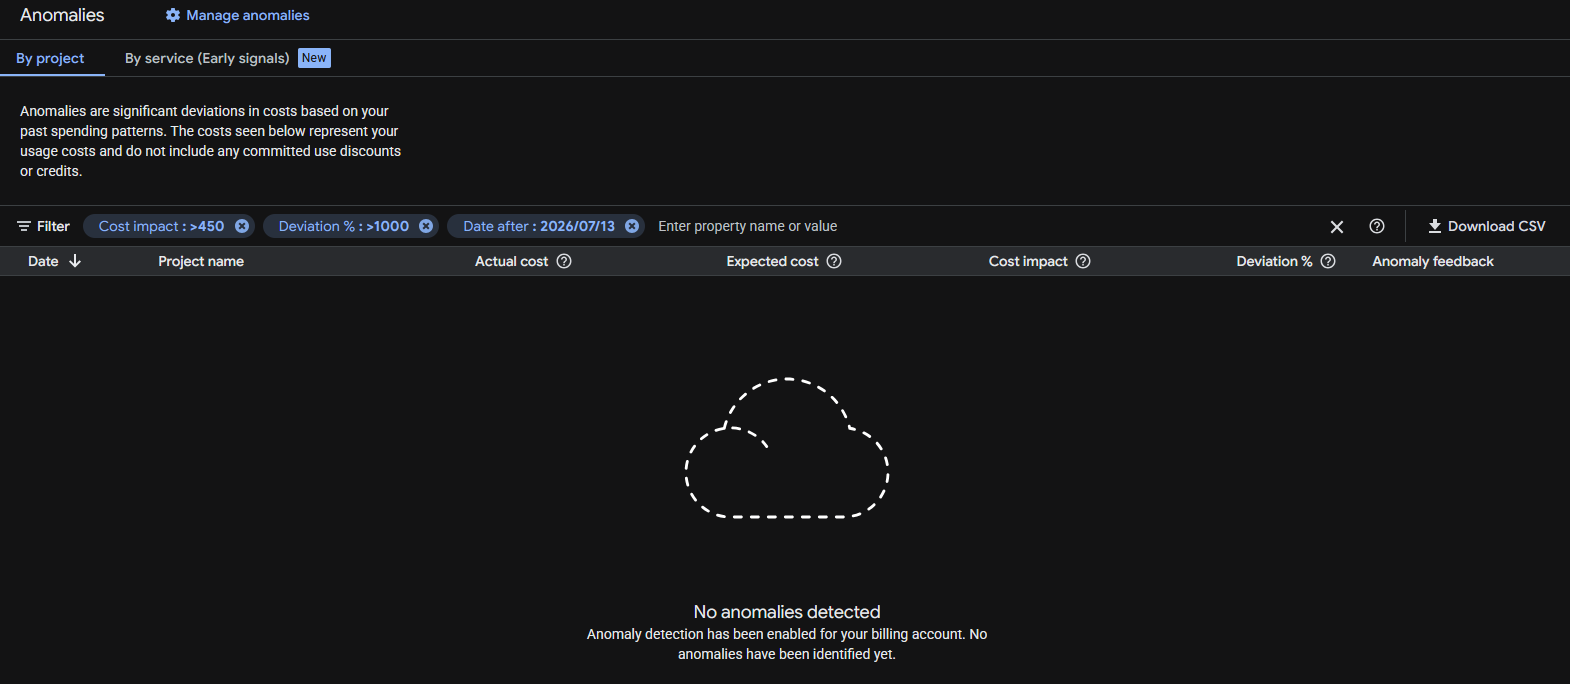
Google anomalies tool detected nothing despite the huge increment in data transfer and cost variation (8,960% respect July!).
Before taking the decision to migrating to another server one has to think, not only in costs, but also on how trustworthy are the storage systems, the resiliency of the systems, how many times they are down per year… there are surprises that you discover as you go. With the experience.
But honestly, I felt it was not worth the price to continue with Google Cloud and it was conditioning the kind of projects I could start. My architecture is resilient, based in containers and I can deploy it fast. I also have backups.
Google storage is not that super trustable in my opinion (neither Amazon’s). Some times my VMs froze and Google monitor dashboard stops drawing the lines of metrics (like CPU usage), but Google doesn’t catch that the VM is frozen. My guess is that the problem is the storage or compute servers dying.
Having to pay per GB transferred in a time where bots and AI index your sites continuously, and abuse the servers by launching many requests concurrently, generating load, and where bots consume much more data than humans, force you to take architecture decisions and to implement strategies.
Possible solutions like using CDN’s like Cloudflare to be protected against DoS, to cache statics and to cut bandwidth and CPU abuse (requests to origin), using other cache systems or migrating to other Cloud providers that are more developer and Start up friendly, and that have unlimited data transfer, etcetera.
When I was presented with the new Google Billing Reports page and the filter was reset to one year, and I saw the price that should be showing multiplied by 10, I contacted Google Cloud by X. They kindly replied and invited me to contact them privately. I did and we opened a ticket. Around three hours later I got an email from a Google staff, telling me that they will investigate the problem, and giving me an expected response deadline of 5 days.
It was nice, but by the time I received the email I already had found and sorted the problem.
I troubleshoot the instance “ubuntu26-04” but the CPU usage was low, and no permanent connections (a sign that could have indicated that was hacked):
That Looked normal
sudo ss -tunp state established
Then I did something that I should have done before, I checked the metrics from all the different instances in Google Cloud Compute, starting from the one I initially guessed was the one suffering the problems. That machine was clear. No high CPU usage. No high bandwidth usage. Nothing.
And then I saw it.
Through VM Instances I narrowed to the one in us-central1 that was consuming the Internet bandwidth, “instance-1”:
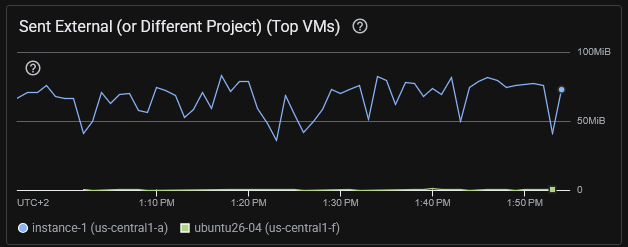
I was checking the wrong server. The consuming excess of egress was from instance-1 that hosted several WordPress sites and it was using Apache2, not nginx.
Some commands I ran:
# Check for the data sent by Apache. This found a lot of traffic. Note: the access.log of all the sites were being analysed
sudo awk '{s+=$10} END {print s/1024/1024/1024 " GB"}' /var/log/apache2/*access.log
# returned 36.4578 GB that's for a day, so something was clearly wrong

# Analyze requests: See what is more heavy. So basically bots trying to hack into the server and some heavy images. Note root home for at least a server is huge (50MB)
sudo awk '{a[$7]+=$10} END {for(u in a) print a[u]/1024/1024" MB\t"u}' /var/log/apache2/*access.log | sort -rn | head -20
54.3218 MB      /
21.6173 MB      /wp-login.php
17.1676 MB      /wp-content/uploads/2022/10/20221001_200930-cut.png
16.5822 MB      /wp-content/uploads/2022/10/20221001_201033.png
10.7245 MB      /wp-content/uploads/2022/02/python_loop.gif
6.61174 MB      /xmlrpc.php
6.60595 MB      /page/2/?shopdetail%2FI37266592159
6.60595 MB      /page/2/?shopdetail%2FI37256267952
6.60595 MB      /page/2/?shopdetail%2FI37256137878
6.60595 MB      /page/2/?shopdetail%2FI37256033568
6.60595 MB      /page/2/?shopdetail%2FI37224959793
6.60595 MB      /page/2/?shopdetail%2FI37214305672
6.60595 MB      /page/2/?shopdetail%2FI37203620584
6.60595 MB      /page/2/?shopdetail%2FE37266925367
6.60595 MB      /page/2/?shopdetail%2FE37242498260
6.60595 MB      /page/2/?shopdetail%2FE37207321261
6.60595 MB      /page/2/?shopdetail%2FA37259909717
6.60595 MB      /page/2/?shopdetail%2FA37259600135
6.60595 MB      /page/2/?shopdetail%2FA37256306882
6.60595 MB      /page/2/?shopdetail%2FA37256197883

# Analyze requests: See what IP's are requesting more traffic in total. Gotcha
sudo awk '{a[$1]+=$10} END {for(i in a) print a[i]/1024/1024" MB\t"i}' /var/log/apache2/*access.log | sort -rn | head -20
34549.2 MB      74.7.241.60
1491.36 MB      116.202.235.23
287.651 MB      3.41.188.33
232.362 MB      74.7.227.160
199.987 MB      18.97.9.169
183.748 MB      66.249.74.42
84.1681 MB      114.119.140.64
78.3209 MB      114.119.149.169
70.5166 MB      114.119.156.46
67.8224 MB      114.119.150.29
66.7544 MB      114.119.145.237
58.7278 MB      114.119.147.113
57.1822 MB      114.119.162.62
56.0061 MB      66.249.74.43
55.3612 MB      114.119.141.79
21.9245 MB      216.73.217.35
21.2516 MB      104.243.44.93
17.7313 MB      79.116.217.181
17.1676 MB      189.81.71.184
16.5822 MB      205.188.63.181
So we see that this IP 74.7.241.60 is requesting 34.5 GB in a day.
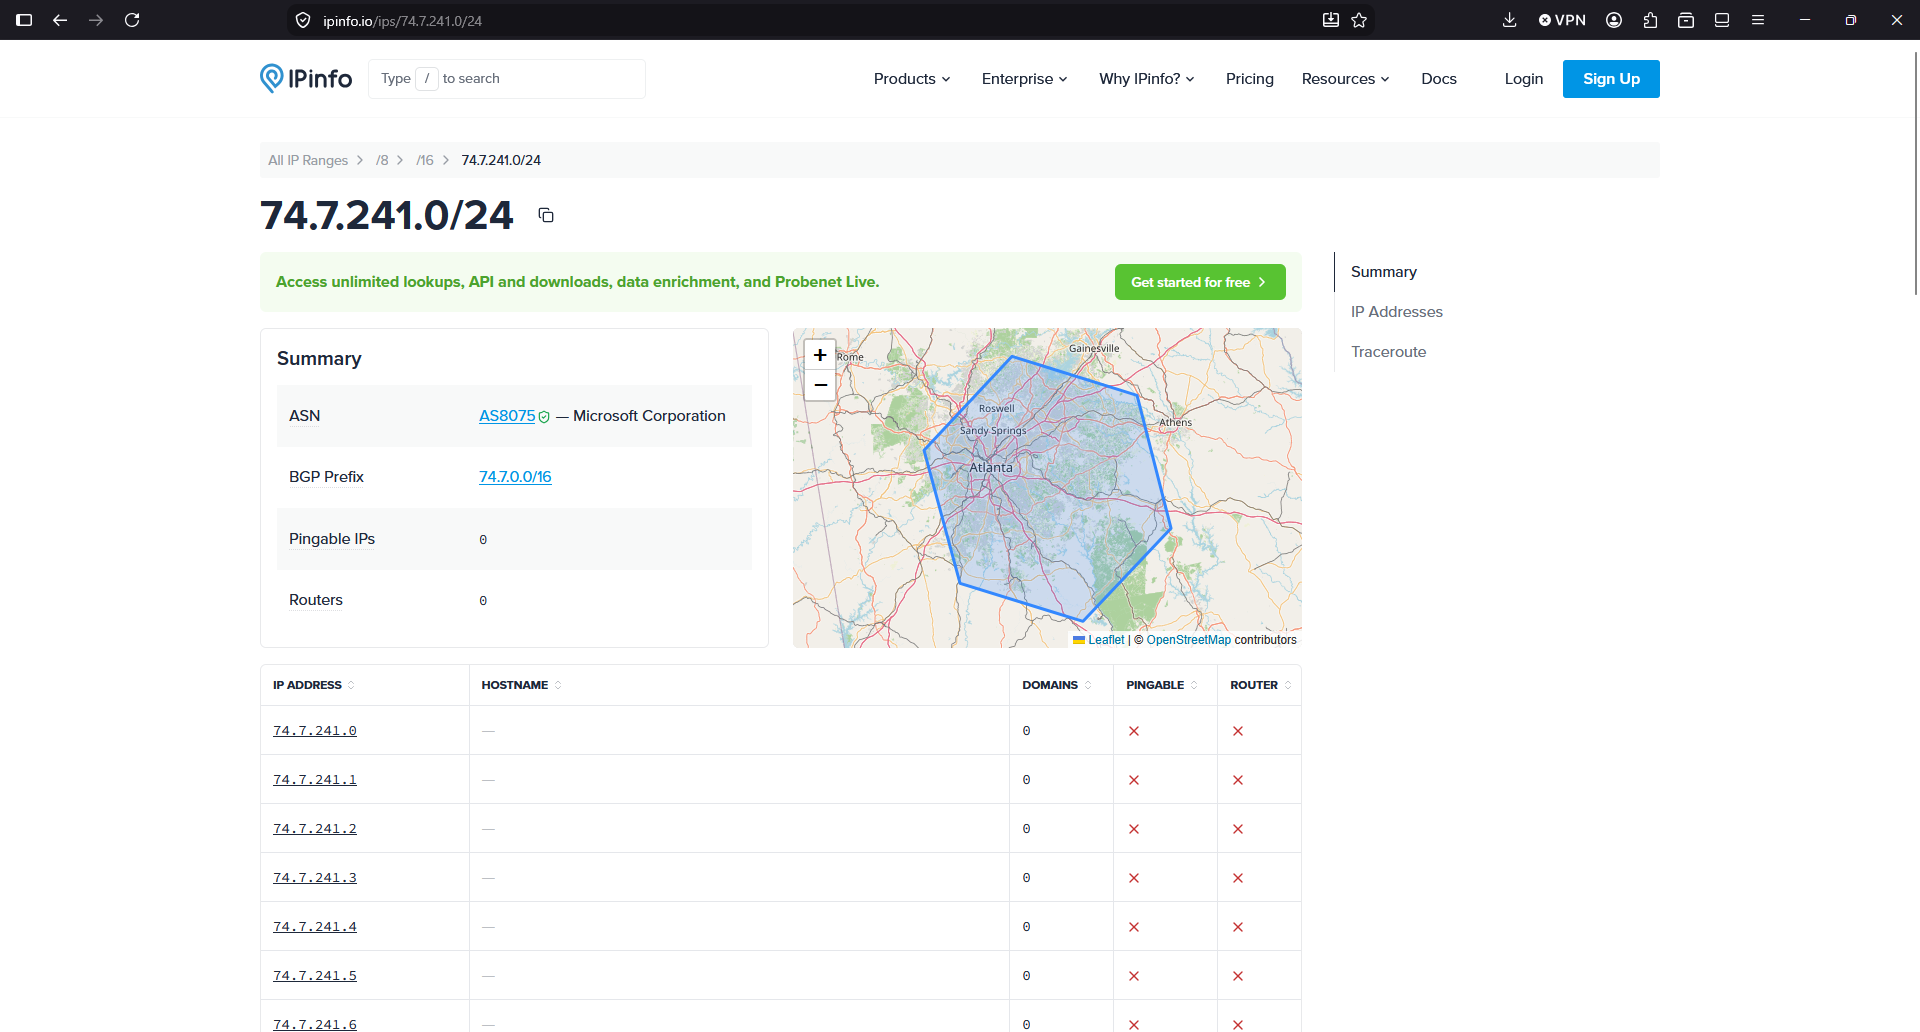
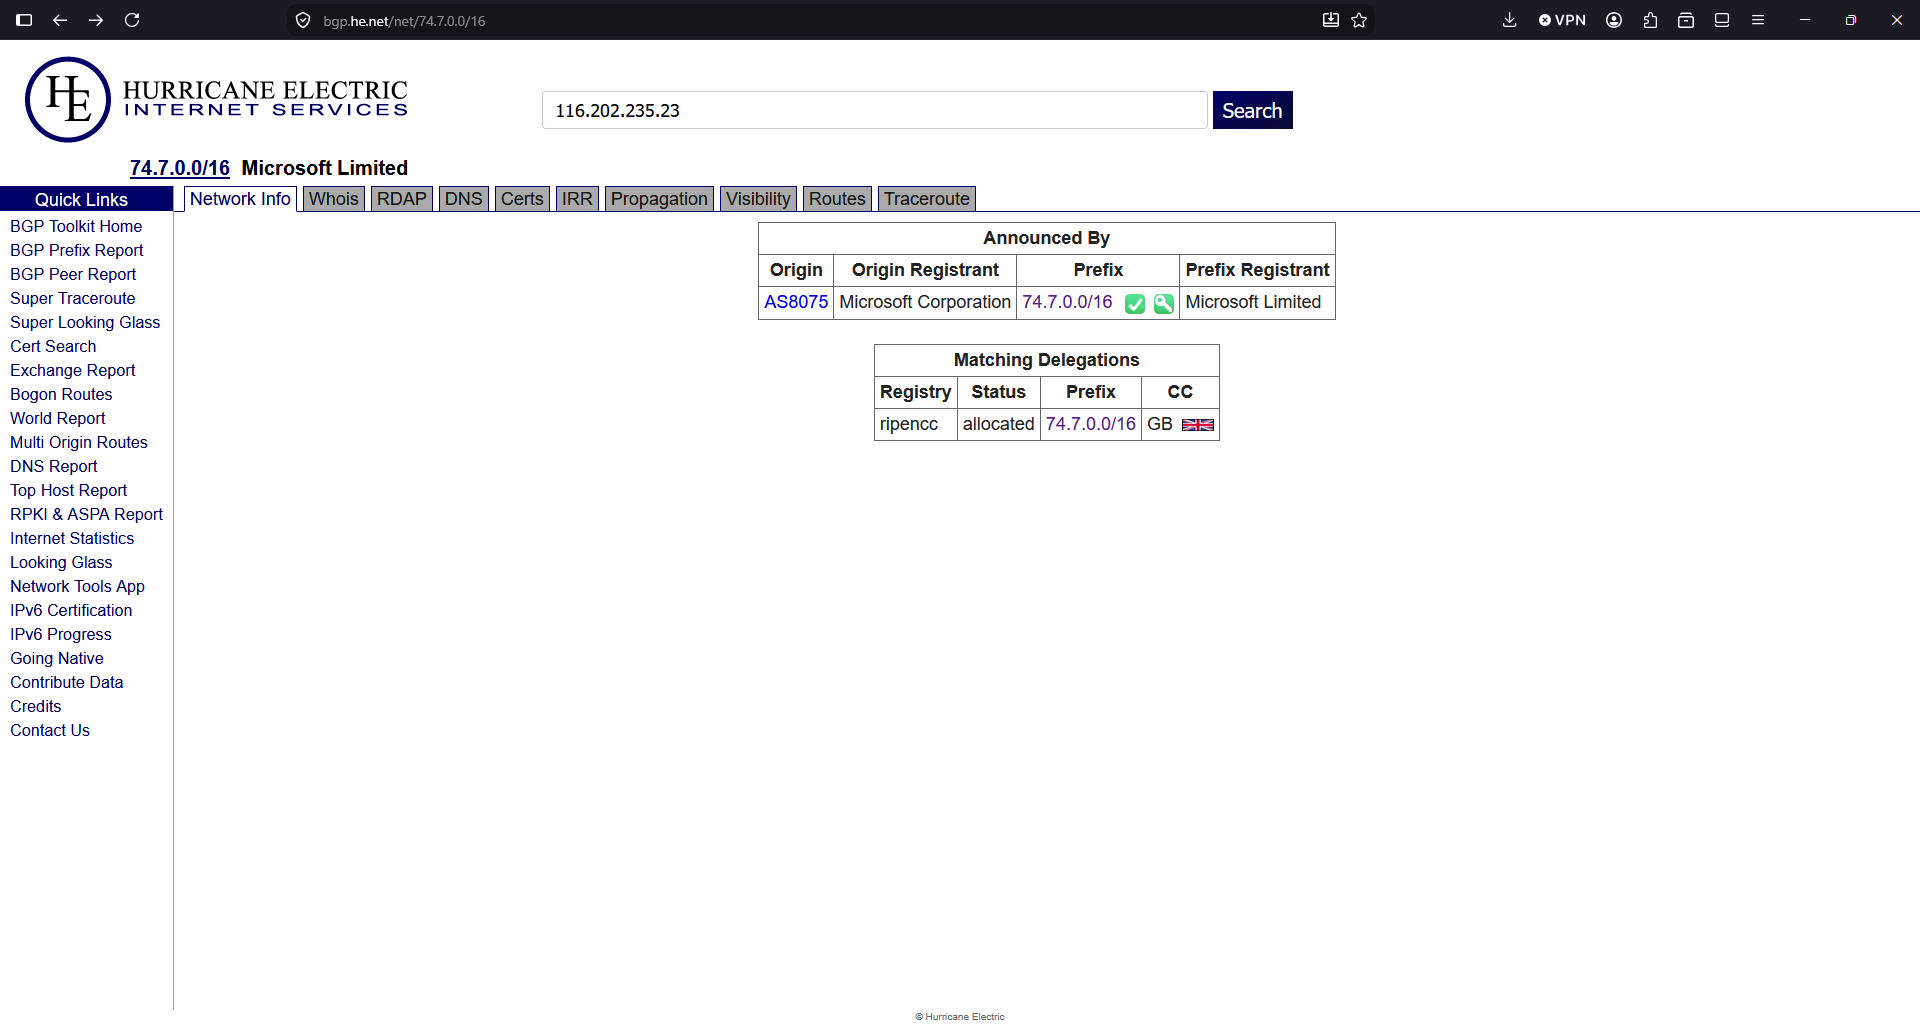
So, according to this IP Info service, the IP is from Microsoft. So apparently, crawlers/IA from Microsoft or running in Microsoft infrastructure, were costing me money because they are abusing, scanning my sites, with many connections concurrently, like horrible soulless machines:
I double checked the IP with another provider:
A command to see a sample of what kind of requests I have from this IP, brings more light:
grep "74.7.241.60" /var/log/apache2/*access.log | head -20
/var/log/apache2/www_mysqlproxycache_com-access.log:74.7.241.60 - - [13/Aug/2026:00:00:22 +0000] "GET /page/2/?shopdetail%2FI37207088742 HTTP/1.1" 200 3463409 "http://www.mysqlproxycache.com/page/2/?shopdetail/I37207088742" "Mozilla/5.0 AppleWebKit/537.36 (KHTML, like Gecko; compatible; GPTBot/1.4; +https://openai.com/gptbot)"
/var/log/apache2/www_mysqlproxycache_com-access.log:74.7.241.60 - - [13/Aug/2026:00:00:34 +0000] "GET /page/3/?shopdetail/I37207088742 HTTP/1.1" 301 264 "http://www.mysqlproxycache.com/page/2/?shopdetail/I37207088742" "Mozilla/5.0 AppleWebKit/537.36 (KHTML, like Gecko; compatible; GPTBot/1.4; +https://openai.com/gptbot)"
/var/log/apache2/www_mysqlproxycache_com-access.log:74.7.241.60 - - [13/Aug/2026:00:00:35 +0000] "GET /page/3/?shopdetail%2FI37207088742 HTTP/1.1" 200 1900262 "http://www.mysqlproxycache.com/page/3/?shopdetail/I37207088742" "Mozilla/5.0 AppleWebKit/537.36 (KHTML, like Gecko; compatible; GPTBot/1.4; +https://openai.com/gptbot)"
/var/log/apache2/www_mysqlproxycache_com-access.log:74.7.241.60 - - [13/Aug/2026:00:00:37 +0000] "GET /page/7/?shopdetail/E37249347969 HTTP/1.1" 301 264 "http://www.mysqlproxycache.com/page/6/?shopdetail/E37249347969" "Mozilla/5.0 AppleWebKit/537.36 (KHTML, like Gecko; compatible; GPTBot/1.4; +https://openai.com/gptbot)"
According to the User-Agent is GPTBot. So apparently a bot running in Microsoft self-identifying as OpenAI were killing causing high usage to my server and to my budget by requesting many pages at the same time, for an old shopdetail page that does not exist in that server (maybe there was a shop years before I got that IP), and spends a lot of bandwidth responding with a heavy page of 6 MB.
In the logs I saw many request at the same precise second.
Asking to Claude it tells me that the range of IPs of the Microsoft attacker IP are not in the publicly published IPs of OpenAI for GPTBot, so apparently somebody using Microsoft IPs is pretending to be a GPT Bot, and it isn’t:

The domain is an old WordPress that has been hacked. Yes, this happens more often that we would like, with WordPress.
I checked the https and it returns a SSL potential warning in the SSL.
I tried with http http://www.mysqlproxycache.com/page/7/?shopdetail%2FI37224744693 (one of the requests in the logs) and I saw that the WordPress site was hacked.
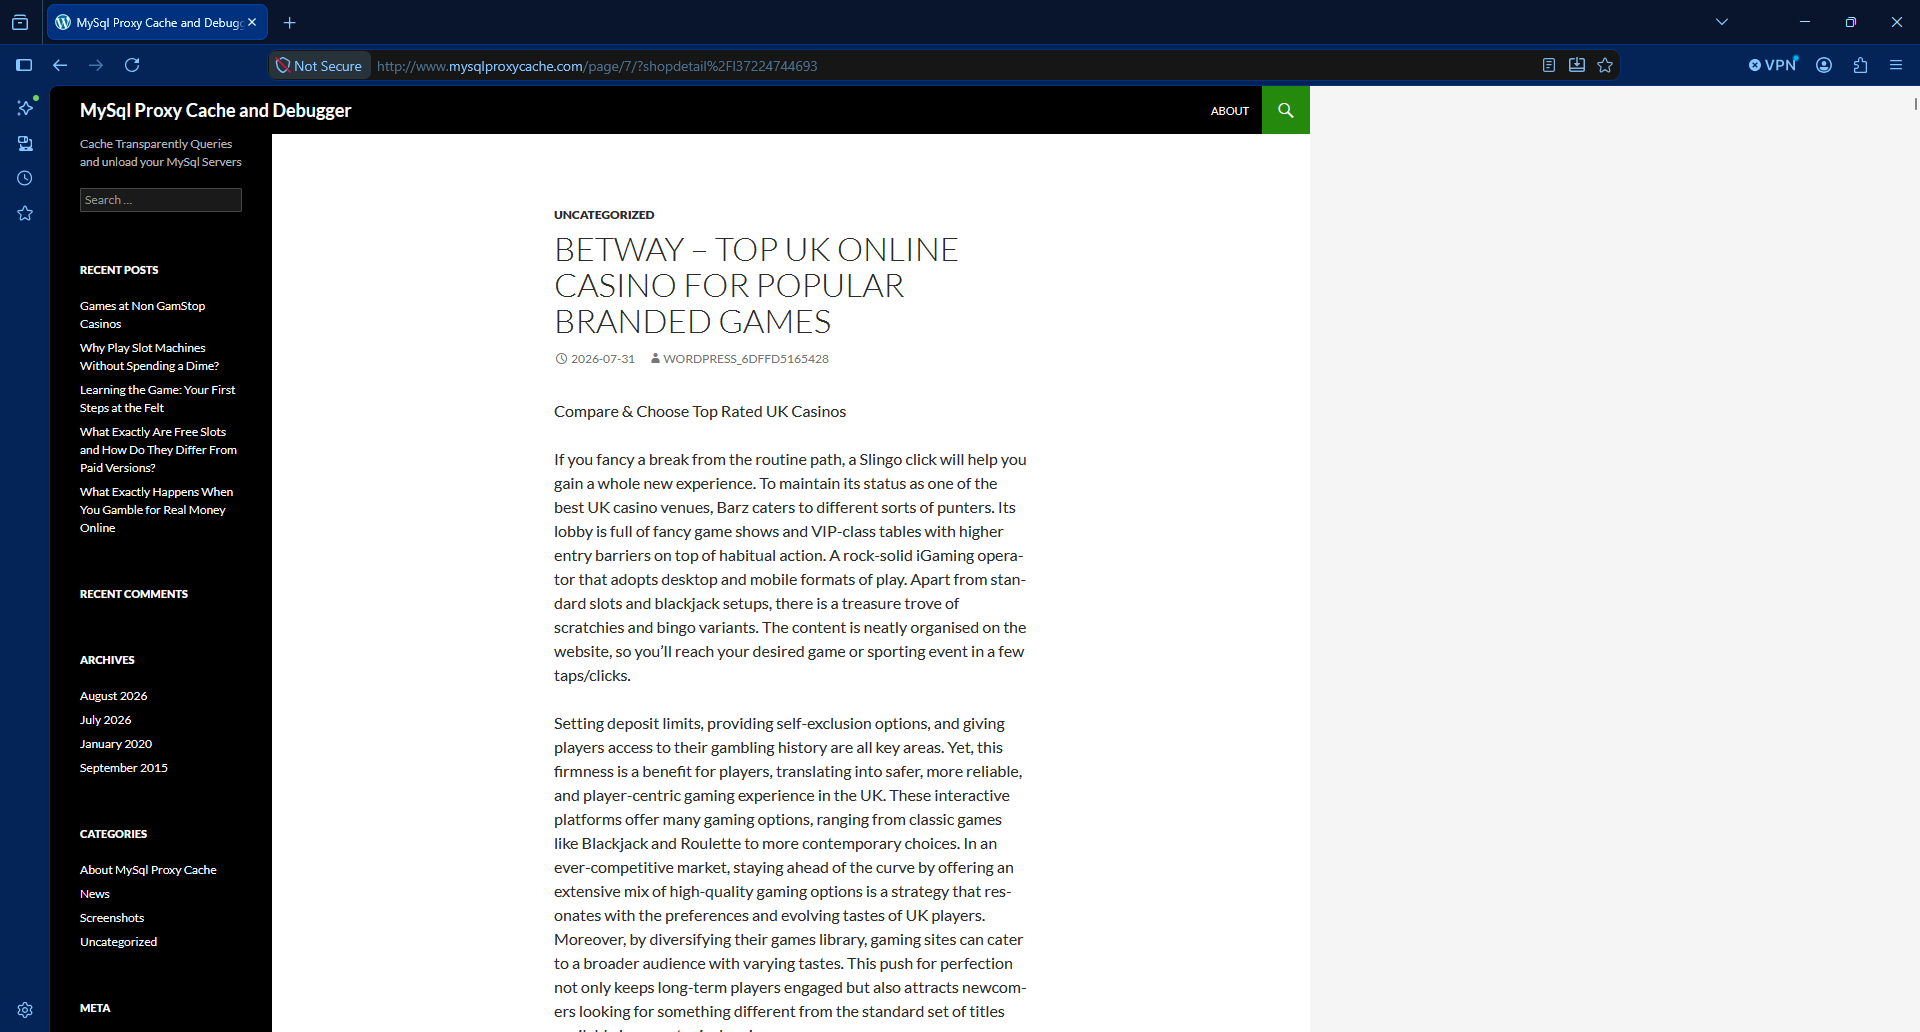
So first things first: I stopped Apache.
sudo service apache2 stop
So, to summarise, there was a bot from a Microsoft IP, that was requesting many times per second pages to a WordPress site that was compromised and it was returning a large article with many photos, so heavy in terms of data usage.
With Apache2 server stopped, I moved the config symbolic link from /etc/apache2/sites-enabled/ to another folder /etc/apache2/sites-disabled/ that I created.
So basically, when I started Apache, the compromised site will not be served. It will be served by the default site.
I restarted the Apache server and checked that the URLs for that domain were catch by default site and no processing resources of bandwidth was used.
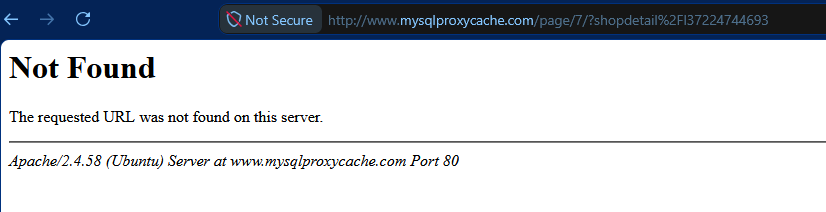
That was to avoid a main site marked as default in the Apache config to attend those requests and waste data.
And then I added to the firewall, to Google Cloud’s Firewall and to the servers in all my instances, to block all the IPs from Microsoft from that range.
I saw that the BGP Prefix is 74.7.0.0/16 so I block all the 65,536 IP Addresses:
ufw insert 1 deny from 74.7.0.0/16 to any
As you can see I inserted this rule on the first position. Don’t just add it with ufw deny from 74.7.0.0/16 to any or otherwise it will go to the last position, after the allow rules. And then it would not be enforced.
Check your rules with:
ufw status numbered
You can block the range in your provider’s Firewall (VPC Firewall in Google Cloud).
If you didn’t have the Ubuntu Firewall active, and want to activate it now, make sure that you have the rules for the SSH connection:
echo "Enabling SSH"
sudo ufw allow 22/tcp

echo "Enabling Web 443 and 80"
#sudo ufw allow "Apache Full"
sudo ufw allow 80/tcp
sudo ufw allow 443/tcp

echo "Enabling Firewall"
sudo ufw enable

echo "Showing rules"
sudo ufw status numbered
I recommend you to add the rules to a script in git (Infrastructure as Code), so you can replay it another day, and to any server you have.
By default, ufw sets deny by default for rules not specified. You can check it with:
sudo ufw status verbose | head
Bots, IA, crawlers abuse our servers nowadays.
Also the automated bots attempting to hack into the servers.
If you just check your logs, you’ll see many attempts to exploit vulnerabilities in your servers, every day.
I checked for the second IP consuming more bandwidth in the list:
116.202.235.23
It’s from hetzner, a Cloud provider. https://bgp.he.net/net/74.7.0.0/16
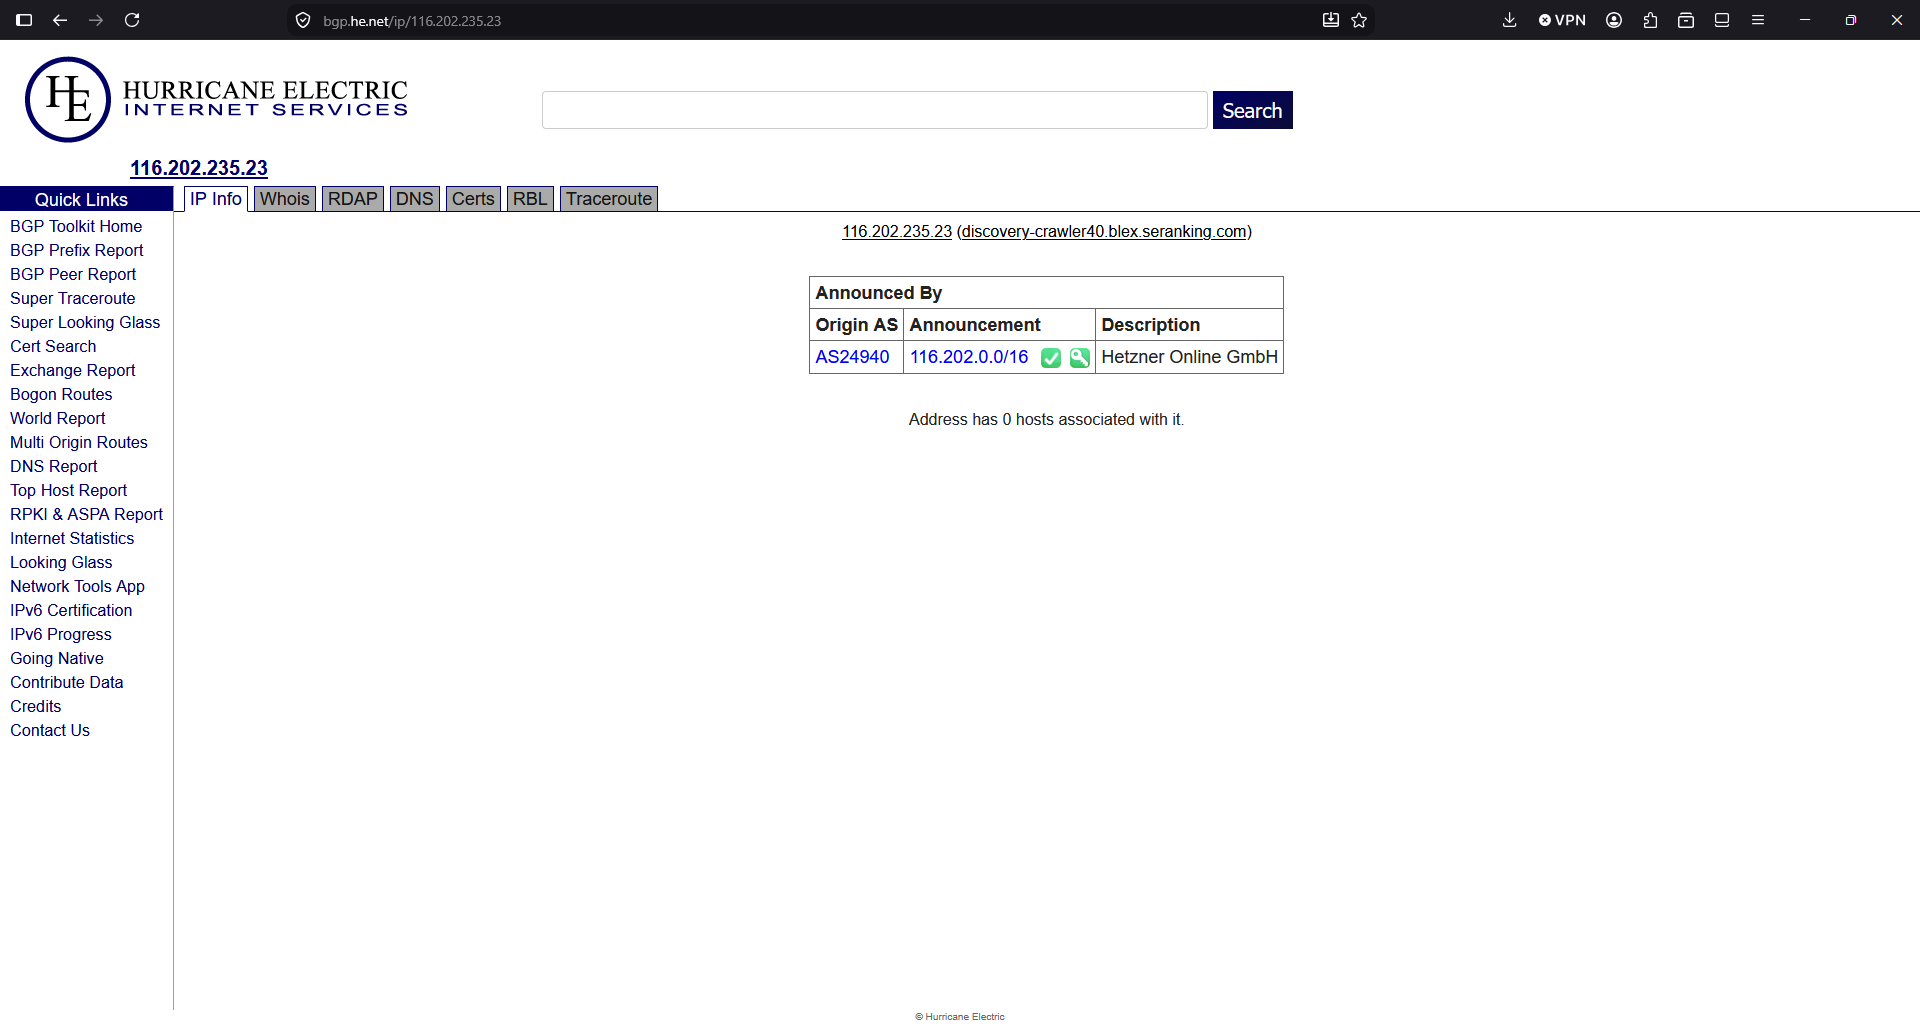
Another 65,536 addresses that get blocked:
# Hetzner
ufw insert 1 deny from 116.202.0.0/16  to any
The third IP will be blocked too, even if I didn’t find any information about who owns the block of IPs.
ufw insert 1 deny from 3.41.188.33 to any
The fourth was part of the same block I blocked first, so it’s already blocked.
The fifth IP, I ask to Google Gemini:
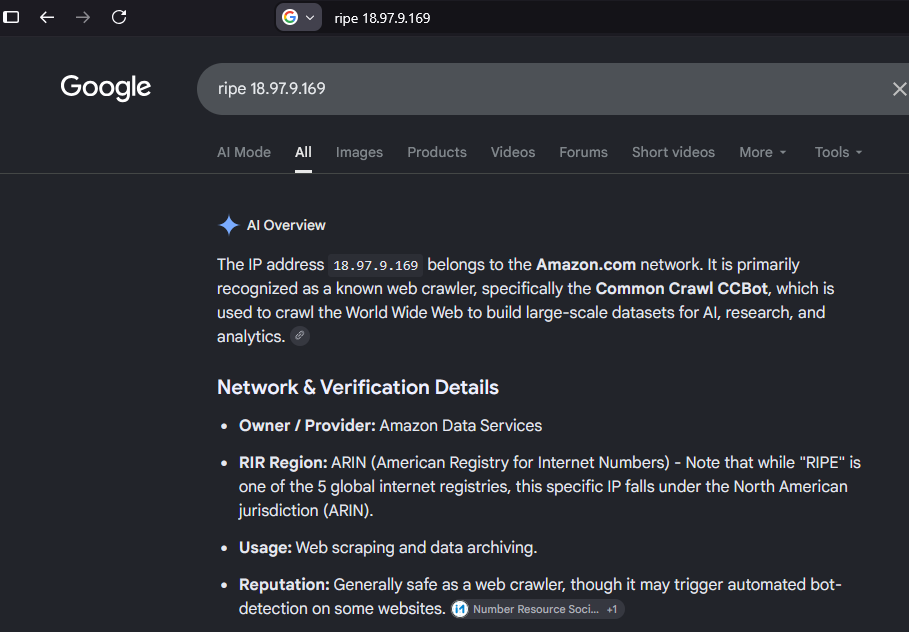
The block is 18.97.9.0/24 but I’ll block all the BGP Prefix, all the 16K addresses.
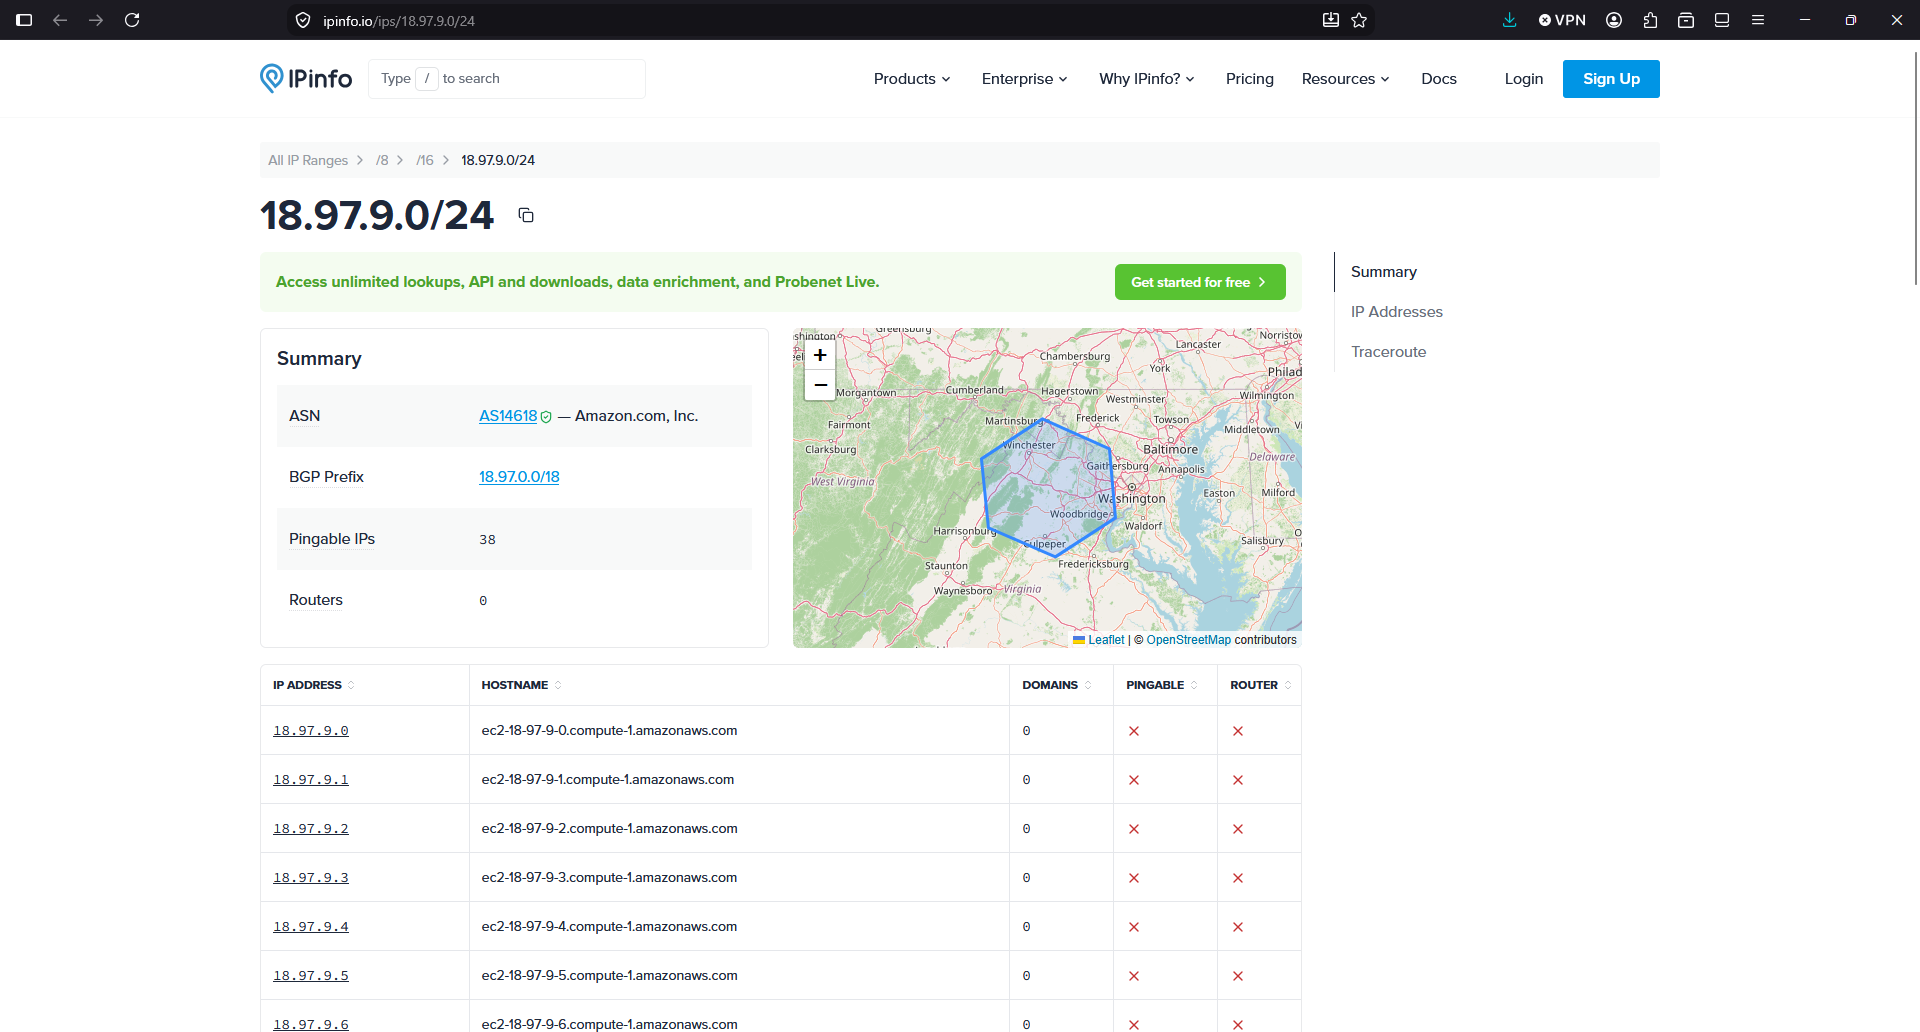
ufw insert 1 deny from 18.97.0.0/18 to any
See what is the traffic from the servers since I blocked the Microsoft range in the Ubuntu Firewall:
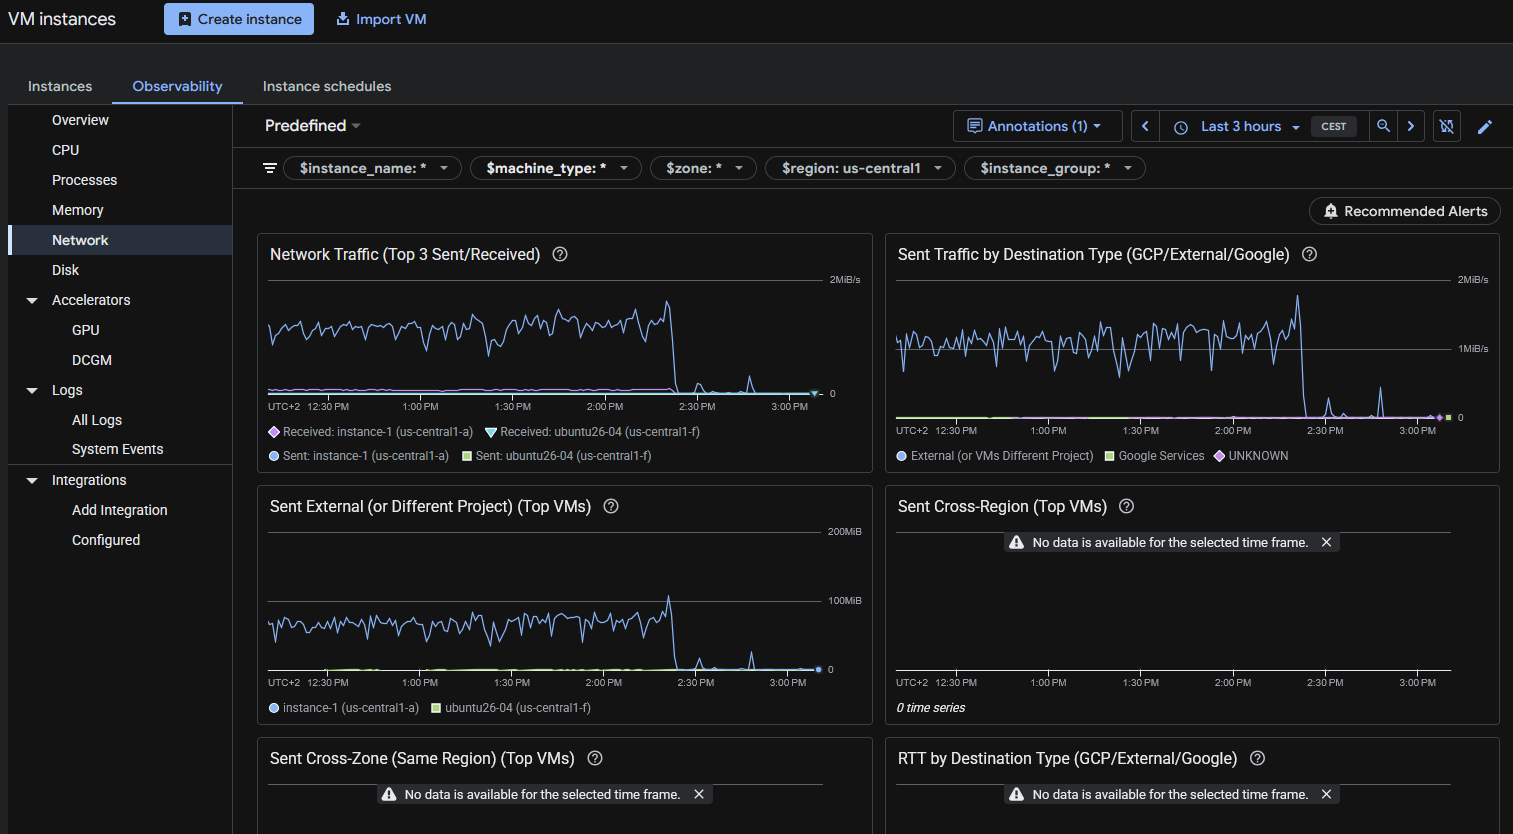
As you can see, after I blocked the first abusive IP allegedly from Microsoft with seemingly OpenAI User-Agent falsified, all the egress traffic went down.
I like how Google reacted when I contacted them. And I should have checked the Network traffic bandwidth first. So I decided to keep the WordPress instance in Google Cloud.
But the new instance “ubuntu26-04” I’m migrating it to the new server. What they offer for the price is much better, and the price of the storage really it’s important for some of my projects. The unlimited bandwidth usage in the new provider it’s also key.
The Billing report from Google Cloud doesn’t show the data up to the moment. But the 16th of August I was able to see that from the 12th and absolutely on 13th and 14th the egress Internet cost have almost disappeared.
Not all is perfect. I had to learn the web interface from that provider (I used it in the past, but companies change the user interface very often nowadays, causing headaches to users), the place were my VPS was listed was hidden and difficult to find, and by default the VPS had no firewall enabled. Something that I believe that is basic to have enabled by default.
But I think it will be great for my projects and for my budget, to have all those new resources available (8 vCPU and 24 GB of RAM and 200 GB of NVMe disk for the same cost provided in Google Cloud of 2 vCPU and 4 GB of RAM and 20 GB of standard disk).
In fact, the speed I have detected transferring from/to sendmeafile with the new provider shows a great improvement.
Take one thing in mind: They AI is hungry for contents, and the mega-rich AI providers are making you pay the bill, by scanning your sites non-stop.
The new provider says it provides 3 Gbps of bandwidth for the instance, with no data usage limits (not having to pay for GB transferred). If I had not reacted fast, the forecast for this month with Google for just a single instance was 300€. It is a risk for developers and small companies, to have the possibility to face a huge bill because more frequent every day bots/crawlers/AIs and processes attempting to breach in your servers, cause your server to use a lot of egress data. So it is worth considering using a Cloud Provider with unlimited data plan. Or at least, activate the Billing Alerts to be notified if your costs exceed a certain threshold.
If you have problems with abusive bots degrading your Drupal or WordPress performance, I created a commercial WordPress plugin and a commercial Drupal module that automatically and easily record and block offending IP Addresses.