Tag Archives: top

Web Top – Displaying top with Python 3 Web Server and Carleslibs

So this is a super simple example on how quickly you can create nice solutions with my package carleslibs.

In this example I use Python 3 incorporated Web Server and carleslibs, to execute top and display in the browser.

Requisites:

Having Python3 and have installed carleslibs 1.0.1 or superior.

pip3 install carleslibs

Having this running in a Linux with top installed. All of them come with top, as long as I know.

This is the 84 lines code for WebTop:

from http.server import BaseHTTPRequestHandler, HTTPServer

from carleslibs.subprocessutils import SubProcessUtils
from carleslibs.datetimeutils import DateTimeUtils


class Top():

    def __init__(self, o_subprocess):
        self.o_subprocess = o_subprocess

    def get_top(self):

        a_domains_offline = []

        s_command = "/usr/bin/top -n 1 -b"
        i_code, s_stdout, s_stderr = self.o_subprocess.execute_command_for_output(s_command, b_shell=True, b_convert_to_ascii=True)

        return i_code, s_stdout, s_stderr


class WebServer(BaseHTTPRequestHandler):

    def do_GET(self):
        o_subprocess = SubProcessUtils()
        self.o_top = Top(o_subprocess)

        self.o_datetime = DateTimeUtils()

        self.i_max_domains_offline = 0

        self.send_response(200)
        self.send_header("Content-type", "text/html")
        self.end_headers()

        WebTop.log(self.path)
        if self.path == "/favicon.ico":
            return

        s_html = "<html><body>"
        s_html = s_html + "<h1>Web Top</h1>"
        s_html = s_html + '<small>by Carles Mateo - <a href="https://blog.carlesmateo.com">blog.carlesmateo.com</a></small>'

        i_code, s_stdout, s_stderr = self.o_top.get_top()

        if i_code != 0:
            s_html = s_html + "Error Code: " + str(i_code) + "&lt;/br&gt;"
            s_html = s_html + "Message: " + s_stderr + "&lt;/br&gt;"
        else:
            s_html = s_html + "<pre>"
            s_html = s_html + s_stdout
            s_html = s_html + "</pre>"

        s_html = s_html + "</body>"
        s_html = s_html + "</html>"

        by_html = bytes(s_html, encoding="utf-8")

        self.wfile.write(by_html)


class WebTop():

    o_datetime = DateTimeUtils()

    @staticmethod
    def log(s_text):
        s_datetime = WebTop.o_datetime.get_datetime()
        print(s_datetime, s_text)


if __name__ == "__main__":

    o_webserver = HTTPServer(("localhost", 80), WebServer)
    WebTop.log("Server started")

    try:
        o_webserver.serve_forever()
    except KeyboardInterrupt:
        pass

    o_webserver.server_close()
    WebTop.log("Server stopped")

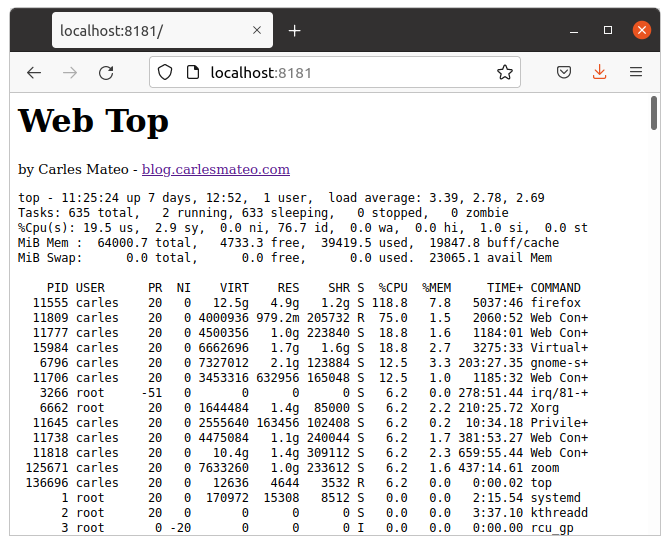
Just run the code and go to localhost with your favorite browser.

If you get an error like this it means that another process is listening on port 80. Just use another like 8080, 8181, etc…

Traceback (most recent call last):
  File "/home/carles/Desktop/code/carles/json-realm-live/web_top.py", line 74, in <module>
    o_webserver = HTTPServer(("localhost", 80), WebServer)
  File "/usr/lib/python3.8/socketserver.py", line 452, in __init__
    self.server_bind()
  File "/usr/lib/python3.8/http/server.py", line 138, in server_bind
    socketserver.TCPServer.server_bind(self)
  File "/usr/lib/python3.8/socketserver.py", line 466, in server_bind
    self.socket.bind(self.server_address)
PermissionError: [Errno 13] Permission denied

And you will see the requests coming:

2021-10-09 10:47:46 Server started
127.0.0.1 - - [13/Oct/2021 10:47:48] "GET / HTTP/1.1" 200 -
2021-10-09 10:47:48 /
127.0.0.1 - - [13/Oct/2021 11:25:24] "GET / HTTP/1.1" 200 -
2021-10-09 11:25:24 /

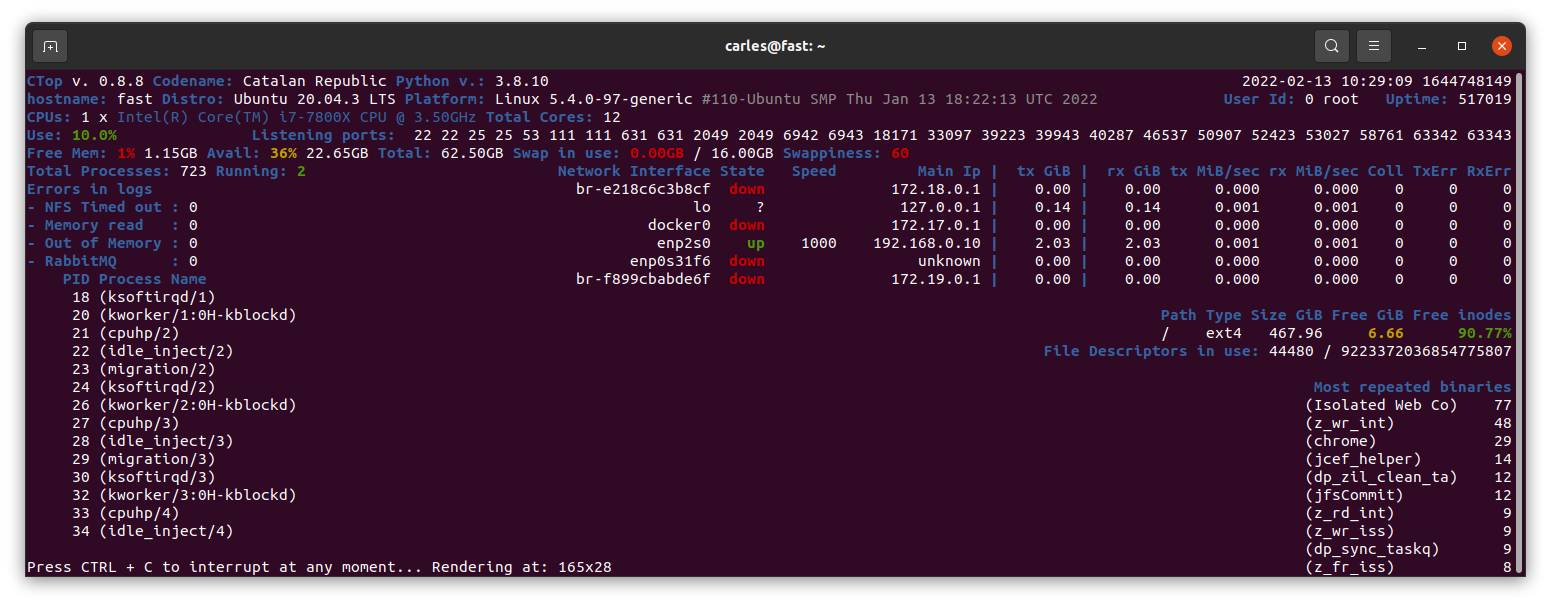
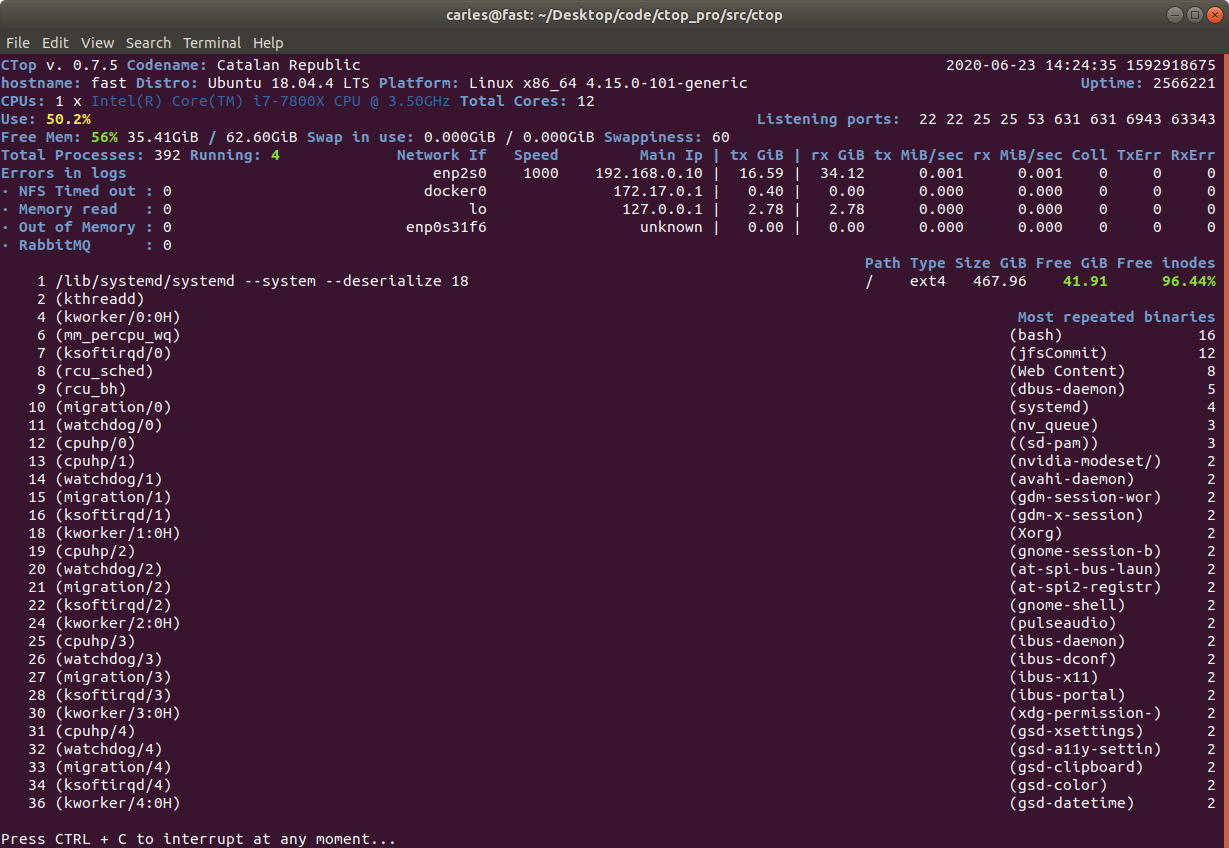
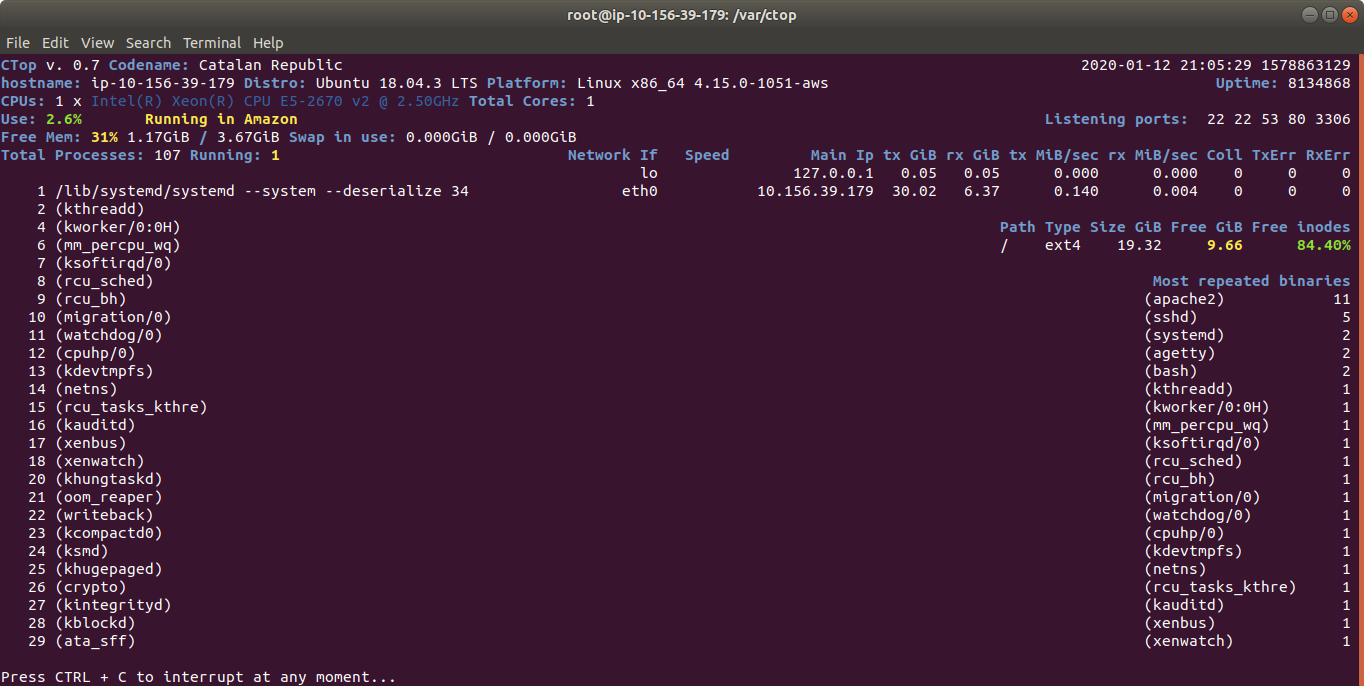
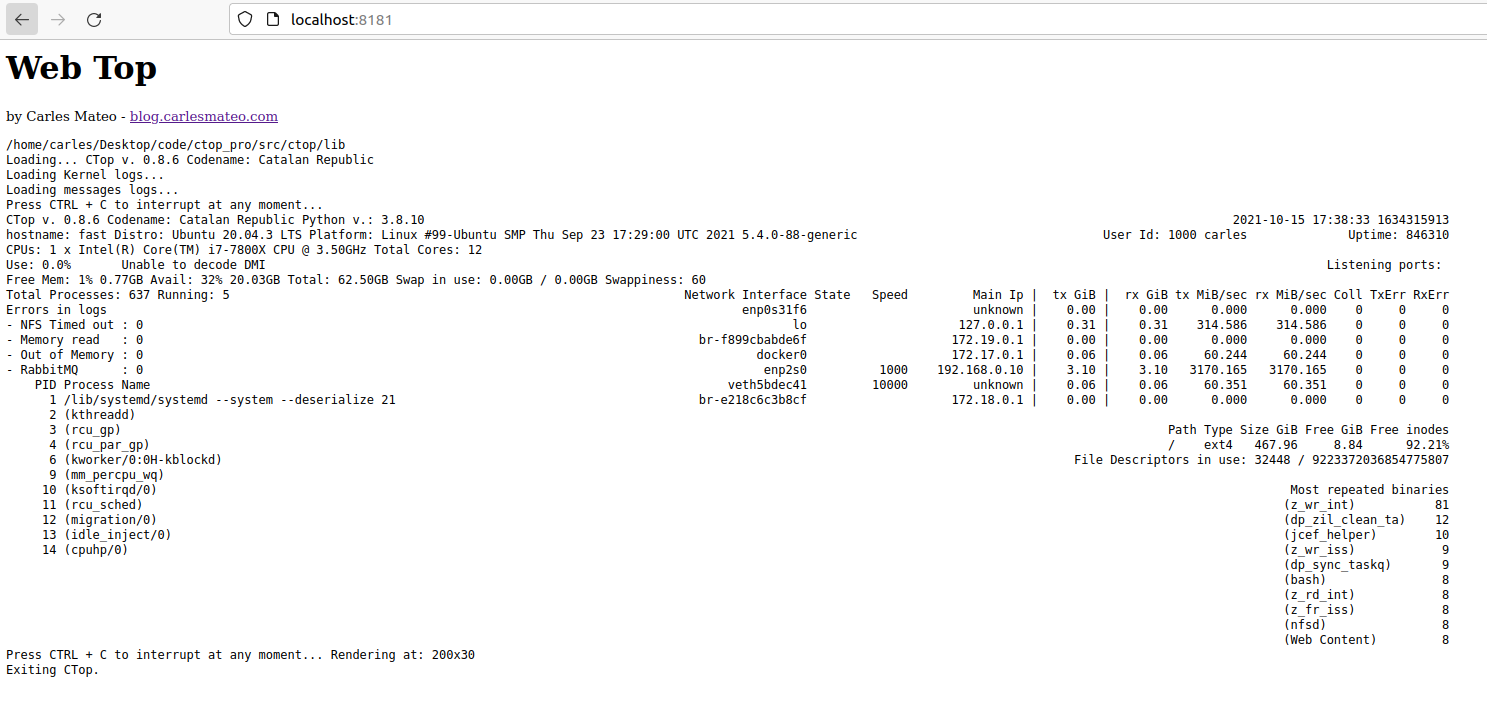
So instead of using top, you can use ctop.py :)

Just replace the command by:

s_command = "ctop.py -b -n=1 --rows=30 --columns=200"

You can also create a Dockerfile very easily and run this in a Container.

CTOP.py

For updated information visit the main page for CTOP.py

Current stable version is v.0.8.9 updated on 2022-07-03.

Current branch under development is v.0.8.10 updated on 2022-07-03.

Version 0.8.0 added compatibility with Python 2, for older Systems.

Find the source code in: https://gitlab.com/carles.mateo/ctop

Clone it with:

git clone https://gitlab.com/carles.mateo/ctop.git

ctop.py is an Open Source tool for Linux System Administration that I’ve written in Python3. It uses only the System (/proc), and not third party libraries, in order to get all the information required.
I use only this modules, so it’s ideal to run in all the farm of Servers and Dockers:

  • os
  • sys
  • time
  • shutil (for getting the Terminal width and height)

The purpose of this tool is to help to troubleshot and to identify problems with a single view to a single tool that has all the typical indicators.

It provides in a single view information that is typically provided by many programs:

  • top, htop for the CPU usage, process list, memory usage
  • meminfo
  • cpuinfo
  • hostname
  • uptime
  • df to see the free space in / and the free inodes
  • iftop to see real-time bandwidth usage
  • ip addr list to see the main Ip for the interfaces
  • netstat or lsof to see the list of listening TCP Ports
  • uname -a to see the Kernel version

Other cool things it does is:

  • Identifying if you’re inside an Amazon VM, Google GCP, OpenStack VMs, Virtual Box VMs, Docker Containers or lxc.
  • Compatible with Raspberry Pi (tested on 3 and 4, on Raspbian and Ubuntu 20.04LTS)
  • Uses colors, and marks in yellow the warnings and in red the errors, problems like few disk space reaming or high CPU usage according to the available cores and CPUs.
  • Redraws the screen and adjust to the size of the Terminal, bigger terminal displays more information
  • It doesn’t use external libraries, and does not escape to shell. It reads everything from /proc /sys or /etc files.
  • Identifies the Linux distribution
  • Supports Plugins loaded on demand.
  • Shows the most repeated binaries, so you can identify DDoS attacks (like having 5,000 apache instances where you have normally 500 or many instances of Python)
  • Indicates if an interface has the cable connected or disconnected
  • Shows the Speed of the Network Connection (useful for Mellanox cards than can operate and 200Gbit/sec, 100, 50, 40, 25, 10…)
  • It displays the local time and the Linux Epoch Time, which is universal (very useful for logs and to detect when there was an issue, for example if your system restarted, your SSH Session would keep latest Epoch captured)
  • No root required
  • Displays recent errors like NFS Timed outs or Memory Read Errors.
  • You can enforce the output to be in a determined number of columns and rows, for data scrapping.
  • You can specify the number of loops (1 for scrapping, by default is infinite)
  • You can specify the time between screen refreshes, for long placed SSH sessions
  • You can specify to see the output in b/w or in color (default)

Plugins allow you to extend the functionality effortlessly, without having to learn all the code. I provide a Plugin sample for starting lights on a Raspberry Pi, depending on the CPU Load, and playing a message “The system is healthy” or “Warning. The CPU is at 80%”.

Limitations:

  • It only works for Linux, not for Mac or for Windows. Although the idea is to help with Server’s Linux Administration and Troubleshot, and Mac and Windows do not have /proc
  • The list of process of the System is read every 30 seconds, to avoid adding much overhead on the System, other info every second
  • It does not run in Python 2.x, requires Python 3 (tested on 3.5, 3.6, 3.7, 3.8, 3.9)

I decided to code name the version 0.7 as “Catalan Republic” to support the dreams and hopes and democratic requests of the Catalan people, to become and independent republic.

I created this tool as Open Source and if you want to help I need people to test under different versions of:

  • Atypical Linux distributions

If you are a Cloud Provider and want me to implement the detection of your VMs, so the tool knows that is a instance of the Amazon, Google, Azure, Cloudsigma, Digital Ocean… contact me through my LinkedIn.

Monitoring an Amazon Instance, take a look at the amount of traffic sent and received

Some of the features I’m working on are parsing the logs checking for errors, kernel panics, processed killed due to lack of memory, iscsi disconnects, nfs errors, checking the logs of mysql and Oracle databases to locate errors

Dropping caches in Linux, to check if memory is actually being used

I encountered that Server, Xeon, 128 GB of RAM, with those 58 Spinning drives 10 TB and 2 SSD of 2 TB each, where I was testing the latest version of my Software.

Monitoring long term tests, data validation, checking for memory leaks…
I notice the Server is using 70 GB of RAM. Only 5.5 GB are used for buffers according to the usual tools (top, htop, free, cat /proc/meminfo, ps aux…) and no programs are eating that amount, so where is the RAM?.
The rest of the Servers are working well, including models: same mode, 4U60 with 64 GB of RAM, 4U90 with 128 GB and All-Flash-Array with 256 GB of RAM, only using around 8 GB of RAM even under load.
iSCSI sharings being used, with I/O, iSCSI initiators trying to connect and getting rejected, several requests for second, disk pulling, and that usual stuff. And this is the only unit using so many memory, so what?.
I checked some modules to see memory consumption, but nothing clear.
Ok, after a bit of investigation one member of the Team said “Oh, while you was on holidays we created a Ramdisk and filled it for some validations, we deleted that already but never rebooted the Server”.
Ok. The easy solution would be to reboot, but that would had hidden a memory leak it that was the cause.
No, I had to find the real cause.

I requested assistance of one my colleagues, specialist, Kernel Engineer.
He confirmed that processes were not taking that memory, and ask me to try to drop the cache.

So I did:

sync
echo 3 > /proc/sys/vm/drop_caches

Then the memory usage drop to 11.4 GB and kept like that while I maintain sustained the load.

That’s more normal taking in count that we have 16 Volumes shared and one host is attempting to connect to Volumes that do not exist any more like crazy, Services and Cronjobs run in background and we conduct tests degrading the pool, removing drives, etc..

After tests concluded memory dropped to 2 GB, which is what we use when we’re not under load.

Note: In order to know about the memory being used by Kernel slab cache in real time you can use command:

 slabtop

You can also check:

sudo vmstat -m