My Team in The States report an issue with a Red Hat iSCSI Initiator having issues connecting to a Volume exported by a ZFS Server.
There is an issue on GitLab.
As I always do when I troubleshot a problem, I create a forensics post-mortem document recording everything I do, so later, others can learn how I fix it, or they can learn the steps I did in order to troubleshoot.
Please note: Some Ip addresses have been manually edited.
2019-08-09 10:20:10 Start of the investigation
I log into the Server, with Ip Address: xxx.yyy.16.30. Is an All-Flash-Array Server with RHEL6.10 and DRAID v.08091350.
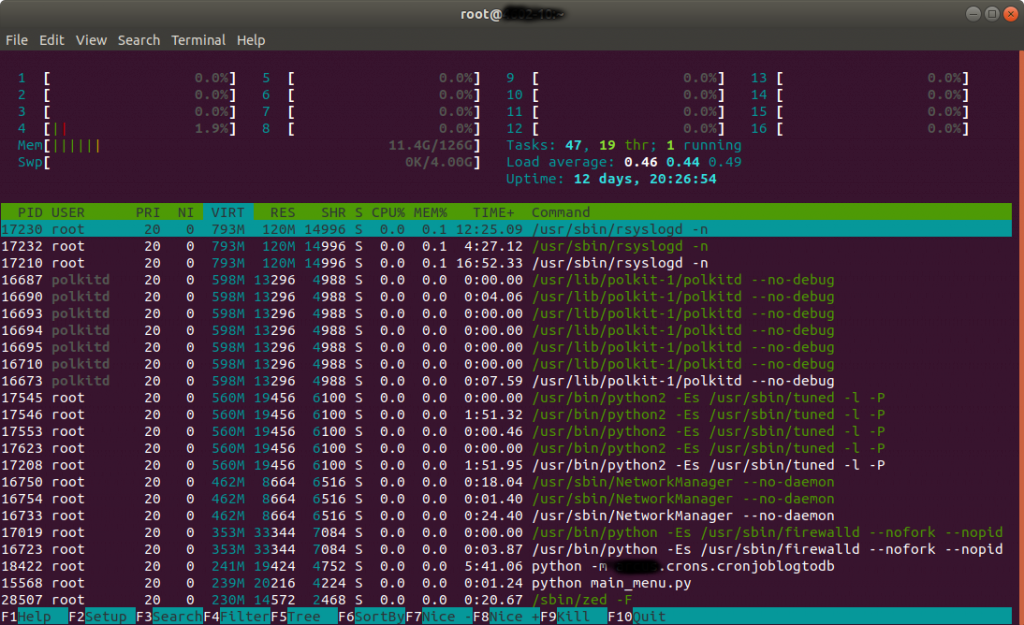
Htop shows normal/low activity.
I check the addresses in the iSCSI Initiator (client), to make sure it is connecting to the right Server.
[root@Host-164 ~]# ip addr list
1: lo: <LOOPBACK,UP,LOWER_UP> mtu 65536 qdisc noqueue state UNKNOWN qlen 1
    link/loopback 00:00:00:00:00:00 brd 00:00:00:00:00:00
    inet 127.0.0.1/8 scope host lo
    valid_lft forever preferred_lft forever
    inet6 ::1/128 scope host
    valid_lft forever preferred_lft forever
2: eno1: <BROADCAST,MULTICAST,UP,LOWER_UP> mtu 1500 qdisc mq state UP qlen 1000
    link/ether 00:25:90:c5:1e:ea brd ff:ff:ff:ff:ff:ff
    inet xxx.yyy.13.164/16 brd xxx.yyy.255.255 scope global eno1
    valid_lft forever preferred_lft forever
    inet6 fe80::225:90ff:fec5:1eea/64 scope link
    valid_lft forever preferred_lft forever
3: eno2: <NO-CARRIER,BROADCAST,MULTICAST,UP> mtu 1500 qdisc mq state DOWN qlen 1000
    link/ether 00:25:90:c5:1e:eb brd ff:ff:ff:ff:ff:ff
4: enp3s0f0: <BROADCAST,MULTICAST,UP,LOWER_UP> mtu 1500 qdisc mq state UP qlen 1000
    link/ether 24:8a:07:a4:94:9c brd ff:ff:ff:ff:ff:ff
    inet 192.168.100.164/24 brd 192.168.100.255 scope global enp3s0f0
    valid_lft forever preferred_lft forever
    inet6 fe80::268a:7ff:fea4:949c/64 scope link
    valid_lft forever preferred_lft forever
5: enp3s0f1: <BROADCAST,MULTICAST,UP,LOWER_UP> mtu 1500 qdisc mq state UP qlen 1000
    link/ether 24:8a:07:a4:94:9d brd ff:ff:ff:ff:ff:ff
    inet 192.168.200.164/24 brd 192.168.200.255 scope global enp3s0f1
    valid_lft forever preferred_lft forever inet6 fe80::268a:7ff:fea4:949d/64 scope link
    valid_lft forever preferred_lft forever
I see the luns on the host, connecting to the 10Gbps of the Server:
[root@Host-164 ~]# iscsiadm -m session
 tcp: [10] 192.168.100.30:3260,1 iqn.2003-01.org.linux-iscsi:vol4 (non-flash)
 tcp: [11] 192.168.100.30:3260,1 iqn.2003-01.org.linux-iscsi:vol5 (non-flash)
 tcp: [7] 192.168.100.30:3260,1 iqn.2003-01.org.linux-iscsi:vol1 (non-flash)
 tcp: [8] 192.168.100.30:3260,1 iqn.2003-01.org.linux-iscsi:vol2 (non-flash)
 tcp: [9] 192.168.100.30:3260,1 iqn.2003-01.org.linux-iscsi:vol3 (non-flash)
Finding the misteries…
Executing cat /proc/partitions is a bit strange respect mount:
[root@Host-164 ~]# cat /proc/partitions
 major minor #blocks name
 8  0 125034840 sda
 8  1 512000 sda1
 8  2 124521472 sda2
 253 0 12505088 dm-0
 253 1 112013312 dm-1
 8 32 104857600 sdc
 8 16 104857600 sdb
 8 48 104857600 sdd
 8 64 104857600 sde
 8 80 104857600 sdf
As mount has this:
/dev/sdg1 on /mnt/large type ext4 (ro,relatime,seclabel,data=ordered)
Lsblk shows that /dev/sdg is not present:
[root@Host-164 ~]# lsblk
 NAME
 MAJ:MIN RM SIZE RO TYPE MOUNTPOINT
 sda 8:0 0 119.2G 0 disk
 ├─sda1 8:1 0 500M 0 part /boot
 └─sda2 8:2 0 118.8G 0 part
  ├─rhel-swap 253:0 0 11.9G 0 lvm [SWAP]
  └─rhel-root 253:1 0 106.8G 0 lvm /
 sdb 8:16 0 100G 0 disk
 sdc 8:32 0 100G 0 disk
 sdd 8:48 0 100G 0 disk
 sde 8:64 0 100G 0 disk
 sdf 8:80 0 100G 0 disk
And as expected:
[root@Host-164 ~]# ls -al /mnt/large
 ls: reading directory /mnt/large: Input/output error
 total 0
I see that the Volumes appear to not having being partitioned:
[root@Host-164 ~]# fdisk /dev/sdf
 Welcome to fdisk (util-linux 2.23.2).
 Changes will remain in memory only, until you decide to write them.
 Be careful before using the write command.
 Device does not contain a recognized partition table
 Building a new DOS disklabel with disk identifier 0xddf99f40.
 Command (m for help): p
 Disk /dev/sdf: 107.4 GB, 107374182400 bytes, 209715200 sectors
 Units = sectors of 1 * 512 = 512 bytes
 Sector size (logical/physical): 512 bytes / 512 bytes
 I/O size (minimum/optimal): 512 bytes / 512 bytes
 Disk label type: dos
 Disk identifier: 0xddf99f40
 Device Boot
 Start
 End
 Blocks Id System
 Command (m for help): q
I create a partition and format with ext2
[root@Host-164 ~]# mke2fs /dev/sdb1
 mke2fs 1.42.9 (28-Dec-2013)
 Filesystem label=
 OS type: Linux
 Block size=4096 (log=2)
 Fragment size=4096 (log=2)
 Stride=0 blocks, Stripe width=0 blocks
 6553600 inodes, 26214144 blocks
 1310707 blocks (5.00%) reserved for the super user
 First data block=0
 Maximum filesystem blocks=4294967296
 800 block groups
 32768 blocks per group, 32768 fragments per group
 8192 inodes per group
 Superblock backups stored on blocks:
 32768, 98304, 163840, 229376, 294912, 819200, 884736, 1605632, 2654208,
 4096000, 7962624, 11239424, 20480000, 23887872
 Allocating group tables: done
 Writing inode tables: done
 Writing superblocks and filesystem accounting information: done
I mount:
[root@Host-164 ~]# mount /dev/sdb1 /mnt/vol1
I fill the volume from the client, and it works. I check the activity in the Server with iostat and there are more MB/s written to the Server’s drives than actually speed copying in the client.
I completely fill 100GB but speed is slow. We are working on a 10Gbps Network so I expected more speed.
I check the connections to the Server:
[root@obs4602-1810 ~]# netstat | grep -v "unix"
Active Internet connections (w/o servers)
Proto Recv-Q Send-Q Local Address               Foreign Address             State
tcp        0      0 192.168.10.10:iscsi-target  192.168.10.180:55300        ESTABLISHED
tcp        0      0 192.168.10.10:iscsi-target  192.168.10.180:55298        ESTABLISHED
tcp        0      0 xxx.yyy.18.10:ssh            xxx.yyy.12.154:57137         ESTABLISHED
tcp        0      0 192.168.10.10:iscsi-target  192.168.10.180:55304        ESTABLISHED
tcp        0      0 192.168.10.10:iscsi-target  192.168.10.180:55301        ESTABLISHED
tcp        0      0 192.168.10.10:iscsi-target  192.168.10.180:55306        ESTABLISHED
tcp        0      0 xxx.yyy.18.10:ssh            xxx.yyy.12.154:56395         ESTABLISHED
tcp        0      0 xxx.yyy.18.10:ssh            xxx.yyy.14.52:57330          ESTABLISHED
tcp        0      0 192.168.10.10:iscsi-target  192.168.10.180:55296        ESTABLISHED
tcp        0      0 192.168.10.10:iscsi-target  192.168.10.180:55305        ESTABLISHED
tcp        0      0 xxx.yyy.18.10:ssh            xxx.yyy.12.154:57133         ESTABLISHED
tcp        0      0 192.168.10.10:iscsi-target  192.168.10.180:55303        ESTABLISHED
tcp        0      0 192.168.10.10:iscsi-target  192.168.10.180:55299        ESTABLISHED
tcp        0      0 192.168.10.10:iscsi-target  192.168.10.176:57542        ESTABLISHED
tcp        0      0 192.168.10.10:iscsi-target  192.168.10.180:55302        ESTABLISHED
I see many connections from Host 180, I check that and another member of the Team is using that client to test with vdbench against the Server.
This explains the slower speed I was getting.
Conclusions
- There was a local problem on the Host. The problems with the disconnection seem to be related to a connection that was lost (sdg). All that information was written to iSCSI buffer, not to the Server. In fact, that volume was mapped in the system with another letter, sdg was not in use.
- Speed was slow due to another client pushing Data to the Server too
- Windows clients with auto reconnect option are not reporting timeout reports while in Red Hat clients iSCSI connection timeouts. It should be increased
2020-03-10 22:16 IST TIP: At that time we were using Google suite and Skype to communicate internally with the different members across the world. If we had used a tool like Slack, and we had a channel like #engineering for example or #sanjoselab, then I could have paged and asked “Is somebody using obs4602-1810?“

