Tag Archives: htop

Install Windows Subsystem for Linux, WSL 2 on Windows 10 64 bit, with Ubuntu, solution to error WslRegisterDistribution failed with error: 0x80070057

You know I love Linux. I was compiling my own Kernels back in 1995, when it took more than 24 hours in a 386, and working on the first ISPs in Barcelona managing the Linux Systems.

For my computers I prefer Linux, no doubt about it, but many multinationals I worked for have Windows option only for the Laptops and Desktops.

During years I had to deal with sending files to Linux or Unix (HP UX, Sun Solaris…) to process them and getting back the result. Some sort of ETL and Map Reduce in the prehistory of personal computers, taking in count aspects like Networks speeds too, available space, splitting files for processing.

When I was working as Senior Project Manager in Winterthur Insurance, now Axa, I had to run a lot of ETL (Extract Transform Load) for considerably big files, or when I was project manager and later head of department in Volkswagen gedas or later helping Start ups like Privalia. I can tell you that Windows didn’t like you to open editors to work with 1GB text or CSV file, and doesn’t like it, even if your computer has 16GB of Memory, and even if they do the simplicity of Bash scripts and using pipes, grep, awk… is so powerful that is very convenient to have those files processed using Linux.

And honestly is a pain to send back and forth files to a UNIX System just for Data Crunch. And a VM will be slow and use memory, and you have enable some sort of sharing with it so it can access the Data. Not to talk if you need to split the data files in blocks to be processed in parallel by several computers.

There are many solutions, like using Virtual Machines, Docker, external Servers, etc…

WSL allows you to run Linux command line tools inside Windows.

https://wiki.ubuntu.com/WSL

Having WSL allows things to be done much more straightforward, processing the files in your local windows hard drives.

Please note: Maybe you have enough using GitBash.

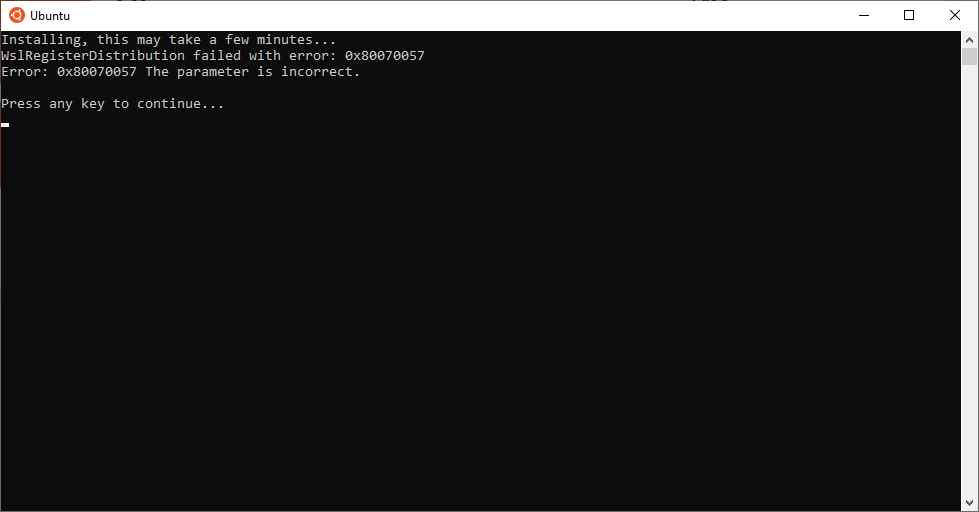
Error installing: WslRegisterDistribution failed with error: 0x80070057

When I installed it I found this error and look for an answer online. I found no solutions and many people suffering from the same problem, so I decided to publish an article on how to make it work.

The instructions I detail are based on the documentation from Canonical https://wiki.ubuntu.com/WSL and from Microsoft https://docs.microsoft.com/en-us/windows/wsl/install-win10 and the final solution I found.

Microsoft use Powershell to activate the features disabled in Windows, I did the same with Command Line, which I found more convenient for most of the non extremely tech people.

You will need:

  • For x64 systems: Version 1903 or higher, with Build 18362 or higher.

You can check your version of windows opening a Terminal (CMD.exe) and typing:

winver
  • For ARM64 systems: Version 2004 or higher, with Build 19041 or higher.

I’m not covering installing WSL for ARM, only for Intel/AMD Desktop/Laptops with Windows 10.

If you’re unsure, you can open a Terminal (CMD.exe) and run:

systeminfo | find "System Type"

If is a x64 system it will return: x64-based PC

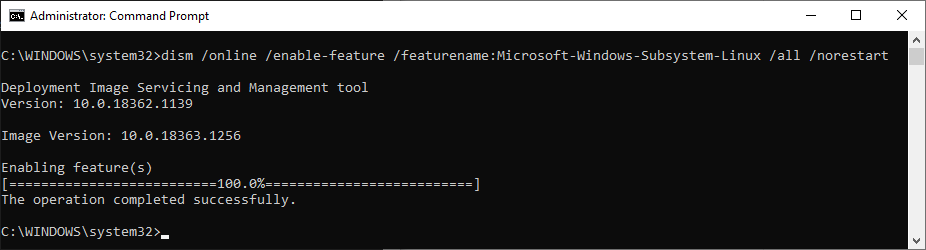
Launch CMD.exe as Administrator and type:

dism /online /enable-feature /featurename:Microsoft-Windows-Subsystem-Linux /all /norestart

Enable Virtual Machine Feature:

dism /online /enable-feature /featurename:VirtualMachinePlatform /all /norestart

At this point you have to Restart Windows to complete this part of the installation, otherwise next step won’t work.

Download the Linux Kernel Update Package from here:

https://wslstorestorage.blob.core.windows.net/wslblob/wsl_update_x64.msi

Execute wsl_update_x64.msi and grant permissions for modifying the system.

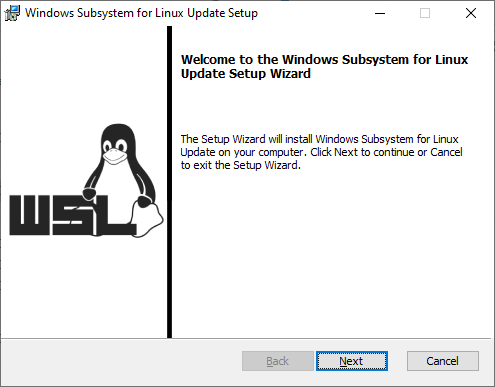
Now it’s crucial that you reboot again. Even if you’re not asked for.

That’s the tricky part.

Then set the version 2 of WSL as default:

C:\WINDOWS\system32>wsl --set-default-version 2
 For information on key differences with WSL 2 please visit https://aka.ms/wsl2

Installing Ubuntu (or Kali, or Debian, or openSUSE…)

Open the Microsoft Store or use Microsoft Store link to go directly to the installation of Ubuntu.

You have also several options as indicated in https://wiki.ubuntu.com/WSL:

The recommended way to install Ubuntu on WSL is through the Microsoft Store.

The following Ubuntu releases are available as apps on the Microsoft Store:

  • Ubuntu 16.04 LTS (Xenial) is the first release available for WSL. It supports the x64 architecture only. (offline installer: x64)
  • Ubuntu 18.04 LTS (Bionic) is the second LTS release and the first one supporting ARM64 systems, too. (offline installers: x64, ARM64)
  • Ubuntu 20.04 LTS (Focal) is the current LTS release, supporting both x64 and ARM64 architecture.
  • Ubuntu (without the release version) always follows the recommended release, switching over to the next one when it gets the first point release. Right now it installs Ubuntu 20.04 LTS.

Each app creates a separate root file system in which Ubuntu shells are opened but app updates don’t change the root file system afterwards. Installing a different app in parallel creates a different root file system allowing you to have both Ubuntu LTS releases installed and running in case you need it for keeping compatibility with other external systems. You can also upgrade your Ubuntu 16.04 to 18.04 by running ‘do-release-upgrade’ and have three different systems running in parallel, separating production and sandboxes for experiments.

But if you prefer, instead of using the Windows Store, you can download the appx.

In the same page mentioned you can do it for several versions, I attach the link for Ubuntu 20.04 LTS: https://aka.ms/wslubuntu2004

Assuming you used the Windows Store, if you did not reboot and try now to execute it for the first time, or you go to the Command Line and write bash, or open Ubuntu from Windows menu, whatever method you use, you’ll get the abovementioned error.

If that happens to you, just reboot and when you open it will work and will start the install and ask for a user and password:

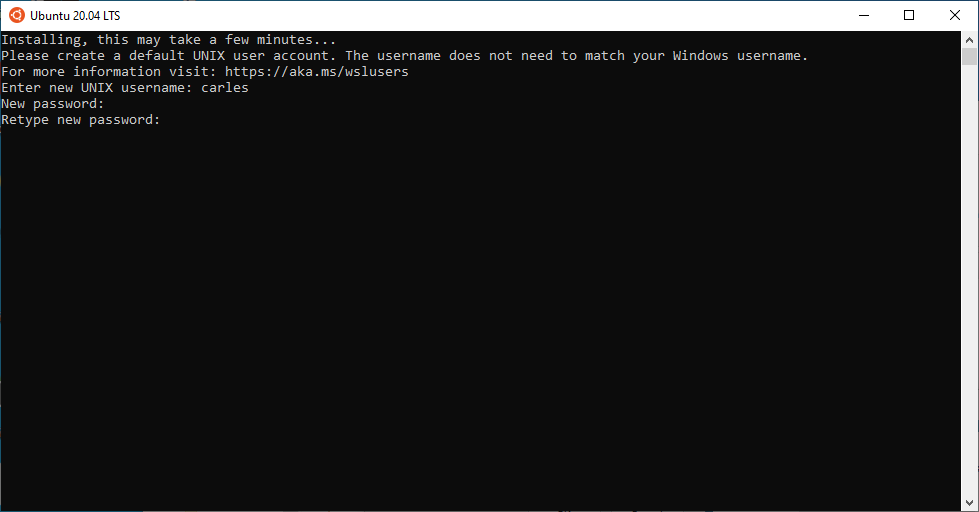
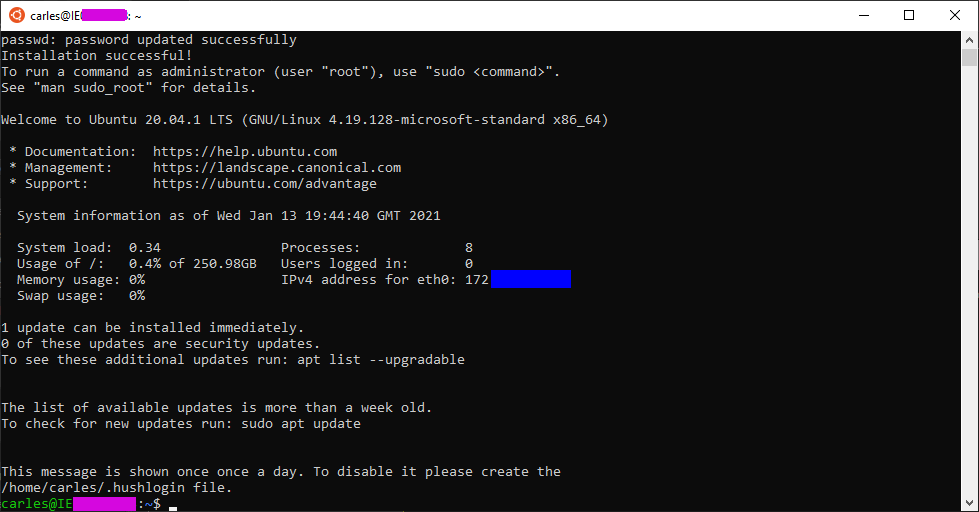
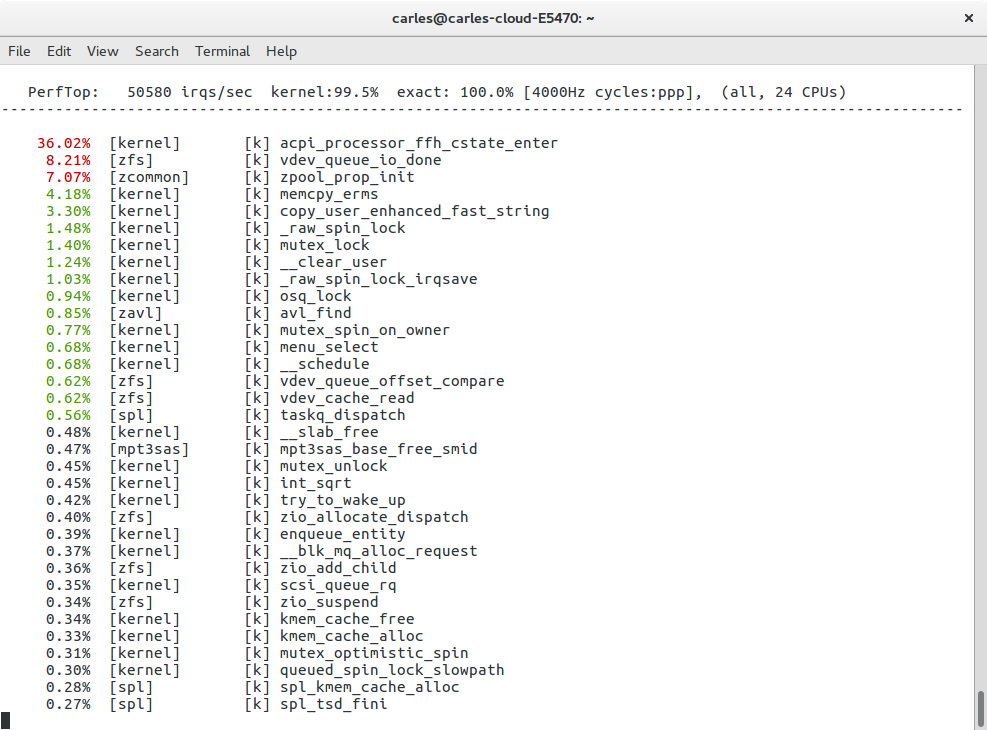
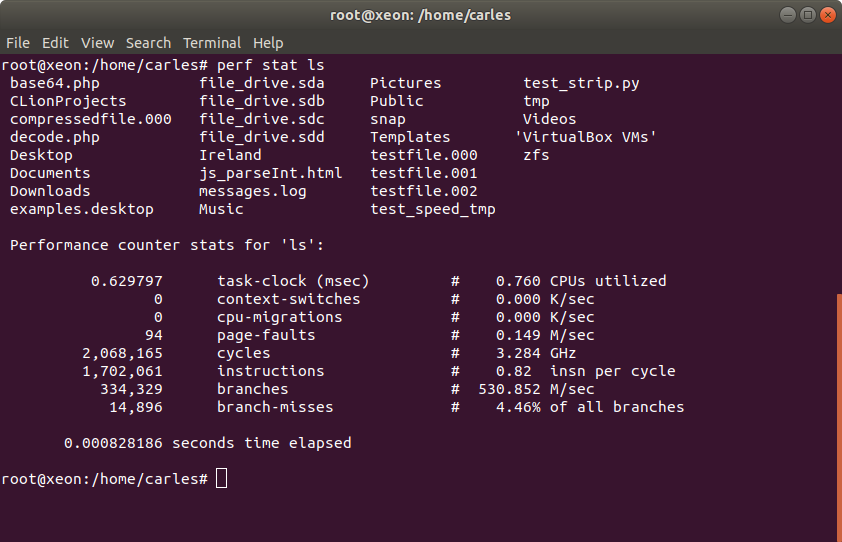
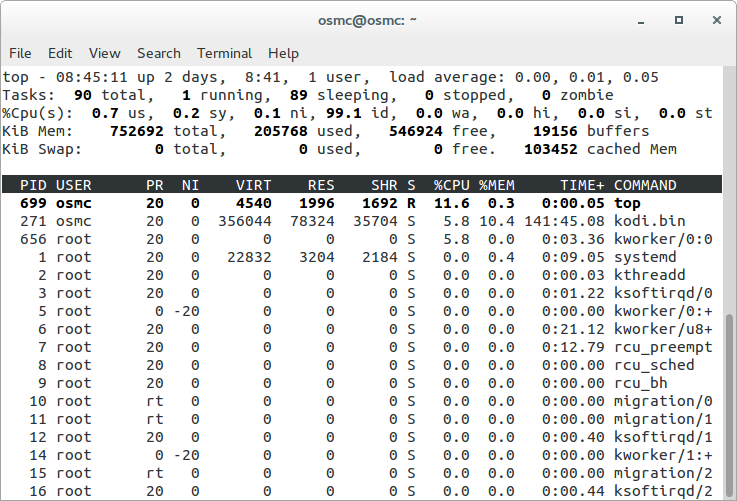
From here you’re able to update the system, execute the text commands available in Linux, access to the Windows drives, launch htop, git, Python3, apt, wget… copy and paste between windows and Linux terminal, share PATH…

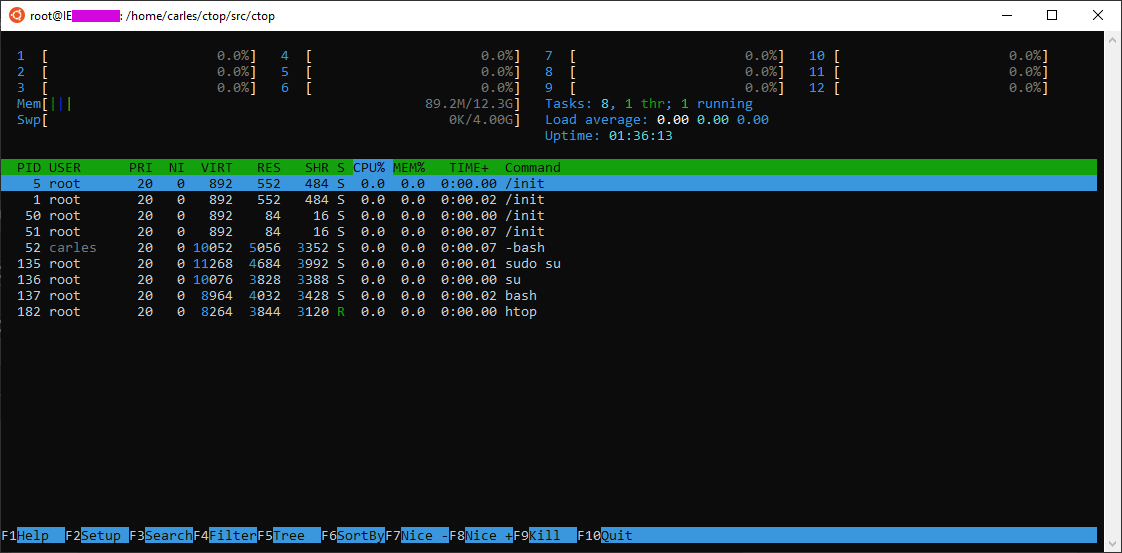
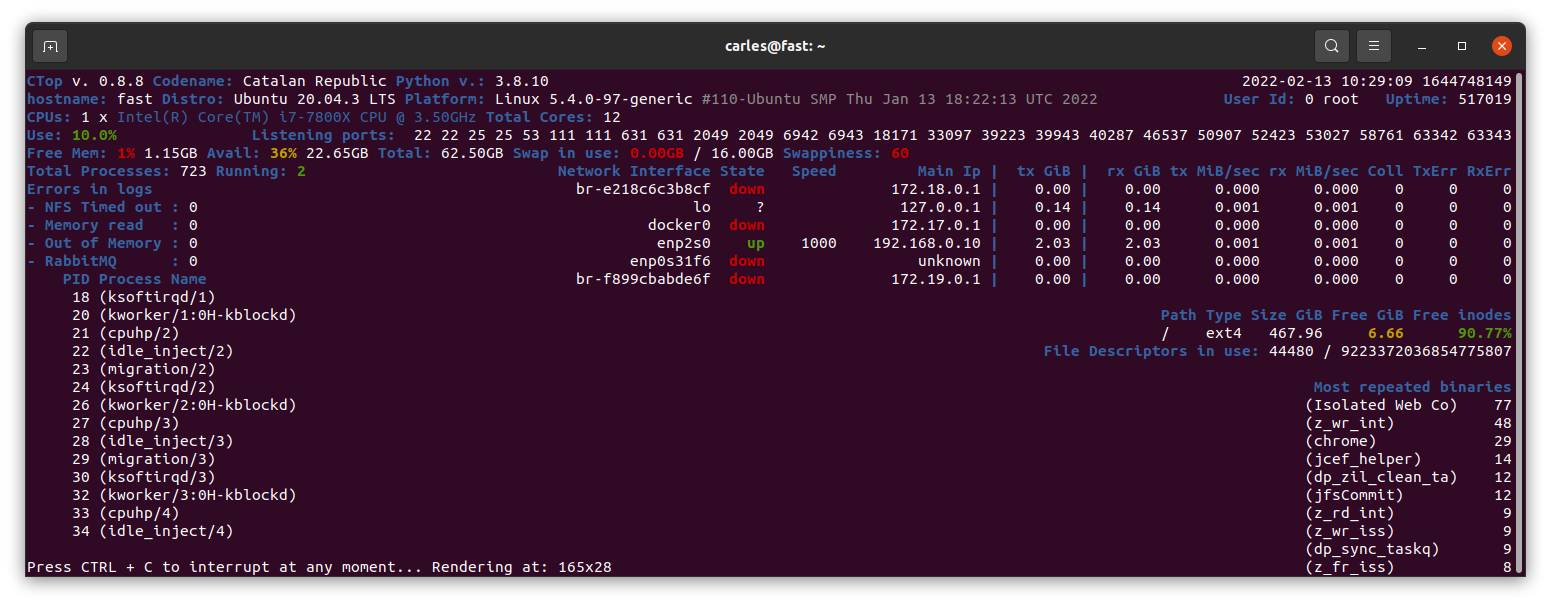
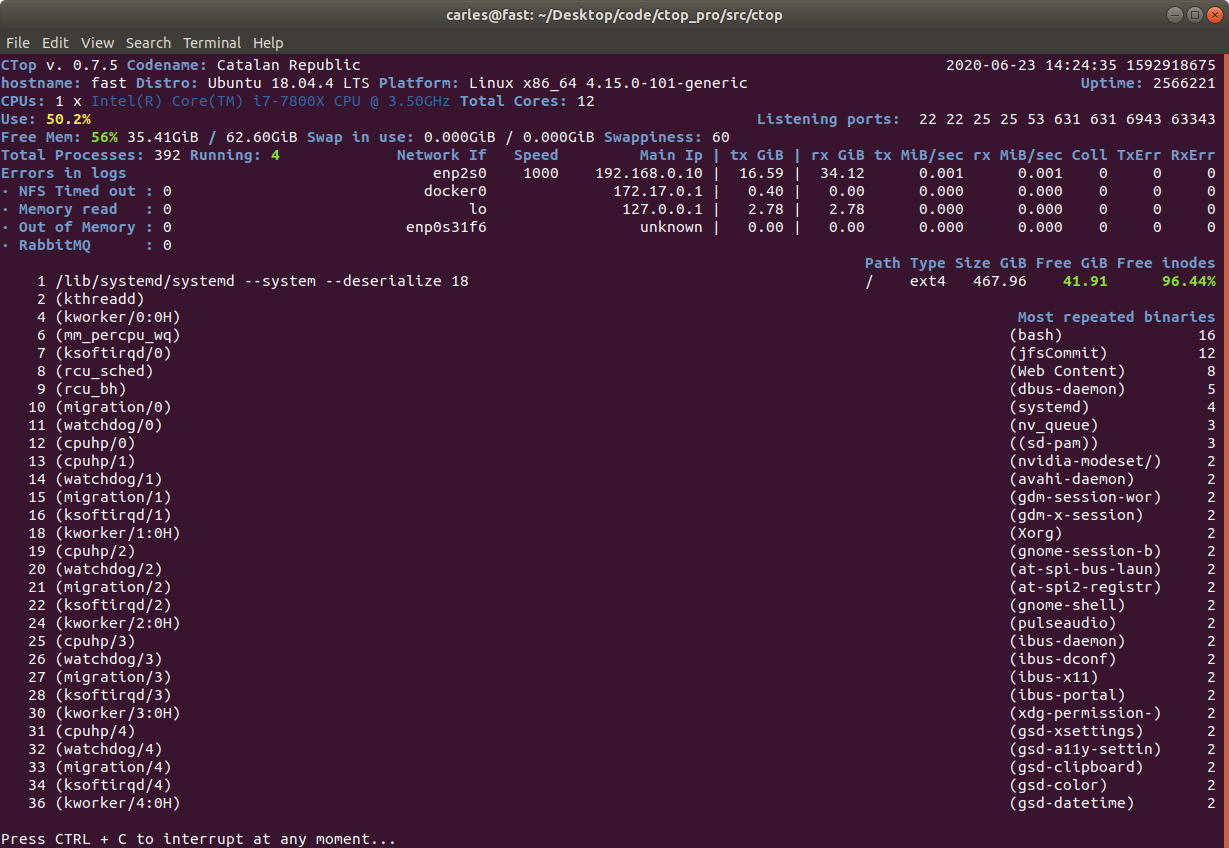
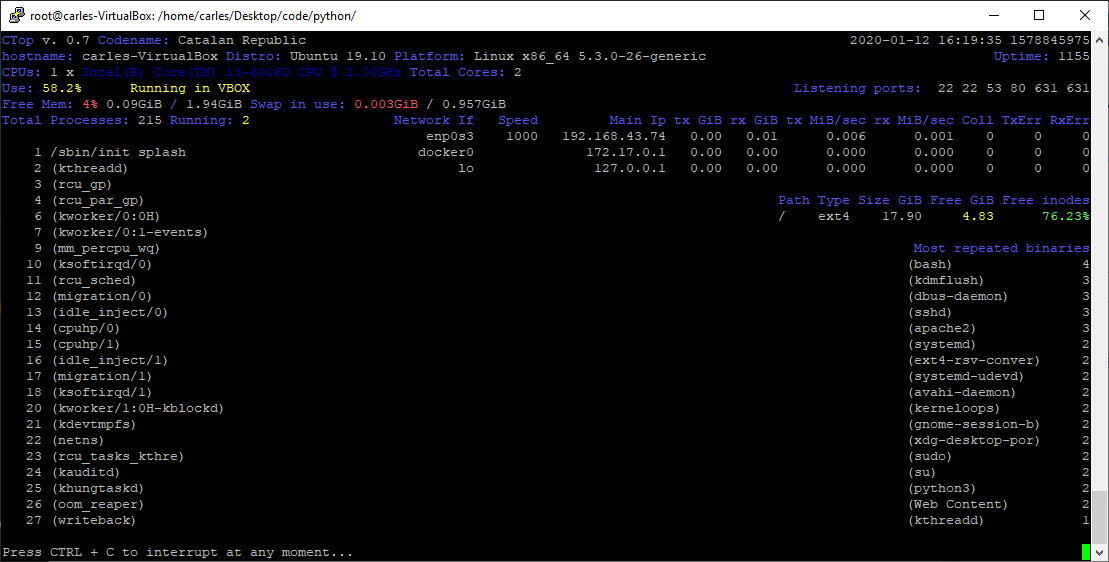
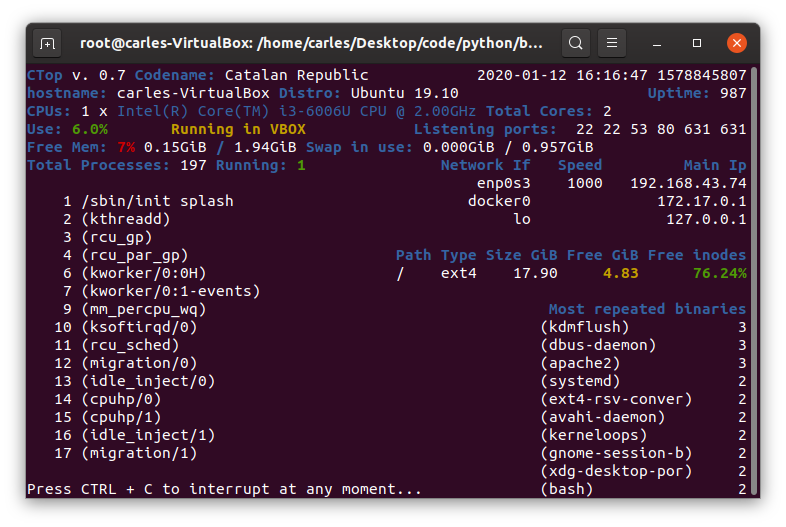
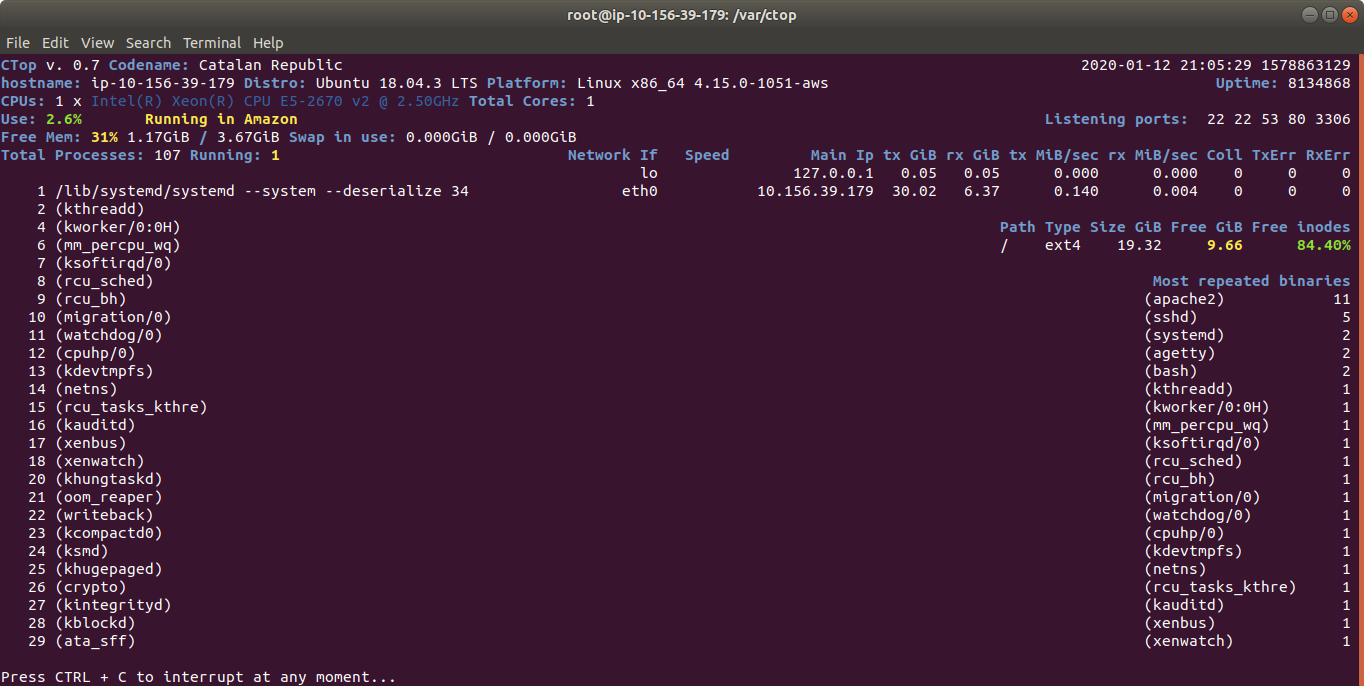
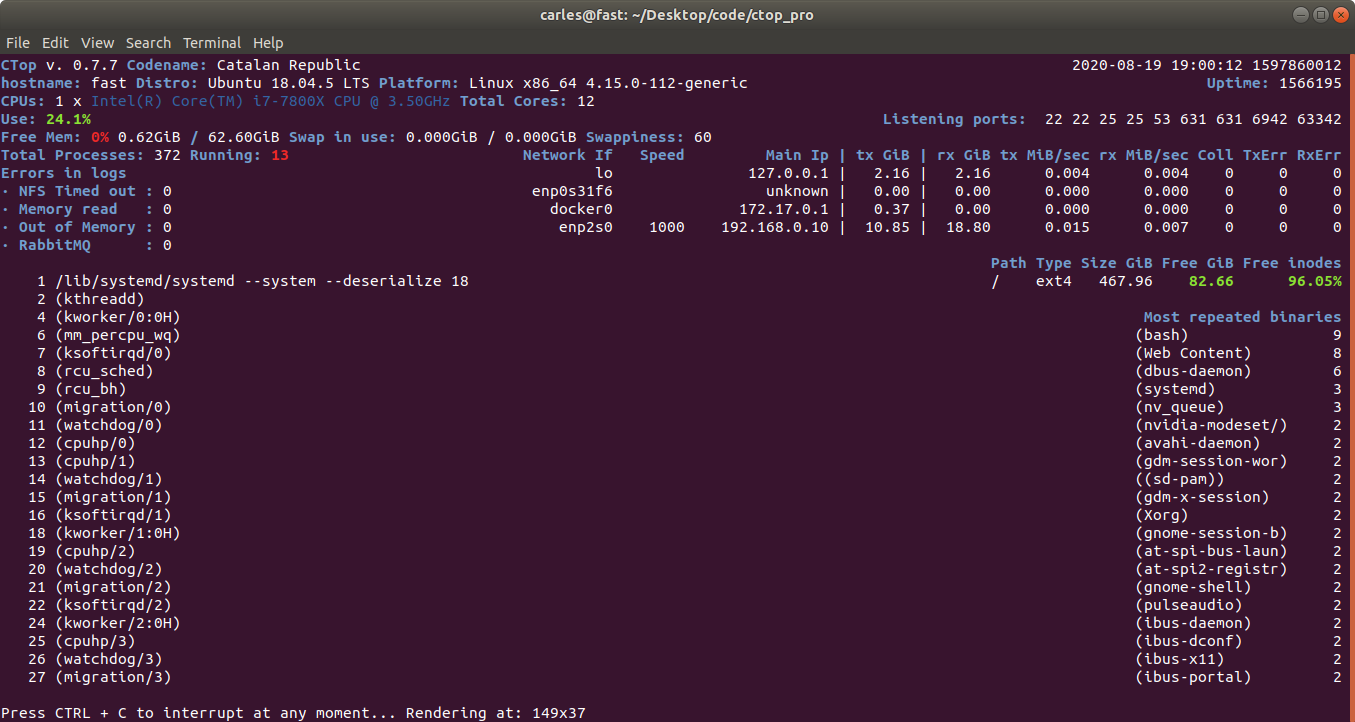
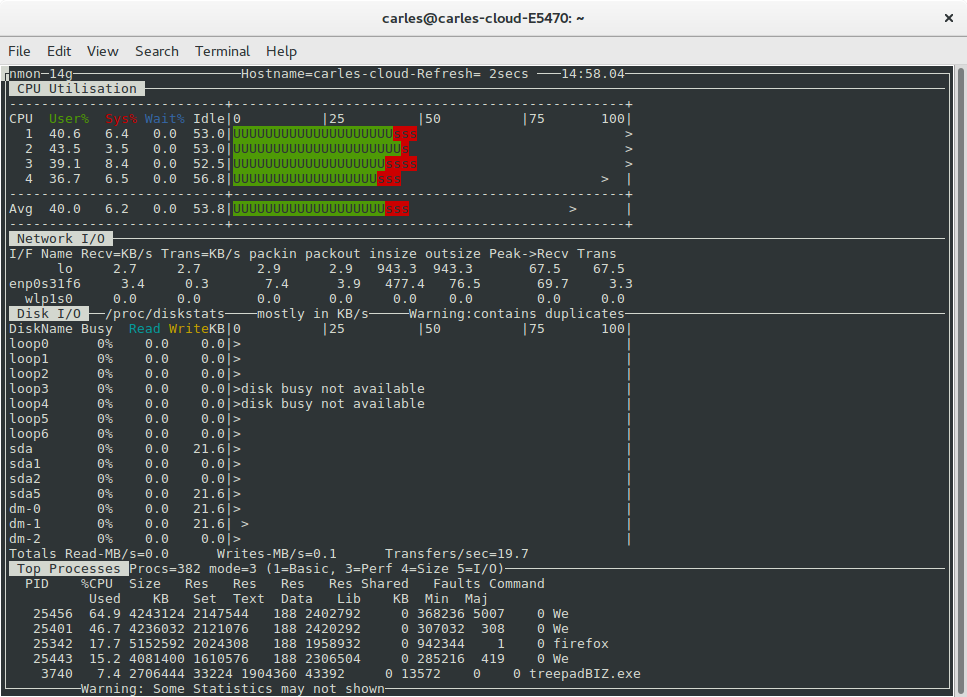
And of course you can run CTOP.py

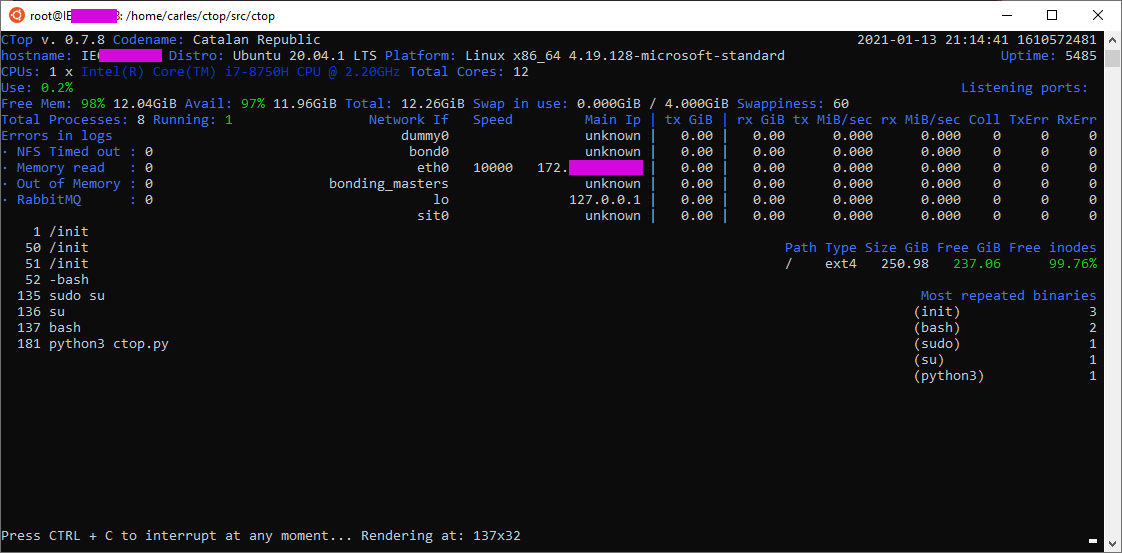
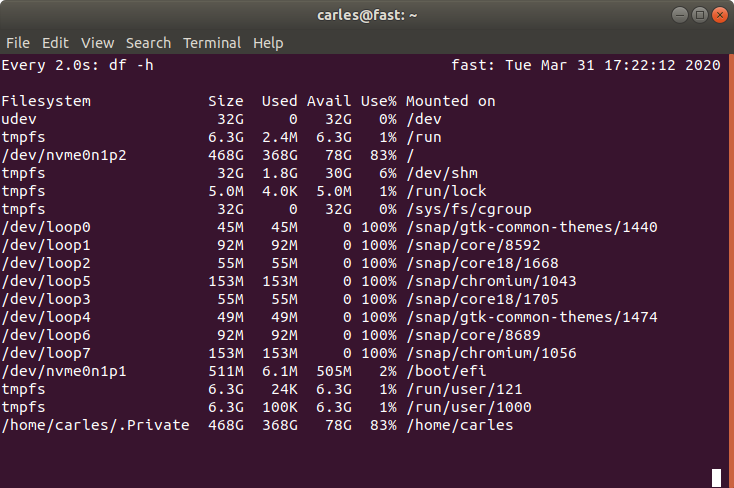
Take in count that the space reported in / partition is not real, and that you have a 4GB swap.

You can access your C:\ Windows files from:

/mnt/c/

CTOP.py

For updated information visit the main page for CTOP.py

Current stable version is v.0.8.9 updated on 2022-07-03.

Current branch under development is v.0.8.10 updated on 2022-07-03.

Version 0.8.0 added compatibility with Python 2, for older Systems.

Find the source code in: https://gitlab.com/carles.mateo/ctop

Clone it with:

git clone https://gitlab.com/carles.mateo/ctop.git

ctop.py is an Open Source tool for Linux System Administration that I’ve written in Python3. It uses only the System (/proc), and not third party libraries, in order to get all the information required.
I use only this modules, so it’s ideal to run in all the farm of Servers and Dockers:

  • os
  • sys
  • time
  • shutil (for getting the Terminal width and height)

The purpose of this tool is to help to troubleshot and to identify problems with a single view to a single tool that has all the typical indicators.

It provides in a single view information that is typically provided by many programs:

  • top, htop for the CPU usage, process list, memory usage
  • meminfo
  • cpuinfo
  • hostname
  • uptime
  • df to see the free space in / and the free inodes
  • iftop to see real-time bandwidth usage
  • ip addr list to see the main Ip for the interfaces
  • netstat or lsof to see the list of listening TCP Ports
  • uname -a to see the Kernel version

Other cool things it does is:

  • Identifying if you’re inside an Amazon VM, Google GCP, OpenStack VMs, Virtual Box VMs, Docker Containers or lxc.
  • Compatible with Raspberry Pi (tested on 3 and 4, on Raspbian and Ubuntu 20.04LTS)
  • Uses colors, and marks in yellow the warnings and in red the errors, problems like few disk space reaming or high CPU usage according to the available cores and CPUs.
  • Redraws the screen and adjust to the size of the Terminal, bigger terminal displays more information
  • It doesn’t use external libraries, and does not escape to shell. It reads everything from /proc /sys or /etc files.
  • Identifies the Linux distribution
  • Supports Plugins loaded on demand.
  • Shows the most repeated binaries, so you can identify DDoS attacks (like having 5,000 apache instances where you have normally 500 or many instances of Python)
  • Indicates if an interface has the cable connected or disconnected
  • Shows the Speed of the Network Connection (useful for Mellanox cards than can operate and 200Gbit/sec, 100, 50, 40, 25, 10…)
  • It displays the local time and the Linux Epoch Time, which is universal (very useful for logs and to detect when there was an issue, for example if your system restarted, your SSH Session would keep latest Epoch captured)
  • No root required
  • Displays recent errors like NFS Timed outs or Memory Read Errors.
  • You can enforce the output to be in a determined number of columns and rows, for data scrapping.
  • You can specify the number of loops (1 for scrapping, by default is infinite)
  • You can specify the time between screen refreshes, for long placed SSH sessions
  • You can specify to see the output in b/w or in color (default)

Plugins allow you to extend the functionality effortlessly, without having to learn all the code. I provide a Plugin sample for starting lights on a Raspberry Pi, depending on the CPU Load, and playing a message “The system is healthy” or “Warning. The CPU is at 80%”.

Limitations:

  • It only works for Linux, not for Mac or for Windows. Although the idea is to help with Server’s Linux Administration and Troubleshot, and Mac and Windows do not have /proc
  • The list of process of the System is read every 30 seconds, to avoid adding much overhead on the System, other info every second
  • It does not run in Python 2.x, requires Python 3 (tested on 3.5, 3.6, 3.7, 3.8, 3.9)

I decided to code name the version 0.7 as “Catalan Republic” to support the dreams and hopes and democratic requests of the Catalan people, to become and independent republic.

I created this tool as Open Source and if you want to help I need people to test under different versions of:

  • Atypical Linux distributions

If you are a Cloud Provider and want me to implement the detection of your VMs, so the tool knows that is a instance of the Amazon, Google, Azure, Cloudsigma, Digital Ocean… contact me through my LinkedIn.

Monitoring an Amazon Instance, take a look at the amount of traffic sent and received

Some of the features I’m working on are parsing the logs checking for errors, kernel panics, processed killed due to lack of memory, iscsi disconnects, nfs errors, checking the logs of mysql and Oracle databases to locate errors

Dealing with Performance degradation on ZFS (DRAID) Rebuilds when migrating from a single processor to a multiprocessor platform

This is the history it happen to me some time ago, and so the commands I used to troubleshot. The purpose is to share knowledge in a interactive way. There are some hidden gems that you’ll acquire if you have the patience to go over all the document and read it all…

I had qualified Intel Xeon single processor platform to run my DRAID (ZFS Declustered RAID) project for my employer.

The platforms I qualified were:

1) single processor for Cold Storage (SAS Spinning drives): 4U60, newest models 4602

2) for multiprocessor: the 4U90 (90 Spinning drives) and Flash: All-Flash-Arrays.

The amounts of RAM I was using for my tests range for 64GB to 384GB.

Somebody in the company, at executive level, assembled an experimental config that was totally new for us and wanted to try by their own. It was the 4602 with multiprocessor and 32GB of RAM.

When they were unable to make it work at the expected speed, they required me to troubleshot and to make it work.

The 4602 single processor had two IOC (Input Output Controller, LSI Logic / Symbios Logic SAS3008 PCI-Express Fusion-MPT SAS-3 (rev 02) ), while the 4602 double processor had four IOC, so given that each of those IOC can perform at peaks of 6GB/s, with a maximum total of 24 GB/s, the performance when reading/writing from all the drives should be better.

But this Server was returning double times for Rebuilding, respect the single processor version, which didn’t make any sense.

I had to check everything. There was the commands I ran:

Check the upgrade of the CPU:

htop
lscpu

Changing the Zoning.

Those Servers use SAS drives dual ported, which means that two different computers can be connected to the same drive and operate at the same time. Is up to you to make sure you don’t introduce corruption. Those systems are used mainly for HA (High Availability).

Those Systems allow to be configured in different zoning modes. That’s the way on how each of the two servers (Controllers) see the disk. In one zoning each Controller sees only 30 drives, in another each IOC sees all the drives (for redundancy but performance constrained to 1 IOC Speed).

The config I set is each IOC will see 15 drives, so each one of the 4 IOC will have 6GB/s for 15 drives. Given that these spinning drives perform in the outtermost part of the cylinder at 265MB/s, that means that at maximum speed one IOC will be using 3.97 GB/s, will say 4GB/s. Plenty of bandwidth.

Note: Spinning drives have different performance depending on how close you’re to the cylinder. In the innermost part it goes under 145 MB/s, and if you read all of those drive sequentially with dd it will return an average speed of 145 MB/s.

With this command you can sive live how it performs and the average read speed in real time. Use skip to jump to that position (relative to bs) in the drive, so you can test directly the speed at the innermost close to the cylinder part of t.

dd if=/dev/sda of=/dev/null bs=1M status=progress

I saw that the zoning was not right one, so I set it correctly:

[root@4602Carles ~]# sg_map -i | grep NEWISYS
/dev/sg30  NEWISYS   NDS-4602-CS       0112
/dev/sg61  NEWISYS   NDS-4602-CS       0112
/dev/sg63  NEWISYS   NDS-4602-CS       0112
/dev/sg64  NEWISYS   NDS-4602-CS       0112
[root@4602Carles10 ~]# sg_senddiag /dev/sg30  --pf --raw=04,00,00,01,53
[root@4602Carles10 ~]# sleep 50
[root@4602Carles10 ~]# sg_senddiag /dev/sg30 --pf -r 04,00,00,01,43
[root@4602Carles10 ~]# sleep 50
[root@4602Carles10 ~]# reboot

The sleeps after rebooting the expanders are recommended. Rebooting the Operating System too, to avoid problems with some Software as the expanders changed live.

If you have ZFS pools or workloads stop them and export the pool before messing with the expanders.

In order to check to which drives is connected each IOC:

[root@4602Carles10 ~]# sg_map -i -x
/dev/sg0  0 0 0 0  0  /dev/sda  TOSHIBA   MG07SCA14TA       0101
/dev/sg1  0 0 1 0  0  /dev/sdb  TOSHIBA   MG07SCA14TA       0101
/dev/sg2  0 0 2 0  0  /dev/sdc  TOSHIBA   MG07SCA14TA       0101
/dev/sg3  0 0 3 0  0  /dev/sdd  TOSHIBA   MG07SCA14TA       0101
/dev/sg4  0 0 4 0  0  /dev/sde  TOSHIBA   MG07SCA14TA       0101
/dev/sg5  0 0 5 0  0  /dev/sdf  TOSHIBA   MG07SCA14TA       0101
/dev/sg6  0 0 6 0  0  /dev/sdg  TOSHIBA   MG07SCA14TA       0101
/dev/sg7  0 0 7 0  0  /dev/sdh  TOSHIBA   MG07SCA14TA       0101
/dev/sg8  1 0 8 0  0  /dev/sdi  TOSHIBA   MG07SCA14TA       0101
/dev/sg9  1 0 9 0  0  /dev/sdj  TOSHIBA   MG07SCA14TA       0101
/dev/sg10  1 0 10 0  0  /dev/sdk  TOSHIBA   MG07SCA14TA       0101
/dev/sg11  1 0 11 0  0  /dev/sdl  TOSHIBA   MG07SCA14TA       0101
[...]
/dev/sg16  4 0 16 0  0  /dev/sdq  TOSHIBA   MG07SCA14TA       0101
/dev/sg17  4 0 17 0  0  /dev/sdr  TOSHIBA   MG07SCA14TA       0101
[...]
/dev/sg30  0 0 30 0  13  NEWISYS   NDS-4602-CS       0112
[...]

Still after setting the right zone the Rebuilds were slow, the scan rate half of the obtained with a single processor.

I tested that the system was able to provide the expected performance by reading from all the drives at the same time. This is done with:

dd if=/dev/sda of=/dev/null bs=1M status=progress &
dd if=/dev/sdb of=/dev/null bs=1M status=progress &
dd if=/dev/sdc of=/dev/null bs=1M status=progress &
dd if=/dev/sdd of=/dev/null bs=1M status=progress &
[...]

I do this for all the drives at the same time and with iostat:

iostat -y 1 1

I check the status of the memory with:

slabtop
free
htop

I checked the memory and htop during a Rebuild. Memory was more than enough. However CPU usage was higher than expected.

The red bars in the image correspond to kernel processes, in this case is the DRAID Rebuild. I see that the load is higher than the usual with a single processor.

I capture all the parameters from ZFS with:

zfs get all

All this information is logged into my forensics document, so later can be checked by my Team or I can share with other Architects or other members of the company. I started this methodology after I knew how Google do their SRE forensics / postmortem documents. Also for myself is useful for the future to have a log of the commands I executed and a verbose output of the results.

I install the smp_utils

yum install smp_utils

Check things:

ls -al  /dev/bsg/
total 0drwxr-xr-x.  2 root root     3020 May 22 10:16 .
drwxr-xr-x. 20 root root     8680 May 22 10:16 ..
crw-------.  1 root root 248,  76 May 22 10:00 1:0:0:0
crw-------.  1 root root 248, 126 May 22 10:00 10:0:0:0
crw-------.  1 root root 248, 127 May 22 10:00 10:0:1:0
crw-------.  1 root root 248, 136 May 22 10:00 10:0:10:0
crw-------.  1 root root 248, 137 May 22 10:00 10:0:11:0
crw-------.  1 root root 248, 138 May 22 10:00 10:0:12:0
crw-------.  1 root root 248, 139 May 22 10:00 10:0:13:0
[...]
[root@4602Carles10 ~]# smp_discover /dev/bsg/expander-1:0
[...]
[root@4602Carles10 ~]# smp_discover /dev/bsg/expander-1:1

I check for errors in the expander that could justify the problems of performance:

for i in `seq 0 64`; do smp_rep_phy_err_log -p $i /dev/bsg/expander-1\:0 ; done
Report phy error log response:
  Expander change count: 567
  phy identifier: 0
  invalid dword count: 0
  running disparity error count: 0
  loss of dword synchronization count: 0
  phy reset problem count: 0
[...]
Report phy error log response:
  Expander change count: 567
  phy identifier: 52
  invalid dword count: 168
  running disparity error count: 172
  loss of dword synchronization count: 5
  phy reset problem count: 0
Report phy error log response:
  Expander change count: 567
  phy identifier: 53
  invalid dword count: 6
  running disparity error count: 6
  loss of dword synchronization count: 0
  phy reset problem count: 0
Report phy error log response:
  Expander change count: 567
  phy identifier: 54
  invalid dword count: 267
  running disparity error count: 270
  loss of dword synchronization count: 4
  phy reset problem count: 0
Report phy error log response:
  Expander change count: 567
  phy identifier: 55
  invalid dword count: 127
  running disparity error count: 131
  loss of dword synchronization count: 5
  phy reset problem count: 0
Report phy error log result: Phy vacant

There are some errors, and I check with the Hardware Team, which pass a battery of tests on the machine and say that the machine passes. They tell me that if the errors counted were in order of millions then it would be a problem, but having few of them is usual.

My colleagues previously reported that the memory was performing well, and the CPU too. They told me that the speed was exactly double respect a platform with one single CPU of the same kind.

Even if they told me that, I ran cmips tests to make sure.

git clone https://github.com/cmips/cmips_bin

It scored 16,000. The performance was Ok in general terms but the problem is that I didn’t have a baseline for that processor in single processor, so I cannot make sure that the memory bandwidth was Ok. The performance was less that an Amazon c3.8xlarge. The system I was testing is a two processor system, but each CPU is cheap, around USD $400.

Still my gut feeling was telling me that this double processor server should score more.

lscpu
[root@DRAID-1135-14TB-2CPU ~]# lscpu
 Architecture:          x86_64
 CPU op-mode(s):        32-bit, 64-bit
 Byte Order:            Little Endian
 CPU(s):                32
 On-line CPU(s) list:   0-31
 Thread(s) per core:    2
 Core(s) per socket:    8
 Socket(s):             2
 NUMA node(s):          2
 Vendor ID:             GenuineIntel
 CPU family:            6
 Model:                 79
 Model name:            Intel(R) Xeon(R) CPU E5-2620 v4 @ 2.10GHz
 Stepping:              1
 CPU MHz:               2299.951
 CPU max MHz:           3000.0000
 CPU min MHz:           1200.0000
 BogoMIPS:              4199.73
 Virtualization:        VT-x
 L1d cache:             32K
 L1i cache:             32K
 L2 cache:              256K
 L3 cache:              20480K
 NUMA node0 CPU(s):     0-7,16-23
 NUMA node1 CPU(s):     8-15,24-31
 Flags:                 fpu vme de pse tsc msr pae mce cx8 apic sep mtrr pge mca cmov pat pse36 clflush dts acpi mmx fxsr sse sse2 ss ht tm pbe syscall nx pdpe1gb rdtscp lm constant_tsc arch_perfmon pebs bts rep_good nopl xtopology nonstop_tsc aperfmperf eagerfpu pni pclmulqdq dtes64 monitor ds_cpl vmx smx est tm2 ssse3 sdbg fma cx16 xtpr pdcm pcid dca sse4_1 sse4_2 x2apic movbe popcnt tsc_deadline_timer aes xsave avx f16c rdrand lahf_lm abm 3dnowprefetch epb cat_l3 cdp_l3 intel_ppin intel_pt ibrs ibpb stibp tpr_shadow vnmi flexpriority ept vpid fsgsbase tsc_adjust bmi1 hle avx2 smep bmi2 erms invpcid rtm cqm rdt_a rdseed adx smap xsaveopt cqm_llc cqm_occup_llc cqm_mbm_total cqm_mbm_local dtherm ida arat pln pts spec_ctrl intel_stibp

I check the memory configuration with:

dmidecode -t memory

I examined the results, I see that the processor can only operate the DDR4 ECC 2400 Memory at 2133 and… I see something!. This Controller before was a single processor with 2 Memory Sticks of 16GB each, dual rank.

I see that now I have the same number of sticks in that machine, but I have two CPU!. So 2 Memory sticks in total, for 2 CPU.

That’s no good. The memory must be in pairs and in the right slots to get the maximum performance.

1 memory module for 1 CPU doesn’t allow to have Dual Channel and probably is affecting the performance. Many Servers will not even boot if you add an odd number of memory sticks per CPU.

And many Servers can operate at full speed only if all the banks are filled.

I request to the Engineers in Silicon Valley to add 4 modules in the right slots. They did, and I repeated the tests and the performance was doubled then.

After some days I had some time with the machine, I repeated the test and I got a CMIPS Score of around 20,000.

Multiprocessor world is far more complicated than single processor. Some times things can work not as expected, and not be evident, for example cache pipeline can act diferent for a program working in multiprocessor and single processor. Or the QPI could be saturated.

After this I shared my forensics document with as many Engineers as I could, so they could learn how I did to troubleshot the problem, and what was the origin of it, and I asked them to do the same so we can track their steps and progress if something needs to be troubleshoot.

After proper intensive testing the Server was qualified. Lesson here is that changes cannot be commited quickly, need their time.

Linux command-line tools I usually install

Some additional command-line tools that I use to install and use on my text client Systems. Initially here were not listed commands that are shipped with every Linux, but the additional tools I install in every Workstation or Server.

Apache benchmarks (ab)

To stress a Web Server

atop

A good complement to htop, iftop… monitoring tools

bzip2

Cool compressor better than gzip and that also accepts streams.

cfdisk

Nice tool to work with partitions through modern menus.

ctop

Command line / text based Linux Containers monitoring tool.

If you use docker stats, ctop is much better.

ctop.py

My own moniroring too.

dmidecode

Is the dmi Table decoder.

For example: dmidecode -t memory

dstat

Very nice System Stats tool. You can specify individual stats, like a drive.

edac-util

Error reporting utility

edac-util --verbose
mc0: 0 Uncorrected Errors with no DIMM info
mc0: 0 Corrected Errors with no DIMM info
mc0: csrow0: 0 Uncorrected Errors
mc0: csrow0: CPU_SrcID#0_MC#0_Chan#0_DIMM#0: 0 Corrected Errors
mc0: csrow0: CPU_SrcID#0_MC#0_Chan#1_DIMM#0: 0 Corrected Errors
mc0: csrow0: CPU_SrcID#0_MC#0_Chan#2_DIMM#0: 0 Corrected Errors
mc1: 0 Uncorrected Errors with no DIMM info
mc1: 0 Corrected Errors with no DIMM info
mc1: csrow0: 0 Uncorrected Errors
mc1: csrow0: CPU_SrcID#0_MC#1_Chan#0_DIMM#0: 0 Corrected Errors
mc1: csrow0: CPU_SrcID#0_MC#1_Chan#1_DIMM#0: 0 Corrected Errors
mc1: csrow0: CPU_SrcID#0_MC#1_Chan#2_DIMM#0: 0 Corrected Errors
mc2: 0 Uncorrected Errors with no DIMM info
mc2: 0 Corrected Errors with no DIMM info
mc2: csrow0: 0 Uncorrected Errors
mc2: csrow0: CPU_SrcID#1_MC#0_Chan#0_DIMM#0: 0 Corrected Errors
mc2: csrow0: CPU_SrcID#1_MC#0_Chan#1_DIMM#0: 0 Corrected Errors
mc2: csrow0: CPU_SrcID#1_MC#0_Chan#2_DIMM#0: 0 Corrected Errors
mc3: 0 Uncorrected Errors with no DIMM info
mc3: 0 Corrected Errors with no DIMM info
mc3: csrow0: 0 Uncorrected Errors
mc3: csrow0: CPU_SrcID#1_MC#1_Chan#0_DIMM#0: 0 Corrected Errors
mc3: csrow0: CPU_SrcID#1_MC#1_Chan#1_DIMM#0: 0 Corrected Errors
mc3: csrow0: CPU_SrcID#1_MC#1_Chan#2_DIMM#0: 0 Corrected Errors

ethtool

ethtool

fatrace
Reports file access events from all running processes in real time.

flock
With flock several processes can have a shared lock at the same time, or be waiting to acquire a write lock. With lslocks from util-linux package you can get a list of these processes.

fstrim

discard unused blocks on a mounted filesystem (local or remote). Is useful for freeing blocks no longer used in ZFS zvols. That can also be achieved by mount -o discard

fuser
Show which processes use the named files, sockets, or filesystems.

git

glances

A tool for monitoring similar to ctop and htop.

hdparm
Get/set SATA/IDE device parameters

htop

An improved top

httpie

A http client.

id (configure to query OpenLDAP)

ifmetrics

To set the metrics of all IPV4 routes attached to a given network interface

ifstat

Pretty network interfaces stats.

iftop

To watch metrics for a network interface (or wireless)

iftop-wlan0

iostat

CPU and IO devices stats. I modified some collectors for telegraf and influxdb consumed by grafana for fetching the Write KB/s, Read KB/s, Bandwidth of the Magnetic Spinning drives and SSD during declustered rebuild.

iotop

iperf

Perform network throughput tests

ipmitool

iptables

iscsiadm

java (jre Oracle and OpenJDK)

journalctl

ldap-utils

ldapsearch and the other tools to work with LDAP.

less
According to manpages, the opposite of more. :)
What it does is display a file, and you can scroll up/down, you can search for patterns…
Examples:
cat /etc/passwd | less
less /etc/passwd
# -n doesn’t count the lines, to save time
# For a specific Offset
less -n +500000000P /var/log/apache2/giant.log
# For 50% point
less -n +50p /var/log/apache2/giant.log

lrzip /lrztar

Compressor that compresses very efficiently big files, specially GB of of source code.

lrzsz (Zmodem)

An utility to send files to the Server through a terminal.

Very useful when you don’t want to scp or rsftp, for example because that requires MFA  (Multi Factor Authentication) to be performed again and you already have a session open.

Moba xTerm for Windows is one of the Terminal clients that accepts Upload/Download of Z-modem

Moba xTerm for Windows is one of the Terminal clients that accepts Upload/Download of Z-modem

apt install lrzsz

lsblk

List the block devices. Also is handy blkid but you can get this from /dev/disk/by-id/

lynx

Text browser. really handy.

ltrace
To trace library calls.

mc

Midnight Commander

mc


md5sum

memtester

Basically for testing Memory.

This will allocate 4GB of RAM and run the test 10 times.

sudo memtester 4096 10

mtr

Network tool mix between ping and traceroute.

mytop

To see in real time queries and slow queries to mysql

ncdu

Show the space used by any directory and subdirectory

ncdu

ncdu-2

nginx (fpm-php) and apache

The webservers

nfs client

nmon

Offers monitoring of different aspects: Network, Disk, Processes…

open-vpn

openssh-server

parted

Partition manipulation

perf

Performance profiler.

Ie:
perf top
perf stat ls

PHP + curl + mysql (hhvm)

pixz

A parallel, multiprocessor, variant of gzip/bzip2 that can leverage several processors to speed up the compression over files.

If the input looks like a tar archive, it also creates an index of all the files in the archive. This allows the extraction of only a small segment of the tarball, without needing to decompress the entire archive.

postcat

postcat -q ID shows the details of a message in the queue

python-pip and pypy

pv
Pipe Viewer – is a terminal-based tool for monitoring the progress of data through a pipeline. It can be inserted into any normal pipeline between two processes to give a visual indication of how quickly data is passing through, how long it has taken, how near to completion it is, and an estimate of how long it will be until completion.

dd if=/dev/urandom | pv | dd of=/dev/null

Output:

1,74MB 0:00:09 [ 198kB/s] [      <=>                               ]

Probably you’ll prefer to use dd with status=progress option, it’s just a sample.

qshape

It shows the composition of the mail queue.

screen

sdparm
Access SCSI modes pages; read VPD pages; send simple SCSI commands

sfdisk

Utility to work with partitions that can export and import configs through STDIN and STDOUT to automate partitions operations.

slabtop
Displays Kernel slab cache information in real time.

smartctl

Utility for dealing with the S.M.A.R.T. features of the disks, knowing errors…

split
Split a file into several, based by text lines, or binary: number of bytes per file.

sha512sum

sshfs

Mount a mountpoint on a remote Server by using SSH.

sshpass
SSH without typing the password. -f for reading it from a file.
sshpass -p “mypassword” ssh -o StrictHostKeyChecking=no root@10.251.35.251

In this sample passing the command ls, so this will be executed, and logout.
sshpass -p “mypassword” ssh -o StrictHostKeyChecking=no root@10.251.35.251 ls

sshuttle

A poor’s man VPN through SSH that is available for Linux and Mac OS X.

E.g.: sudo sshuttle -r carles@8.8.1.234:8275 172.30.0.0/16

Sshuttle forwards TCP and DNS but does not forward UDP or ICMP. So ping or ipmi protocol won’t work. But it does work for http, https, ssh…

Nice article on tunneling only certain things here.

strace

To trace the system calls and signals.
To redirect the output to another process use:
strace zpool status 2>&1 | less

stress-ng

Basically to stress Servers.

strings

Shows only strings from a file (normally a Binary)

From package binutils.

subversion svn

systemd-cgtop and systemd-analyze

tcpdump

To see the traffic to your NIC

tcptraceroute

TCP/IP Traceroure. Targets ports so you can use it to see if port is open too.

tee

Reads from sdtin and sends to a file and outputs to stdout as well.
For example:

find . -mtime -1 -print | grep -v "/logs/" 2>&1 | tee /var/log/results.log

timeout
Kills the process after the indicated timeout.

timeout 1000 dd if=/dev/urandom of=/dev/zvol/carles-N51-C5-D8-P2-S1/gb1000

tracepath

traceroute

tree

Tree simply shows the directory hierarchy in a graphical (text mode) way. Useful to see where files and subfolders are.

xxd
Make a hexdump or do the reverse

sudo xxd /dev/nvme0n1p1 | less

zcat
Just like cat, but for compressed filed.

zcat logs.tar.gz | grep "Error"
zcat logs.tar.gz | less

zless

zram-config

Sergey Davidoff stumbled upon a project called compcache that creates a RAM based block device which acts as a swap disk, but is compressed and stored in memory instead of swap disk (which is slow), allowing very fast I/O and increasing the amount of memory available before the system starts swapping to disk. compcache was later re-written under the name zRam and is now integrated into the Linux kernel.

http://www.webupd8.org/2011/10/increased-performance-in-linux-with.html

watch

Whatch allow you to execuate a command and what it (refresh it) at a given intervals, for example every two seconds.
For example, if normally I would do:

 while [ true ]; do zpool status | head -n10 ; sleep 10; done 
 while [ true ]; do df -h; sleep 60; done 
while [ true ]; do ls -al /tmp | head -n5 ; sleep 2; done 

Then I can do:

watch -n10 zpool status

Or:

watch -n60 df -h

Or

watch "ls -al /tmp | head -n5"

For my Dockers, and cloudinit with Ubuntu, my defaults are:

apt update; apt install htop mc ncdu strace git binutils

Raspberry Pi and osmc

RaspberryPiB+There is something that fascinates me from the new Raspberry Pi, and using it as a media center.
It is the fact that is a really small board.
That is powered by a micro USB 1000 mhA.
That is powered with Linux.

I had other media centers before but they were magnetic hard disk, closed in a proprietary system.
The media center I installed, with RaspBerry Pi+, is osmc, that is Open Source Media Center.

blog-carlesmateo-com-raspberry-pi-2-osmc-ssh-topSo I have full access via ssh to the RaspBerry, and as it used so few energy I have it all the day up.
Then, as it is a Linux box, and I have full access, and I’ve around 546 MB RAM free, I can run as many background process as I want.
Do I want to be a jump point for my VPN? Let’s go.
Do I want to have some monitoring processes over few websites? Let’s do it!.

I’m really happy about having a so tiny, so few energy consuming, full Linux, being my media center and whatever I want to it to do.

I must say that is wonderful having SSH and a network interface. Ok, it’s 10/100 Mbps, not Gigabit, but it is enough to allow me to copy new files in background to the USB stick via SFTP while reproducing at FullHD Blueray MKV, files right. Also allows to mount network folders via NFS or SMB amd play from them. Copying via SFTP to the USB device is generally very slow -don’t be surprised to upload at 30 KB/s- so I recommend to set a NFS folder in the computer, with read access to the ip of the Raspberry. It’s very cool and plays totally smooth using the 100 Mbit ethernet connection. You can also configure a FTP in the Pi, that will be much faster than the SFTP.

The RaspBerry micro SD card has a performance of ~22 MB, that is enough to boot very quickly and to load programs quite fast. I have other microSD cards with Debian Jessie, and I load PHPStorm (Java based PHP IDE) quite fast.

It boots really fast, in case you stop and start it frequently.

It accepts my wired Mouse and Keyboard, and also wireless bluetooth.

I’m really in love with this small motherboard. :)

This tiny RaspBerry 2, has 4 cores at 900 Mhz.

The CPU announces (cat /proc/cpuinfo):

processor    : 3
model name    : ARMv7 Processor rev 5 (v7l)
BogoMIPS    : 38.40
Features    : half thumb fastmult vfp edsp neon vfpv3 tls vfpv4 idiva idivt vfpd32 lpae evtstrm
CPU implementer    : 0x41
CPU architecture: 7
CPU variant    : 0x0
CPU part    : 0xc07
CPU revision    : 5

As you see, it scores only 38.40 bogomips, compared to my tower desktop 6384.59, and my old laptop 2593.45, but it’s still beautiful.

Note: you cannot trust bogomips as a performance measurement, and in addition my computers are Intel based -so CISC architecture- while RasbBerry uses ARM processors that are RISC, that is a completely different architecture. I notice a very fluid speed, only I sense a bit slowliness in the process when I install new packages. When unpacking it feels slow, although it can perfectly be caused by the SSD card IO as well, so I installed iotop and monitorized the I/O while I was installing PHP5 :) . I got small writings up to 1,000 KB/sec, so 1 MB/s, with average of ~30-50KB writing operations, no iowait, while I was seeing with htop that the core unpacking was at 100 % of CPU, the other 3 were free, so my initial conclusion is that the bottleneck was on the CPU. Still happy about my little gadget. :)

The osmc image I installed comes with python 2.7.9 and Linux kernel 3.18.9 as uname -a shows:

Linux osmc 3.18.9-5-osmc #1 SMP PREEMPT Wed Mar 11 18:59:35 UTC 2015 armv7l GNU/Linux

It also comes with wget 1.16 and curl 7.38.0.

In fact the OSMC is based on the Debian Jessie distro.

The OSMC software also have upgrades, and Debian upgrades, that keep the Linux box up to date.

So that brings a lot of possibilities.

After a sudo apt-get update I was able to install htop, mc and apache2.

sudo apt-get install htop
sudo apt-get install iotop
sudo apt-get install iftop
sudo apt-get install mc
sudo apt-get install apache2
sudo apt-get install php5
sudo apt-get instlal ncdu

So it’s a lot of fun. :)

Note: Although a 1000mhA is enough (Raspberry Pi 2 needs around 700mhA) if you plan to plug a cheap case 2.5 hard disk without external power -just USB- it will not be enough. In this case I recommend buying a 2000mhA transformer for the Pi, or a external USB hub energy powered (2000mhA otherwise you risk energy from Raspbery + USB hub being to sufficient). If the disk has external power, then you’ll have no probem. Personaly I use USB sticks.

When I had my incubator of Start ups some years ago, one of my Start up project was embedding motherboards within screens, and offering the ability to play videos, images, even flash games and animations, and manage and update everything and update contents for a groups of players from the Internet, or based on time triggers. I was finalist for selling my product to a enormous multinational, it was close, but finally a Korean company with a cheaper (and less powerful solution) won. At that time, it was 2004, motherboards were huge comparing to this tiny piece of hardware and I had to deal with different voltage, power consumption, heat dissipation, safety, etc…. so I’m really in love with this tiny piece hardware that doesn’t need even a ventilator or a big dissipation mechanism.