Notes on 2017-03-26 18:57 CEST – Unix time: 1490547518 :
- As several of you have noted, it would be much better to use a random value, for example, read by disk. This will be an improvement done in the next benchmark. Good suggestion thanks.
- Due to my lack of time it took more than expected updating the article. I was in a long process with google, and now I’m looking for a new job.
- I note that most of people doesn’t read the article and comment about things that are well indicated on it. Please before posting, read, otherwise don’t be surprise if the comment is not published. I’ve to keep the blog clean of trash.
- I’ve left out few comments cause there were disrespectful. Mediocrity is present in the society, so simply avoid publishing comments that lack the basis of respect and good education. If a comment brings a point, under the point of view of Engineering, it is always published.
Thanks.
(This article was last updated on 2015-08-26 15:45 CEST – Unix time: 1440596711. See changelog at bottom)
One may think that Assembler is always the fastest, but is that true?.
If I write a code in Assembler in 32 bit instead of 64 bit, so it can run in 32 and 64 bit, will it be faster than the code that a dynamic compiler is optimizing in execution time to benefit from the architecture of my computer?.
What if a future JIT compiler is able to use all the cores to execute a single thread developed program?.
Are PHP, Python, or Ruby fast comparing to C++?. Does Facebook Hip Hop Virtual machine really speeds PHP execution?.
This article shows some results and shares my conclusions. It is as a base to discuss with my colleagues. Is not an end, we are always doing tests, looking for the edge, and looking at the root of the things in detail. And often things change from one version to the other. This article shows not an absolute truth, but brings some light into interesting aspects.
It could show the performance for the certain case used in the test, although generic core instructions have been selected. Many more tests are necessary, and some functions differ in the performance. But this article is a necessary starting for the discussion with my IT-extreme-lover friends and a necessary step for the next upcoming tests.
It brings very important data for Managers and Decision Makers, as choosing the adequate performance language can save millions in hardware (specially when you use the Cloud and pay per hour of use) or thousand hours in Map Reduce processes.
Acknowledgements and thanks
Credit for the great Eduard Heredia, for porting my C source code to:
And for the nice discussions of the results, an on the optimizations and dynamic vs static compilers.
Thanks to Juan Carlos Moreno, CTO of ECManaged Cloud Software for suggesting adding Python and Ruby to the languages tested when we discussed my initial results.
Thanks to Joel Molins for the interesting discussions on Java performance and garbage collection.
Thanks to Cliff Click for his wonderful article on Java vs C performance that I found when I wanted to confirm some of my results and findings.
I was inspired to do my own comparisons by the benchmarks comparing different framework by techempower. It is amazing to see the results of the tests, like how C++ can serialize JSon 1,057,793 times per second and raw PHP only 180,147 (17%).
For the impatients
I present the results of the tests, and the conclusions, for those that doesn’t want to read about the details. For those that want to examine the code, and the versions of every compiler, and more in deep conclusions, this information is provided below.
Results
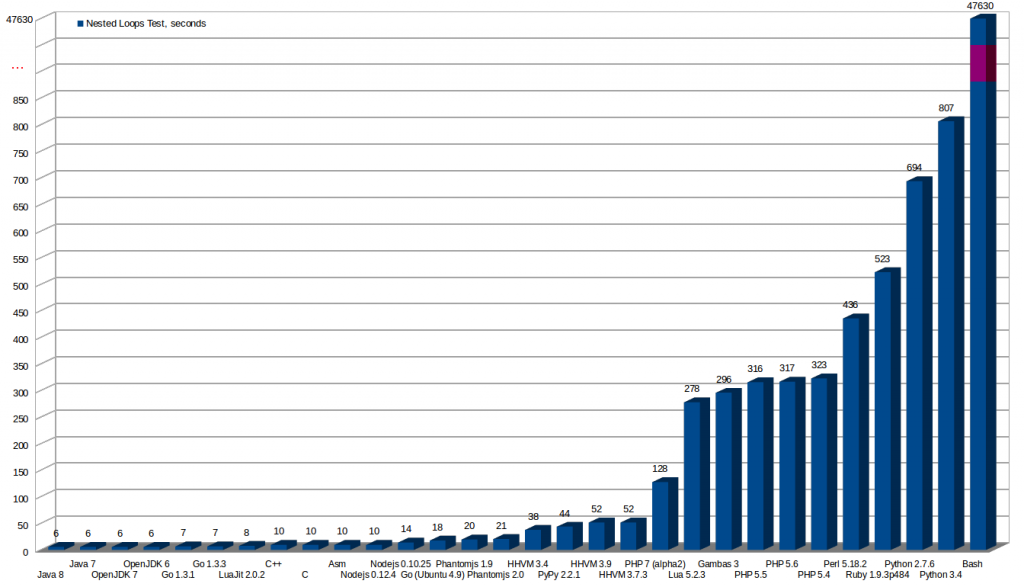
This image shows the results of the tests with every language and compiler.
All the tests are invoked from command line. All the tests use only one core. No tests for the web or frameworks have been made, are another scenarios worth an own article.
More seconds means a worst result. The worst is Bash, that I deleted from the graphics, as the bar was crazily high comparing to others.
* As later is discussed my initial Assembler code was outperformed by C binary because the final Assembler code that the compiler generated was better than mine.
After knowing why (later in this article is explained in detail) I could have reduced it to the same time than the C version as I understood the improvements made by the compiler.

Table of times:
| Seconds executing |
Language |
Compiler used |
Version |
| 6 s. |
Java |
Oracle Java |
Java JDK 8 |
| 6 s. |
Java |
Oracle Java |
Java JDK 7 |
| 6 s. |
Java |
Open JDK |
OpenJDK 7 |
| 6 s. |
Java |
Open JDK |
OpenJDK 6 |
| 7 s. |
Go |
Go |
Go v.1.3.1 linux/amd64 |
| 7 s. |
Go |
Go |
Go v.1.3.3 linux/amd64 |
| 8 s. |
Lua |
LuaJit |
Luajit 2.0.2 |
| 10 s. |
C++ |
g++ |
g++ (Ubuntu 4.8.2-19ubuntu1) 4.8.2 |
| 10 s. |
C |
gcc |
gcc (Ubuntu 4.8.2-19ubuntu1) 4.8.2 |
10 s.
(* first version was 13 s. and then was optimized) |
Assembler |
nasm |
NASM version 2.10.09 compiled on Dec 29 2013 |
| 10 s. |
Nodejs |
nodejs |
Nodejs v0.12.4 |
| 14 s. |
Nodejs |
nodejs |
Nodejs v0.10.25 |
| 18 s. |
Go |
Go |
go version xgcc (Ubuntu 4.9-20140406-0ubuntu1) 4.9.0 20140405 (experimental) [trunk revision 209157] linux/amd64 |
| 20 s. |
Phantomjs |
Phantomjs |
phantomjs 1.9.0 |
| 21 s. |
Phantomjs |
Phantomjs |
phantomjs 2.0.1-development |
| 38 s. |
PHP |
Facebook HHVM |
HipHop VM 3.4.0-dev (rel) |
| 44 s. |
Python |
Pypy |
Pypy 2.2.1 (Python 2.7.3 (2.2.1+dfsg-1, Nov 28 2013, 05:13:10)) |
| 52 s. |
PHP |
Facebook HHVM |
HipHop VM 3.9.0-dev (rel) |
| 52 s. |
PHP |
Facebook HHVM |
HipHop VM 3.7.3 (rel) |
| 128 s. |
PHP |
PHP |
PHP 7.0.0alpha2 (cli) (built: Jul 3 2015 15:30:23) |
| 278 s. |
Lua |
Lua |
Lua 2.5.3 |
| 294 s. |
Gambas3 |
Gambas3 |
3.7.0 |
| 316 s. |
PHP |
PHP |
PHP 5.5.9-1ubuntu4.3 (cli) (built: Jul 7 2014 16:36:58) |
| 317 s. |
PHP |
PHP |
PHP 5.6.10 (cli) (built: Jul 3 2015 16:13:11) |
| 323 s. |
PHP |
PHP |
PHP 5.4.42 (cli) (built: Jul 3 2015 16:24:16) |
| 436 s. |
Perl |
Perl |
Perl 5.18.2 |
| 523 s. |
Ruby |
Ruby |
ruby 1.9.3p484 (2013-11-22 revision 43786) [x86_64-linux] |
| 694 s. |
Python |
Python |
Python 2.7.6 |
| 807 s. |
Python |
Python |
Python 3.4.0 |
| 47630 s. |
Bash |
|
GNU bash, version 4.3.11(1)-release (x86_64-pc-linux-gnu) |
Conclusions and Lessons Learnt
- There are languages that will execute faster than a native Assembler program, thanks to the JIT Compiler and to the ability to optimize the program at runtime for the architecture of the computer running the program (even if there is a small initial penalty of around two seconds from JIT when running the program, as it is being analysed, is it more than worth in our example)
- Modern Java can be really fast in certain operations, it is the fastest in this test, thanks to the use of JIT Compiler technology and a very good implementation in it
- Oracle’s Java and OpenJDK shows no difference in performance in this test
- Script languages really sucks in performance. Python, Perl and Ruby are terribly slow. That costs a lot of money if you Scale as you need more Server in the Cloud
- JIT compilers for Python: Pypy, and for Lua: LuaJit, make them really fly. The difference is truly amazing
- The same language can offer a very different performance using one version or another, for example the go that comes from Ubuntu packets and the last version from official page that is faster, or Python 3.4 is much slower than Python 2.7 in this test
- Bash is the worst language for doing the loop and inc operations in the test, lasting for more than 13 hours for the test
- From command line PHP is much faster than Python, Perl and Ruby
- Facebook Hip Hop Virtual Machine (HHVM) improves a lot PHP’s speed
- It looks like the future of compilers is JIT.
- Assembler is not always the fastest when executed. If you write a generic Assembler program with the purpose of being able to run in many platforms you’ll not use the most powerful instructions specific of an architecture, and so a JIT compiler can outperform your code. An static compiler can also outperform your code with very clever optimizations. People that write the compilers are really good. Unless you’re really brilliant with Assembler probably a C/C++ code beats the performance of your code. Even if you’re fantastic with Assembler it could happen that a JIT compiler notices that some executions can be avoided (like code not really used) and bring magnificent runtime optimizations. (for example a near JMP is much more less costly than a far JMP Assembler instruction. Avoiding dead code could result in a far JMP being executed as near JMP, saving many cycles per loop)
- Optimizations really needs people dedicated to just optimizations and checking the speed of the newly added code for the running platforms
- Node.js was a big surprise. It really performed well. It is promising. New version performs even faster
- go is promising. Similar to C, but performance is much better thanks to deciding at runtime if the architecture of the computer is 32 or 64 bit, a very quick compilation at launch time, and it compiling to very good assembler (that uses the 64 bit instructions efficiently, for example)
- Gambas 3 performed surprisingly fast. Better than PHP
- You should be careful when using C/C++ optimization -O3 (and -O2) as sometimes it doesn’t work well (bugs) or as you may expect, for example by completely removing blocks of code if the compiler believes that has no utility (like loops)
- Perl performance really change from using a for style or another. (See Perl section below)
- Modern CPUs change the frequency to save energy. To run the tests is strictly recommended to use a dedicated machine, disabling the CPU governor and setting a frequency for all the cores, booting with a text only live system, without background services, not mounting disks, no swap, no network
(Please, before commenting read completely the article )
Explanations in details
Obviously an statically compiled language binary should be faster than an interpreted language.
C or C++ are much faster than PHP. And good code machine is much faster of course.
But there are also other languages that are not compiled as binary and have really fast execution.
For example, good Web Java Application Servers generate compiled code after the first request. Then it really flies.
For web C# or .NET in general, does the same, the IIS Application Server creates a native DLL after the first call to the script. And after this, as is compiled, the page is really fast.
With C statically linked you could generate binary code for a particular processor, but then it won’t work in other processors, so normally we write code that will work in all the processors at the cost of not using all the performance of the different CPUs or use another approach and we provide a set of different binaries for the different architectures. A set of directives doing one thing or other depending on the platform detected can also be done, but is hard, long and tedious job with a lot of special cases treatment. There is another approach that is dynamic linking, where certain things will be decided at run time and optimized for the computer that is running the program by the JIT (Just-in-time) Compiler.
Java, with JIT is able to offer optimizations for the CPU that is running the code with awesome results. And it is able to optimize loops and mathematics operations and outperform C/C++ and Assembler code in some cases (like in our tests) or to be really near in others. It sounds crazy but nowadays the JIT is able to know the result of several times executed blocks of code and to optimize that with several strategies, speeding the things incredible and to outperform a code written in Assembler. Demonstrations with code is provided later.
A new generation has grown knowing only how to program for the Web. Many of them never saw Assembler, neither or barely programmed in C++.
None of my Senior friends would assert that a technology is better than another without doing many investigations before. We are serious. There is so much to take in count, so much to learn always, that one has to be sure that is not missing things before affirming such things categorically. If you want to be taken seriously, you have to take many things in count.
Environment for the tests
Hardware and OS
Intel(R) Core(TM) i7-4770S CPU @ 3.10GHz with 32 GB RAM and SSD Disk.
Ubuntu Desktop 14.04 LTS 64 bit
Software base and compilers
PHP versions
Shipped with my Ubuntu distribution:
php -v
PHP 5.5.9-1ubuntu4.3 (cli) (built: Jul  7 2014 16:36:58)
Copyright (c) 1997-2014 The PHP Group
Zend Engine v2.5.0, Copyright (c) 1998-2014 Zend Technologies
with Zend OPcache v7.0.3, Copyright (c) 1999-2014, by Zend Technologies
Compiled from sources:
PHP 5.6.10 (cli) (built: Jul  3 2015 16:13:11)
Copyright (c) 1997-2015 The PHP Group
Zend Engine v2.6.0, Copyright (c) 1998-2015 Zend Technologies
PHP 5.4.42 (cli) (built: Jul  3 2015 16:24:16)
Copyright (c) 1997-2014 The PHP Group
Zend Engine v2.4.0, Copyright (c) 1998-2014 Zend Technologies
Java 8 version
java -showversion
java version "1.8.0_05"
Java(TM) SE Runtime Environment (build 1.8.0_05-b13)
Java HotSpot(TM) 64-Bit Server VM (build 25.5-b02, mixed mode)
C++ version
g++ -v
Using built-in specs.
COLLECT_GCC=g++
COLLECT_LTO_WRAPPER=/usr/lib/gcc/x86_64-linux-gnu/4.8/lto-wrapper
Target: x86_64-linux-gnu
Configured with: ../src/configure -v --with-pkgversion='Ubuntu 4.8.2-19ubuntu1' --with-bugurl=file:///usr/share/doc/gcc-4.8/README.Bugs --enable-languages=c,c++,java,go,d,fortran,objc,obj-c++ --prefix=/usr --program-suffix=-4.8 --enable-shared --enable-linker-build-id --libexecdir=/usr/lib --without-included-gettext --enable-threads=posix --with-gxx-include-dir=/usr/include/c++/4.8 --libdir=/usr/lib --enable-nls --with-sysroot=/ --enable-clocale=gnu --enable-libstdcxx-debug --enable-libstdcxx-time=yes --enable-gnu-unique-object --disable-libmudflap --enable-plugin --with-system-zlib --disable-browser-plugin --enable-java-awt=gtk --enable-gtk-cairo --with-java-home=/usr/lib/jvm/java-1.5.0-gcj-4.8-amd64/jre --enable-java-home --with-jvm-root-dir=/usr/lib/jvm/java-1.5.0-gcj-4.8-amd64 --with-jvm-jar-dir=/usr/lib/jvm-exports/java-1.5.0-gcj-4.8-amd64 --with-arch-directory=amd64 --with-ecj-jar=/usr/share/java/eclipse-ecj.jar --enable-objc-gc --enable-multiarch --disable-werror --with-arch-32=i686 --with-abi=m64 --with-multilib-list=m32,m64,mx32 --with-tune=generic --enable-checking=release --build=x86_64-linux-gnu --host=x86_64-linux-gnu --target=x86_64-linux-gnu
Thread model: posix
gcc version 4.8.2 (Ubuntu 4.8.2-19ubuntu1)
Gambas 3
gbr3 --version
3.7.0
Go (downloaded from google)
go version
go version go1.3.1 linux/amd64
Go (Ubuntu packages)
go version
go version xgcc (Ubuntu 4.9-20140406-0ubuntu1) 4.9.0 20140405 (experimental) [trunk revision 209157] linux/amd64
Nasm
nasm -v
NASM version 2.10.09 compiled on Dec 29 2013
Lua
lua -v
Lua 5.2.3 Copyright (C) 1994-2013 Lua.org, PUC-Rio
Luajit
luajit -v
LuaJIT 2.0.2 -- Copyright (C) 2005-2013 Mike Pall. http://luajit.org/
Nodejs
Installed with apt-get install nodejs:
nodejs --version
v0.10.25
Installed by compiling the sources:
node --version
v0.12.4
Phantomjs
Installed with apt-get install phantomjs:
phantomjs --version
1.9.0
Compiled from sources:
/path/phantomjs --version
2.0.1-development
Python 2.7
python --version
Python 2.7.6
Python 3
python3 --version
Python 3.4.0
Perl
perl -version
This is perl 5, version 18, subversion 2 (v5.18.2) built for x86_64-linux-gnu-thread-multi
(with 41 registered patches, see perl -V for more detail)
Bash
bash --version
GNU bash, version 4.3.11(1)-release (x86_64-pc-linux-gnu)
Copyright (C) 2013 Free Software Foundation, Inc.
License GPLv3+: GNU GPL version 3 or later <http://gnu.org/licenses/gpl.html>

This is free software; you are free to change and redistribute it.
There is NO WARRANTY, to the extent permitted by law.
Test: Time required for nested loops
This is the first sample. It is an easy-one.
The main idea is to generate a set of nested loops, with a simple counter inside.
When the counter reaches 51 it is set to 0.
This is done for:
- Preventing overflow of the integer if growing without control
- Preventing the compiler from optimizing the code (clever compilers like Java or gcc with -O3 flag for optimization, if it sees that the var is never used, it will see that the whole block is unnecessary and simply never execute it)
Doing only loops, the increment of a variable and an if, provides us with basic structures of the language that are easily transformed to Assembler. We want to avoid System calls also.
This is the base for the metrics on my Cloud Analysis of Performance cmips.net project.
Here I present the times for each language, later I analyze the details and the code.
Take in count that this code only executes in one thread / core.
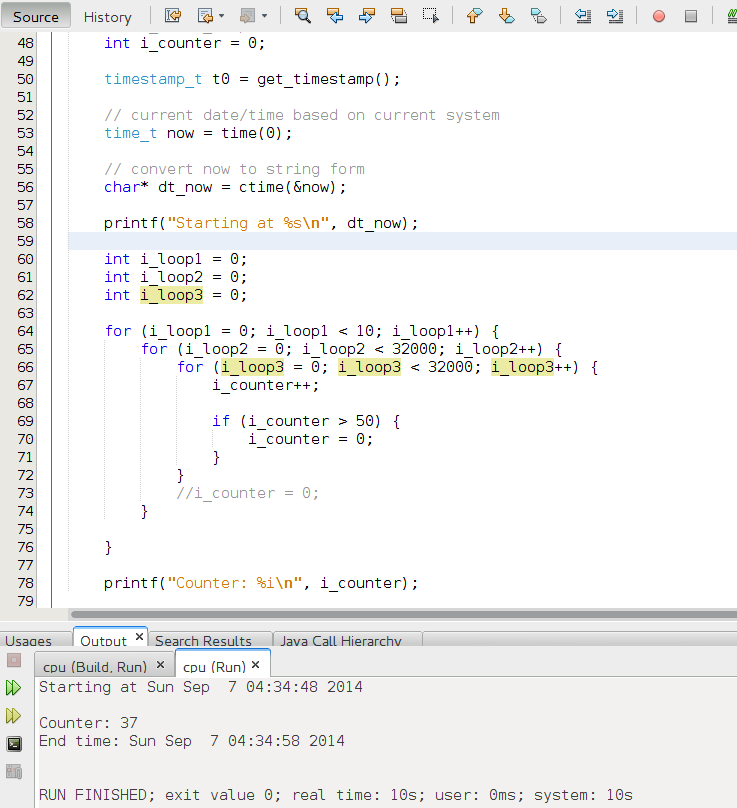
C++
C++ result, it takes 10 seconds.
Code for the C++:
/*
* File:   main.cpp
* Author: Carles Mateo
*
* Created on August 27, 2014, 1:53 PM
*/

#include <cstdlib>
#include <iostream>
#include <stdio.h>
#include <stdlib.h>
#include <sys/time.h>
#include <ctime>

using namespace std;

typedef unsigned long long timestamp_t;

static timestamp_t get_timestamp()
{
    struct timeval now;
    gettimeofday (&now, NULL);
    return  now.tv_usec + (timestamp_t)now.tv_sec * 1000000;
}

int main(int argc, char** argv) {

    timestamp_t t0 = get_timestamp();

    // current date/time based on current system
    time_t now = time(0);

    // convert now to string form
    char* dt_now = ctime(&now);

    printf("Starting at %s\n", dt_now);

    int i_loop1 = 0;
    int i_loop2 = 0;
    int i_loop3 = 0;


    for (i_loop1 = 0; i_loop1 < 10; i_loop1++) {
        for (i_loop2 = 0; i_loop2 < 32000; i_loop2++) {
            for (i_loop3 = 0; i_loop3 < 32000; i_loop3++) {
                i_counter++;

                if (i_counter > 50) {
                    i_counter = 0;
                }
            }
            // If you want to test how the compiler optimizes that, remove the comment
            //i_counter = 0;
         }
     }

    // This is another trick to avoid compiler's optimization. To use the var somewhere
    printf("Counter: %i\n", i_counter);

    timestamp_t t1 = get_timestamp();
    double secs = (t1 - t0) / 1000000.0L;
    time_t now_end = time(0);

    // convert now to string form
    char* dt_now_end = ctime(&now_end);

    printf("End time: %s\n", dt_now_end);

    return 0;
}

You can try to remove the part of code that makes the checks:
                /* if (i_counter > 50) {
                    i_counter = 0;
                }*/
And the use of the var, later:
//printf("Counter: %i\n", i_counter);
Note: And adding a i_counter = 0; at the beginning of the loop to make sure that the counter doesn’t overflows. Then the C or C++ compiler will notice that this result is never used and so it will eliminate the code from the program, having as result and execution time of 0.0 seconds.
Java
The code in Java:
package cpu;

/**
 *
 * @author carles.mateo
 */
public class Cpu {

    /**
     * @param args the command line arguments
     */
    public static void main(String[] args) {

        int i_loop1 = 0;
        //int i_loop_main = 0;
        int i_loop2 = 0;
        int i_loop3 = 0;
        int i_counter = 0;

        String s_version = System.getProperty("java.version");

        System.out.println("Java Version: " + s_version);

        System.out.println("Starting cpu.java...");

        for (i_loop1 = 0; i_loop1 < 10; i_loop1++) {
                for (i_loop2 = 0; i_loop2 < 32000; i_loop2++) {
                    for (i_loop3 = 0; i_loop3 < 32000; i_loop3++) {
                        i_counter++;

                        if (i_counter > 50) {
                            i_counter = 0;
                        }
                    }
                }
        }

        System.out.println(i_counter);
        System.out.println("End");
    }

}
It is really interesting how Java, with JIT outperforms C++ and Assembler.
It takes only 6 seconds.

Go
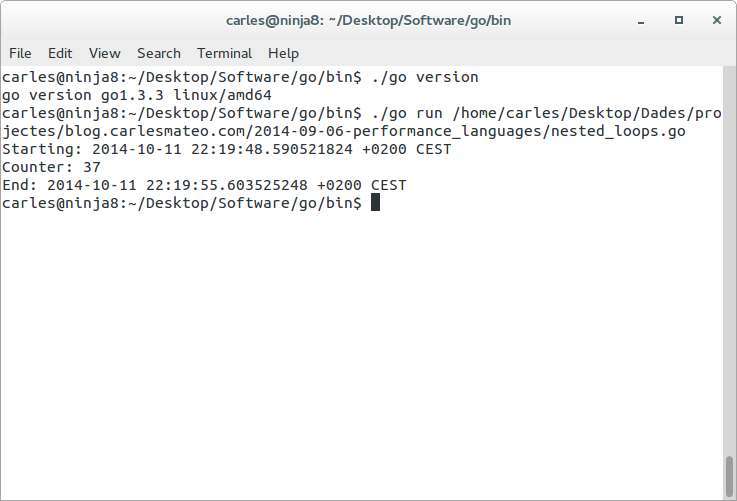
The case of Go is interesting because I saw a big difference from the go shipped with Ubuntu, and the the go I downloaded from http://golang.org/dl/. I downloaded 1.3.1 and 1.3.3 offering the same performance. 7 seconds.
 Source code for nested_loops.go
package main

import ("fmt"
        "time")

func main() {
   fmt.Printf("Starting: %s", time.Now().Local())
   var i_counter = 0;
   for i_loop1 := 0; i_loop1 < 10; i_loop1++ {
       for i_loop2 := 0; i_loop2 < 32000; i_loop2++ {
           for i_loop3 := 0; i_loop3 < 32000; i_loop3++ {
               i_counter++;
               if i_counter > 50 {
                   i_counter = 0;
               }
           }
       }
    }

   fmt.Printf("\nCounter: %#v", i_counter)
   fmt.Printf("\nEnd: %s\n", time.Now().Local())
}
Assembler
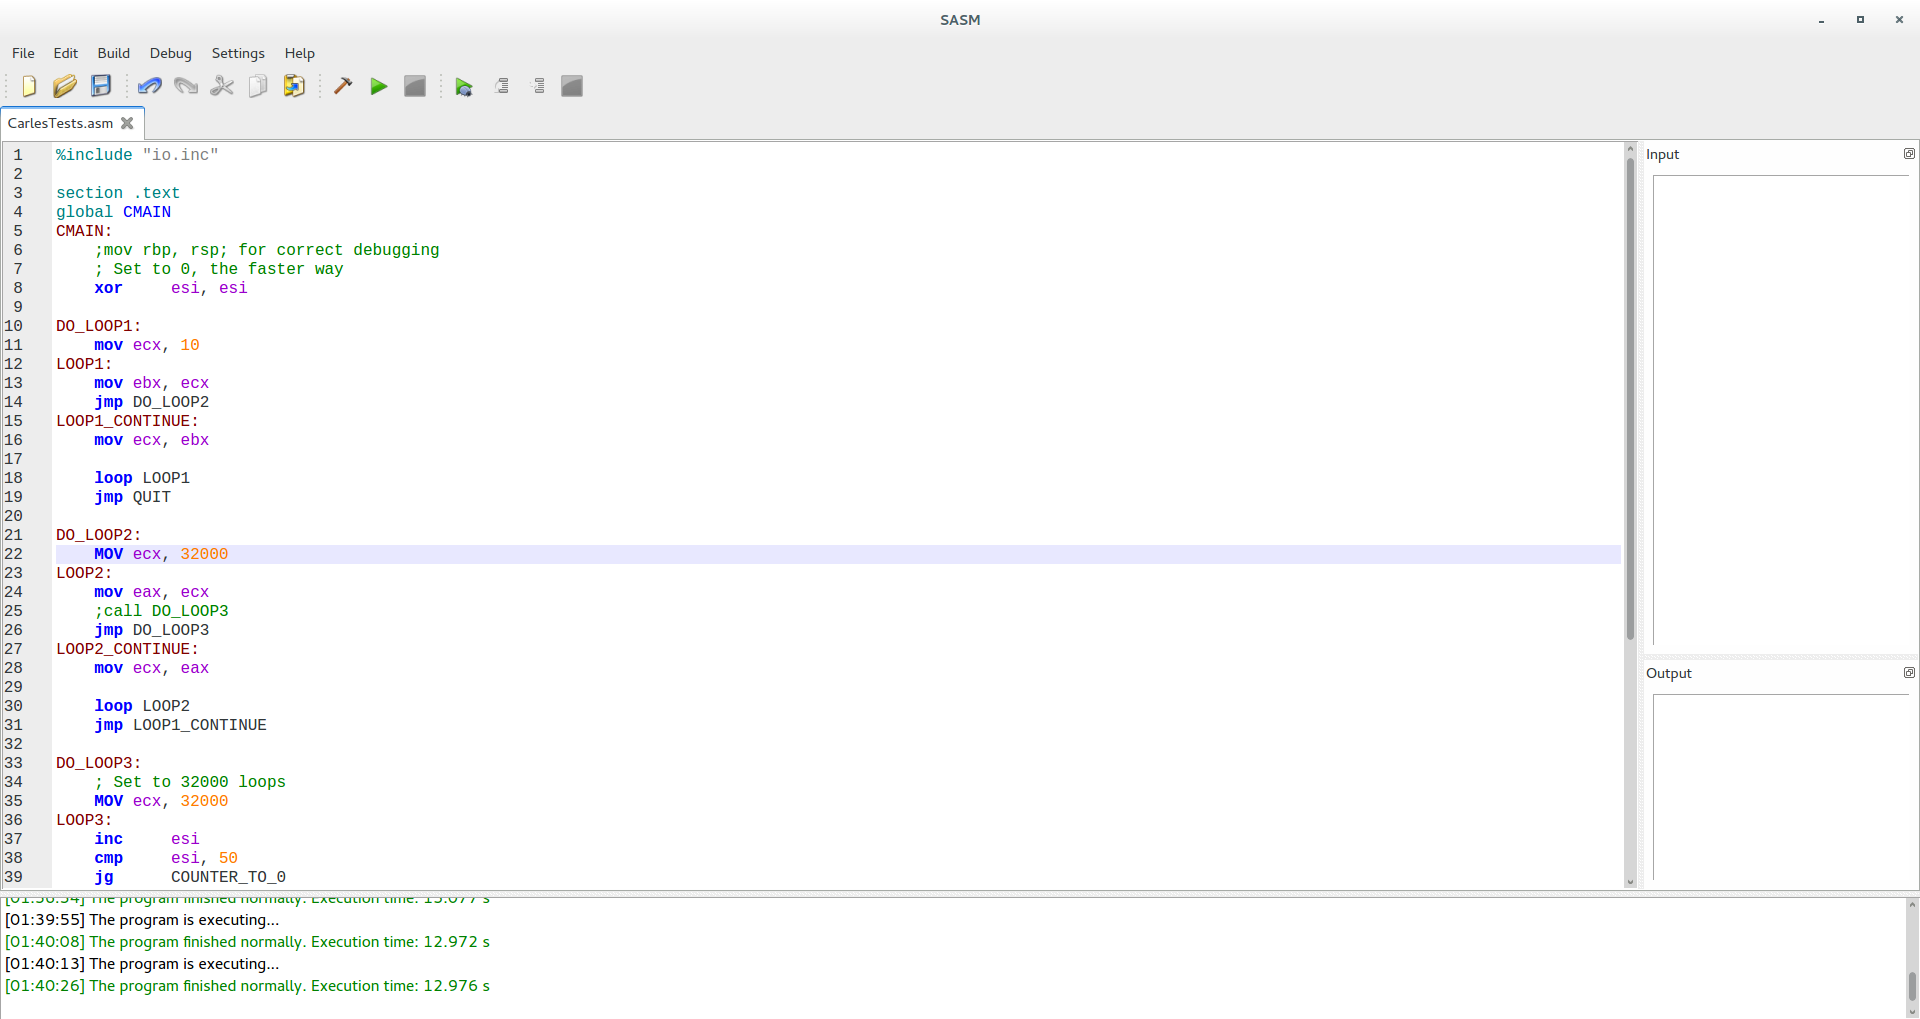
Here is the Assembler for Linux code, with SASM, that I created initially (bellow is optimized).
%include "io.inc"

section .text
global CMAIN
CMAIN:
    ;mov rbp, rsp; for correct debugging
    ; Set to 0, the faster way
    xor     esi, esi

DO_LOOP1:
    mov ecx, 10
LOOP1:
    mov ebx, ecx
    jmp DO_LOOP2
LOOP1_CONTINUE:
    mov ecx, ebx

    loop LOOP1
    jmp QUIT

DO_LOOP2:
    mov ecx, 32000
LOOP2:
    mov eax, ecx
    ;call DO_LOOP3
    jmp DO_LOOP3
LOOP2_CONTINUE:
    mov ecx, eax

    loop LOOP2
    jmp LOOP1_CONTINUE

DO_LOOP3:
    ; Set to 32000 loops
    MOV ecx, 32000
LOOP3:
    inc     esi
    cmp     esi, 50
    jg      COUNTER_TO_0
LOOP3_CONTINUE:

    loop LOOP3
    ;ret
    jmp LOOP2_CONTINUE

COUNTER_TO_0:
    ; Set to 0
    xor     esi, esi

    jmp LOOP3_CONTINUE

;    jmp QUIT

QUIT:
    xor eax, eax
    ret
It took 13 seconds to complete.
One interesting explanation on why binary C or C++ code is faster than Assembler, is because the C compiler generates better Assembler/binary code at the end. For example, the use of JMP is expensive in terms of CPU cycles and the compiler can apply other optimizations and tricks that I’m not aware of, like using faster registers, while in my code I use ebx, ecx, esi, etc… (for example, imagine that using cx is cheaper than using ecx or rcx and I’m not aware but the guys that created the Gnu C compiler are)
 To be sure of what’s going on I switched in the LOOP3 the JE and the JMP of the code, for groups of 50 instructions, INC ESI, one after the other and the time was reduced to 1 second.
(In C also was reduced even a bit more when doing the same)
To know what’s the translation of the C code into Assembler when compiled, you can do:
objdump --disassemble nested_loops
Look for the section main and you’ll get something like:
0000000000400470 <main>:
400470:    bf 0a 00 00 00           mov    $0xa,%edi
400475:    31 c9                    xor    %ecx,%ecx
400477:    be 00 7d 00 00           mov    $0x7d00,%esi
40047c:    0f 1f 40 00              nopl   0x0(%rax)
400480:    b8 00 7d 00 00           mov    $0x7d00,%eax
400485:    0f 1f 00                 nopl   (%rax)
400488:    83 c2 01                 add    $0x1,%edx
40048b:    83 fa 33                 cmp    $0x33,%edx
40048e:    0f 4d d1                 cmovge %ecx,%edx
400491:    83 e8 01                 sub    $0x1,%eax
400494:    75 f2                    jne    400488 <main+0x18>
400496:    83 ee 01                 sub    $0x1,%esi
400499:    75 e5                    jne    400480 <main+0x10>
40049b:    83 ef 01                 sub    $0x1,%edi
40049e:    75 d7                    jne    400477 <main+0x7>
4004a0:    48 83 ec 08              sub    $0x8,%rsp
4004a4:    be 34 06 40 00           mov    $0x400634,%esi
4004a9:    bf 01 00 00 00           mov    $0x1,%edi
4004ae:    31 c0                    xor    %eax,%eax
4004b0:    e8 ab ff ff ff           callq  400460 <__printf_chk@plt>
4004b5:    31 c0                    xor    %eax,%eax
4004b7:    48 83 c4 08              add    $0x8,%rsp
4004bb:    c3                       retq
Note: this is in the AT&T syntax and not in the Intel. That means that add $0x1,%edx is adding 1 to EDX registerg (origin, destination).
As you can see the C compiler has created a very differed Assembler version respect what I created.
For example at 400470 it uses EDI register to store 10, so to control the number of the outer loop.
It uses ESI to store 32000 (Hexadecimal 0x7D00), so the second loop.
And EAX for the inner loop, at 400480.
It uses EDX for the counter, and compares to 50 (Hexa 0x33) at 40048B.
In 40048E it uses the CMOVGE (Mov if Greater or Equal), that is an instruction that was introduced with the P6 family processors, to move the contents of ECX to EDX if it was (in the CMP) greater or equal to 50. As in 400475 a XOR ECX, ECX was performed, EXC contained 0.
And it cleverly used SUB and JNE (JNE means Jump if not equal and it jumps if ZF = 0, it is equivalent to JNZ Jump if not Zero).
It uses between 4 and 16 clocks, and the jump must be -128 to +127 bytes of the next instruction. As you see Jump is very costly.
Looks like the biggest improvement comes from the use of CMOVGE, so it saves two jumps that my original Assembler code was performing.
Those two jumps multiplied per 32000 x 32000 x 10 times, are a lot of Cpu clocks.
So, with this in mind, as this Assembler code takes 10 seconds, I updated the graph from 13 seconds to 10 seconds.
Lua
This is the initial code:
local i_counter = 0

local i_time_start = os.clock()

for i_loop1=0,9 do
    for i_loop2=0,31999 do
        for i_loop3=0,31999 do
            i_counter = i_counter + 1
            if i_counter > 50 then
                i_counter = 0
            end
        end
    end
end

local i_time_end = os.clock()
print(string.format("Counter: %i\n", i_counter))
print(string.format("Total seconds: %.2f\n", i_time_end - i_time_start))
In the case of Lua theoretically one could take great advantage of the use of local inside a loop, so I tried the benchmark with modifications to the loop:
for i_loop1=0,9 do
    for i_loop2=0,31999 do
        local l_i_counter = i_counter
        for i_loop3=0,31999 do
             l_i_counter = l_i_counter + 1
             if l_i_counter > 50 then
                 l_i_counter = 0
             end
        end
        i_counter = l_i_counter
    end
end
I ran it with LuaJit and saw no improvements on the performance.
Node.js
var s_date_time = new Date();
console.log('Starting: ' + s_date_time);

var i_counter = 0;

for (var $i_loop1 = 0; $i_loop1 < 10; $i_loop1++) {
   for (var $i_loop2 = 0; $i_loop2 < 32000; $i_loop2++) {
       for (var $i_loop3 = 0; $i_loop3 < 32000; $i_loop3++) {
           i_counter++;
           if (i_counter > 50) {
               i_counter = 0;
           }
       }
   }
}

var s_date_time_end = new Date();

console.log('Counter: ' + i_counter + '\n');

console.log('End: ' + s_date_time_end + '\n');
Execute with:
nodejs nested_loops.js
Phantomjs
The same code as nodejs adding to the end:
phantom.exit(0);
In the case of Phantom it performs the same in both versions 1.9.0 and 2.0.1-development compiled from sources.
PHP
The interesting thing on PHP is that you can write your own extensions in C, so you can have the easy of use of PHP and create functions that really brings fast performance in C, and invoke them from PHP.
<?php

$s_date_time = date('Y-m-d H:i:s');

echo 'Starting: '.$s_date_time."\n";

$i_counter = 0;

for ($i_loop1 = 0; $i_loop1 < 10; $i_loop1++) {
   for ($i_loop2 = 0; $i_loop2 < 32000; $i_loop2++) {
       for ($i_loop3 = 0; $i_loop3 < 32000; $i_loop3++) {
           $i_counter++;
           if ($i_counter > 50) {
               $i_counter = 0;
           }
       }
   }
}

$s_date_time_end = date('Y-m-d H:i:s');

echo 'End: '.$s_date_time_end."\n";
Facebook’s Hip Hop Virtual Machine is a very powerful alternative, that is JIT powered.
Downloading the code and compiling it is just easy, just:
git clone https://github.com/facebook/hhvm.git
cd hhvm
rm -r third-party
git submodule update --init --recursive
./configure
make
Or just grab precompiled packages from https://github.com/facebook/hhvm/wiki/Prebuilt%20Packages%20for%20HHVM
Python
from datetime import datetime
import time

print ("Starting at: " + str(datetime.now()))
s_unixtime_start = str(time.time())

i_counter = 0

# From 0 to 31999
for i_loop1 in range(0, 10):
    for i_loop2 in range(0,32000):
         for i_loop3 in range(0,32000):
             i_counter += 1
             if ( i_counter > 50 ) :
                 i_counter = 0

print ("Ending at: " + str(datetime.now()))
s_unixtime_end = str(time.time())

i_seconds = long(s_unixtime_end) - long(s_unixtime_start)
s_seconds = str(i_seconds)

print ("Total seconds:" + s_seconds)
Ruby
#!/usr/bin/ruby -w

time1 = Time.new

puts "Starting : " + time1.inspect

i_counter = 0;

for i_loop1 in 0..9
    for i_loop2 in 0..31999
        for i_loop3 in 0..31999
            i_counter = i_counter + 1
            if i_counter > 50
                i_counter = 0
            end
        end
    end
end

time1 = Time.new

puts "End : " + time1.inspect
Perl
The case of Perl was very interesting one.
This is the current code:
#!/usr/bin/env perl

print "$s_datetime Starting calculations...\n";
$i_counter=0;

$i_unixtime_start=time();

for my $i_loop1 (0 .. 9) {
    for my $i_loop2 (0 .. 31999) {
        for my $i_loop3 (0 .. 31999) {
            $i_counter++;
            if ($i_counter > 50) {
                $i_counter = 0;
            }
        }
    }
}

$i_unixtime_end=time();

$i_seconds=$i_unixtime_end-$i_unixtime_start;

print "Counter: $i_counter\n";
print "Total seconds: $i_seconds";
But before I created one, slightly different, with the for loops like in the C style:
#!/usr/bin/env perl

$i_counter=0;

$i_unixtime_start=time();

for (my $i_loop1=0; $i_loop1 < 10; $i_loop1++) {
    for (my $i_loop2=0; $i_loop2 < 32000; $i_loop2++) {
        for (my $i_loop3=0; $i_loop3 < 32000; $i_loop3++) {
            $i_counter++;
            if ($i_counter > 50) {
                $i_counter = 0;
            }
        }
    }
}

$i_unixtime_end=time();

$i_seconds=$i_unixtime_end-$i_unixtime_start;

print "Total seconds: $i_seconds";
I repeated this test, with the same version of Perl, due to the comment of a reader (thanks mpapec) that told:
“In this particular case perl style loops are about 45% faster than original code (v5.20)”
And effectively and surprisingly the time passed from 796 seconds to 436 seconds.
So graphics are updated to reflect the result of 436 seconds.
Bash
#!/bin/bash
echo "Bash version ${BASH_VERSION}..."
date

let "s_time_start=$(date +%s)"
let "i_counter=0"

for i_loop1 in {0..9}
do
     echo "."
     date
     for i_loop2 in {0..31999}
     do
         for i_loop3 in {0..31999}
         do
             ((i_counter++))
             if [[ $i_counter > 50 ]]
             then
                 let "i_counter=0"
             fi
         done
#((var+=1))
#((var=var+1))
#((var++))
#let "var=var+1"
#let "var+=1"
#let "var++"
     done
done

let "s_time_end=$(date +%2)"

let "s_seconds = s_time_end - s_time_start"
echo "Total seconds: $s_seconds"

# Just in case it overflows
date
Gambas 3
Gambas is a language and an IDE to create GUI applications for Linux.
It is very similar to Visual Basic, but better, and it is not a clone.
I created a command line application and it performed better than PHP. There has been done an excellent job with the compiler.
 Note: in the screenshot the first test ran for few seconds more than in the second. This was because I deliberately put the machine under some load and I/O during the tests. The valid value for the test, confirmed with more iterations is the second one, done under the same conditions (no load) than the previous tests.
' Gambas module file MMain.module

Public Sub Main()

    ' @author Carles Mateo http://blog.carlesmateo.com

    Dim i_loop1 As Integer
    Dim i_loop2 As Integer
    Dim i_loop3 As Integer
    Dim i_counter As Integer
    Dim s_version As String

    i_loop1 = 0
    i_loop2 = 0
    i_loop3 = 0
    i_counter = 0

    s_version = System.Version

    Print "Performance Test by Carles Mateo blog.carlesmateo.com"
    Print "Gambas Version: " & s_version

    Print "Starting..." & Now()

    For i_loop1 = 0 To 9
        For i_loop2 = 0 To 31999
            For i_loop3 = 0 To 31999
                i_counter = i_counter + 1

                If (i_counter > 50) Then
                    i_counter = 0
                Endif
            Next
        Next
    Next

    Print i_counter
    Print "End " & Now()

End
Changelog
2015-08-26 15:45
Thanks to the comment of a reader, thanks Daniel, pointing a mistake. The phrase I mentioned was on conclusions, point 14, and was inaccurate. The original phrase told “go is promising. Similar to C, but performance is much better thanks to the use of JIT“. The allusion to JIT is incorrect and has been replaced by this: “thanks to deciding at runtime if the architecture of the computer is 32 or 64 bit, a very quick compilation at launch time, and it compiling to very good assembler (that uses the 64 bit instructions efficiently, for example)”
2015-07-17 17:46
Benchmarked Facebook HHVM 3.9 (dev., the release date is August 3 2015) and HHVM 3.7.3, they take 52 seconds.
Re-benchmarked Facebook HHVM 3.4, before it was 72 seconds, it takes now 38 seconds. I checked the screen captures from 2014 to discard an human error. Looks like a turbo frequency issue on the tests computer, with the CPU governor making it work bellow the optimal speed or a CPU-hungry/IO process that triggered during the tests and I didn’t detect it. Thinking about forcing a fixed CPU speed for all the cores for the tests, like 2.4 Ghz and booting a live only text system without disk access and network to prevent Ubuntu launching processes in the background.
2015-07-05 13:16
Added performance of Phantomjs 1.9.0 installed via apt-get install phantomjs in Ubuntu, and Phantomjs 2.0.1-development.
Added performance of nodejs 0.12.04 (compiled).
Added bash to the graphic. It has so bad performance that I had to edit the graphic to fit in (color pink) in order prevent breaking the scale.
2015-07-03 18:32
Added benchmarks for PHP 7 alpha 2, PHP 5.6.10 and PHP 5.4.42.
2015-07-03 15:13
Thanks to the contribution of a reader (thanks mpapec!) I tried with Perl for style, resulting in passing from 796 seconds to 436 seconds.
(I used the same Perl version: Perl 5.18.2)
Updated test value for Perl.
Added new graphics showing the updated value.
Thanks to the contribution of a reader (thanks junk0xc0de!) added some additional warnings and explanations about the dangers of using -O3 (and -O2) if C/C++.
Updated the Lua code, to print i_counter and do the if i_counter > 50
This makes it take a bit longer, few cents, but passing from 7.8 to 8.2 seconds.
Updated graphics.

