Tag Archives: Memory

cmemgzip Python tool to compress files in memory when there is no free space on the disk

Rationale

All the Operation Engineers and SREs that work with systems have found the situation of having a Server with the disk full of logs and needing to keep those logs, and at the same time needing the system to keep running.

This is an uncomfortable situation.

I remember when I was being interviewed in Facebook, in Menlo Park, for a SDM position in the SRE (Software Development Manager) back in 2013-2014. They asked me about a situation where they have the Server disk full, and they deleted a big log file from Apache, but the space didn’t come back. They told me that nobody ever was able to solve this.

I explained that what happened is that Apache still had the fd (file descriptor), and that he will try to write to end of that file, even if they removed the huge log file with rm command, from the system they will not get back any free space. I explained that the easiest solution was to stop apache. They agreed and asked me how we could do the same without restarting the Webserver and I said that manipulating the file descriptors under /proc. They told me what I was the first person to solve this.

How it works

Basically cmemgzip will read a file, as binary, and will load it completely in to Memory.

Then it will compress it also in Memory. Then it will release the memory used to keep the original, will validate write permissions on the folder, will check that the compressed file is smaller than the original, and will delete the original and, using the new space now available in disk, write the compressed and smaller version of the file in gzip format.

Since version 0.3 you can specify an amount of memory that you will use for the blocks of data read from the file, so you can limit greatly the memory usage and compress files much more bigger than the amount of memory.

If for whatever reason the gz version cannot be written to disk, you’ll be asked for another route.

I mentioned before about File Descriptors, and programs that may keep those files open.

So my advice here, is that if you have to compress Apache logs or logs from a multi-thread program, and disk is full, and several instances may be trying to write to the log file: to stop Apache service if you can, and then run cmemgzip. I want to add it the future to auto-release open fd, but this is delicate and requires a lot of time to make sure it will be reliable in all the circumstances and will obey the exact desires of the SRE realizing the operation, without unexpected undesired side effects. It can be implemented with a new parameter, so the SysAdmin will know what is requesting.

Get the source code

You can decompress it later with gzip/gunzip.

So about cmemgzip you can git clone the project from here:

https://gitlab.com/carles.mateo/cmemgzip

git clone https://gitlab.com/carles.mateo/cmemgzip

The README.md is very clear:

https://gitlab.com/carles.mateo/cmemgzip/-/blob/master/README.md

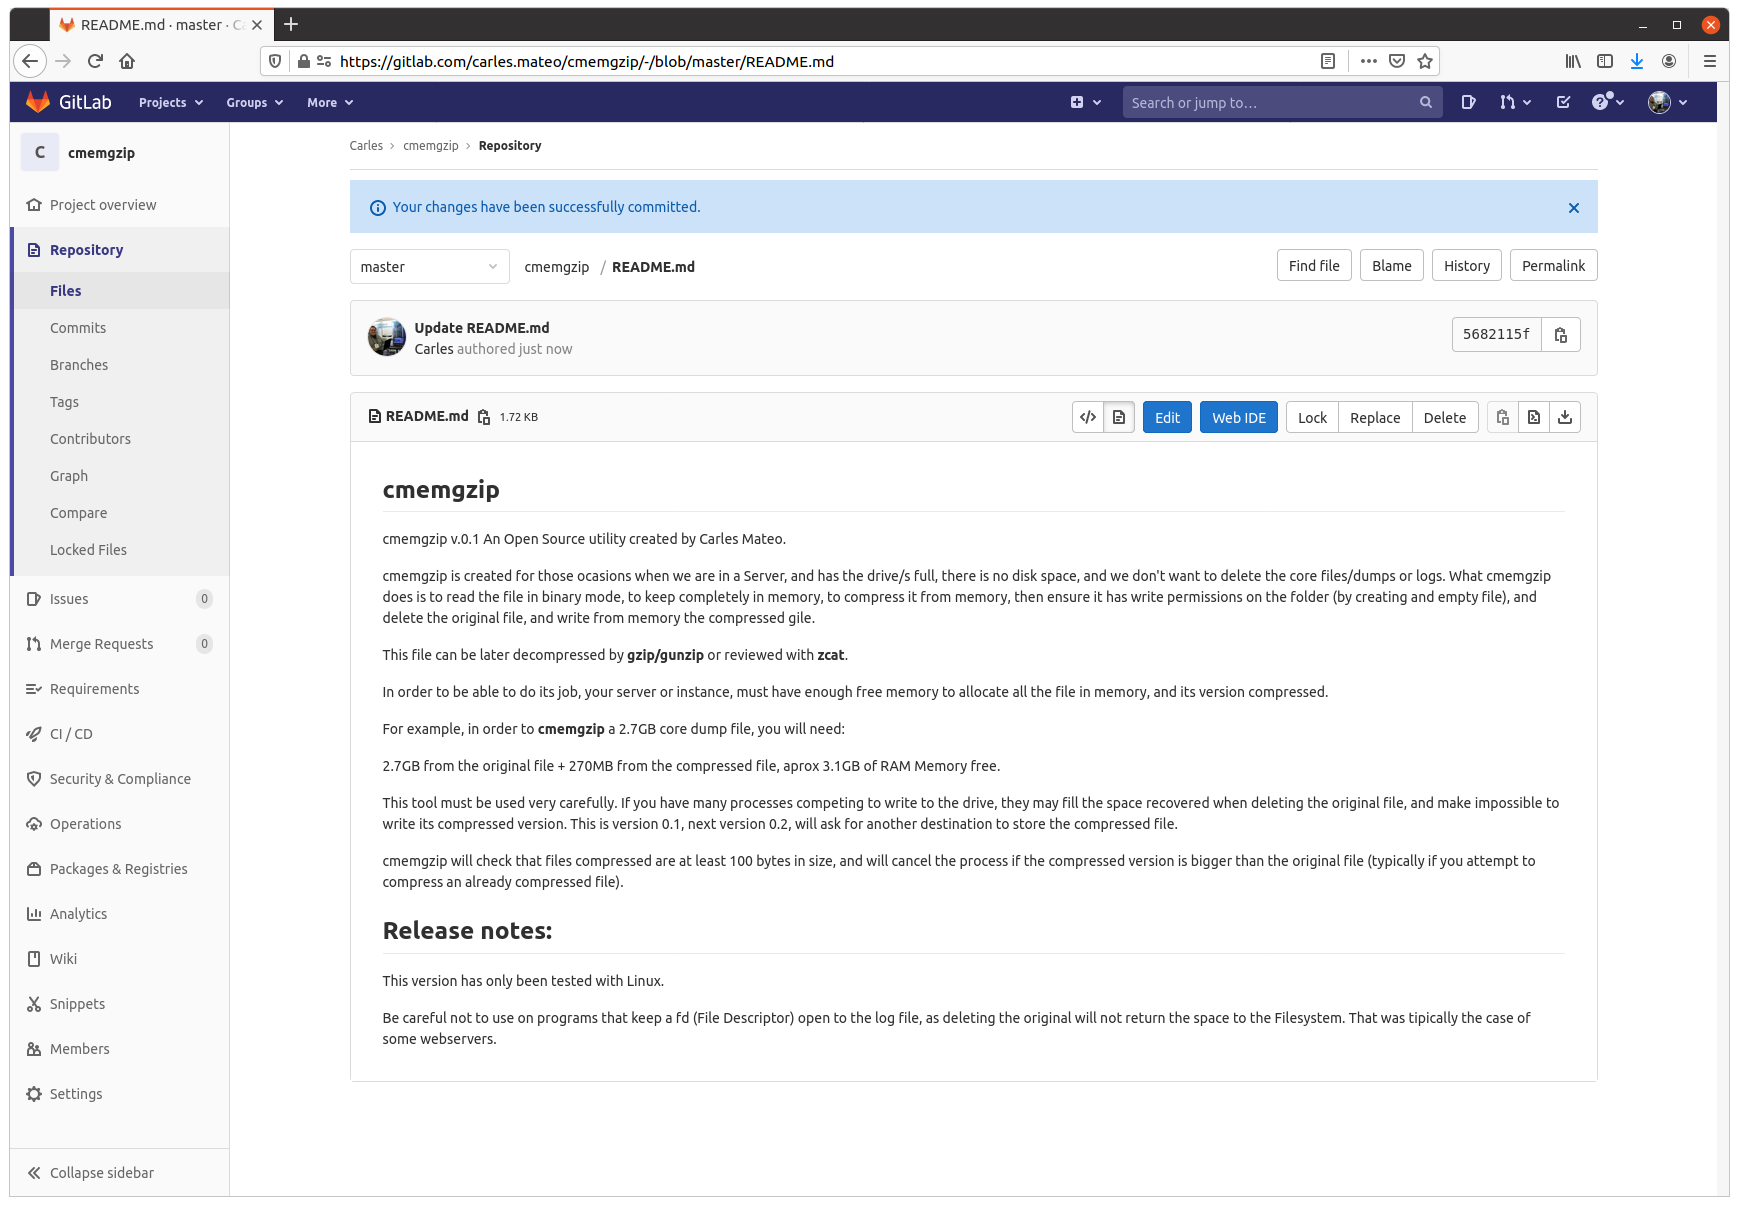
The program is written in Python 3, and I gave it License MIT, so you can use it and the Open Source really with Freedom.

Do you want to test in other platforms?

This is a version 0.3.

I have only tested it in:

  • Ubuntu 20.04 LTS Linux for x64
  • Ubuntu 20.04 LTS 64 bits under Raspberry Pi 4 (ARM Processors)
  • Windows 10 Professional x64
  • Mac OS X
  • CentOS

It should work in all the platforms supporting Python, but if you want to contribute testing for other platforms, like Windows 32 bit, Solaris or BSD, let me know.

Alternative solutions

You can create a ramdisk and compress it to there. Then delete the original and move the compressed file from ramdisk to the hard drive, and unload the ramdrive Kernel Module. However we find very often with this problems in Docker containers or in instances that don’t have the Kernel module installed. Is much more easier to run cmemgzip.

Another strategy you can do for the future is to have a folder based on ZFS and compression. Again, ZFS should be installed on the system, and this doesn’t happen with Docker containers.

cmemgzip is designed to work when there is no free space, if there is free space, you should use gzip command.

In a real emergency when you don’t have enough RAM, neither disk space, neither the possibility to send the log files to another server to be compressed there, you could stop using the swap, and fdisk the swap partition to be a ext4 Linux format, format it, mount is, and use the space to compress the files. And after moving the files compressed to the original folder, fdisk the old swap partition to change type to Swap again, and enable swap again (swapon).

Memory requirements

As you can imagine, the weak point of cmemgzip, is that, if the file is completely loaded into memory and then compressed, the requirements of free memory on the Server/Instance/VM are at least the sum of the size of the file plus the sum of the size of the file compressed. You guess right. That’s true.

If there is not enough memory for loading the file in memory, the program is interrupted gracefully.

I decided to keep it simple, but this can be an option for the future.

So if your VM has 2GB of Available Memory, you will be able to use cmemgzip in uncompressed log files around 1.7GB.

In version 0.3 I implemented the ability to load chunks of the original file, and compress into memory, so I would be able use less memory. But then the compression is less efficient and initial tests point that I’ll have to keep a separate file for each compressed chunk. So I will need to created a uncompress tool as well, when now is completely compatible with gzip/gunzip, zcat, the file extractor from Ubuntu, etc…

For a big Server with a logfile of 40TB, around 300GB of RAM should be sufficient (the Servers I use have 768 GB of RAM normally).

Honestly, nowadays we find ourselves more frequently with VMs or Instances in the Cloud with small drives (10 to 15GB) and enough Available RAM, rather than Servers with huge mount points. This kind of instances, which means scaling horizontally, makes more difficult to have NFS Servers were we can move those logs, for security.

So cmemgzip covers very well some specific cases, while is not useful for all the scenarios.

I think it’s safe to say it covers 95% of the scenarios I’ve found in the past 7 years.

cmemgzip will not help you if you run out inodes.

Usage

Usage is very simple, and I kept it very verbose as the nature of the work is Operations, Engineers need to know what is going on.

I return error level/exit code 0 if everything goes well or 1 on errors.

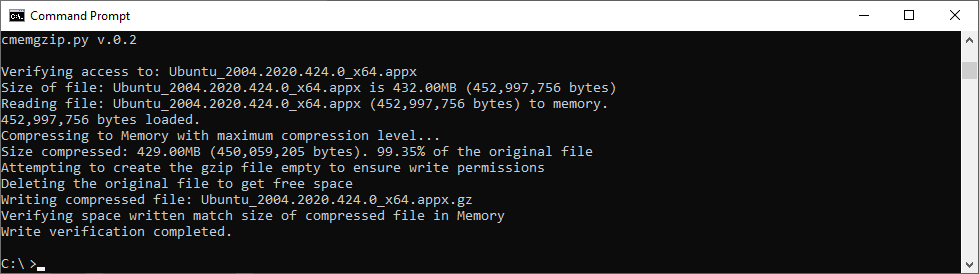
./cmemgzip.py /home/carles/test_extract/SherlockHolmes.txt
 
 cmemgzip.py v.0.1

 Verifying access to: /home/carles/test_extract/SherlockHolmes.txt
 Size of file: /home/carles/test_extract/SherlockHolmes.txt is 553KB (567,291 bytes)
 Reading file: /home/carles/test_extract/SherlockHolmes.txt (567,291 bytes) to memory.
 567,291 bytes loaded.
 Compressing to Memory with maximum compression level…
 Size compressed: 204KB (209,733 bytes). 36.97% of the original file
 Attempting to create the gzip file empty to ensure write permissions
 Deleting the original file to get free space
 Writing compressed file /home/carles/test_extract/SherlockHolmes.txt.gz
 Verifying space written match size of compressed file in Memory
 Write verification completed.

You can also simulate, without actually delete or write to disk, just in order to know what will be the
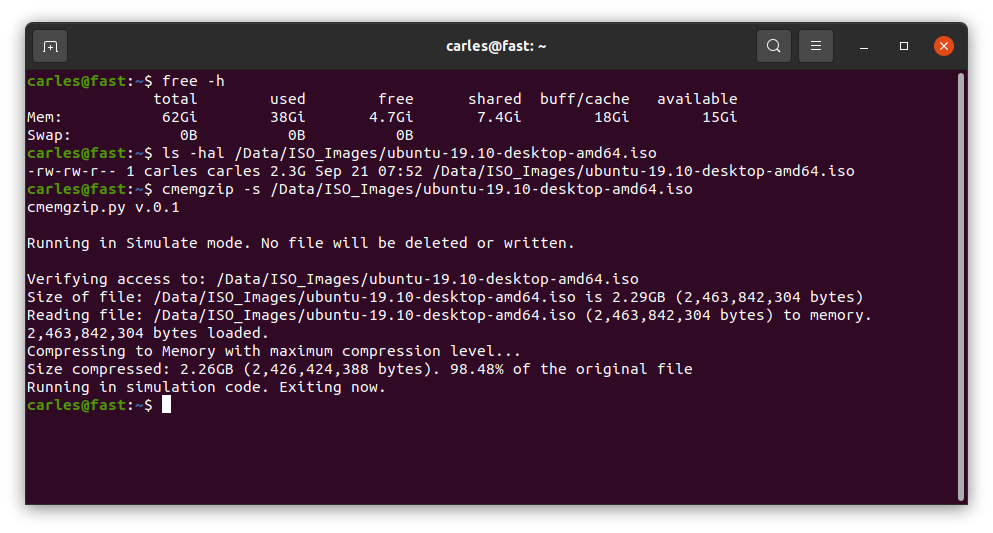
Installation

There are no third party libraries to install. I only use the standard ones: os, sys, gzip

So clone it with git in your preferred folder and just create a symbolic link with your favorite name:

sudo ln --symbolic /home/carles/code/cmemgzip/cmemgzip.py /usr/bin/cmemgzip

I like to create the link without the .py extension.

This way you can invoke the program from anywhere by just typing: cmemgzip

Dealing with Performance degradation on ZFS (DRAID) Rebuilds when migrating from a single processor to a multiprocessor platform

This is the history it happen to me some time ago, and so the commands I used to troubleshot. The purpose is to share knowledge in a interactive way. There are some hidden gems that you’ll acquire if you have the patience to go over all the document and read it all…

I had qualified Intel Xeon single processor platform to run my DRAID (ZFS Declustered RAID) project for my employer.

The platforms I qualified were:

1) single processor for Cold Storage (SAS Spinning drives): 4U60, newest models 4602

2) for multiprocessor: the 4U90 (90 Spinning drives) and Flash: All-Flash-Arrays.

The amounts of RAM I was using for my tests range for 64GB to 384GB.

Somebody in the company, at executive level, assembled an experimental config that was totally new for us and wanted to try by their own. It was the 4602 with multiprocessor and 32GB of RAM.

When they were unable to make it work at the expected speed, they required me to troubleshot and to make it work.

The 4602 single processor had two IOC (Input Output Controller, LSI Logic / Symbios Logic SAS3008 PCI-Express Fusion-MPT SAS-3 (rev 02) ), while the 4602 double processor had four IOC, so given that each of those IOC can perform at peaks of 6GB/s, with a maximum total of 24 GB/s, the performance when reading/writing from all the drives should be better.

But this Server was returning double times for Rebuilding, respect the single processor version, which didn’t make any sense.

I had to check everything. There was the commands I ran:

Check the upgrade of the CPU:

htop
lscpu

Changing the Zoning.

Those Servers use SAS drives dual ported, which means that two different computers can be connected to the same drive and operate at the same time. Is up to you to make sure you don’t introduce corruption. Those systems are used mainly for HA (High Availability).

Those Systems allow to be configured in different zoning modes. That’s the way on how each of the two servers (Controllers) see the disk. In one zoning each Controller sees only 30 drives, in another each IOC sees all the drives (for redundancy but performance constrained to 1 IOC Speed).

The config I set is each IOC will see 15 drives, so each one of the 4 IOC will have 6GB/s for 15 drives. Given that these spinning drives perform in the outtermost part of the cylinder at 265MB/s, that means that at maximum speed one IOC will be using 3.97 GB/s, will say 4GB/s. Plenty of bandwidth.

Note: Spinning drives have different performance depending on how close you’re to the cylinder. In the innermost part it goes under 145 MB/s, and if you read all of those drive sequentially with dd it will return an average speed of 145 MB/s.

With this command you can sive live how it performs and the average read speed in real time. Use skip to jump to that position (relative to bs) in the drive, so you can test directly the speed at the innermost close to the cylinder part of t.

dd if=/dev/sda of=/dev/null bs=1M status=progress

I saw that the zoning was not right one, so I set it correctly:

[root@4602Carles ~]# sg_map -i | grep NEWISYS
/dev/sg30  NEWISYS   NDS-4602-CS       0112
/dev/sg61  NEWISYS   NDS-4602-CS       0112
/dev/sg63  NEWISYS   NDS-4602-CS       0112
/dev/sg64  NEWISYS   NDS-4602-CS       0112
[root@4602Carles10 ~]# sg_senddiag /dev/sg30  --pf --raw=04,00,00,01,53
[root@4602Carles10 ~]# sleep 50
[root@4602Carles10 ~]# sg_senddiag /dev/sg30 --pf -r 04,00,00,01,43
[root@4602Carles10 ~]# sleep 50
[root@4602Carles10 ~]# reboot

The sleeps after rebooting the expanders are recommended. Rebooting the Operating System too, to avoid problems with some Software as the expanders changed live.

If you have ZFS pools or workloads stop them and export the pool before messing with the expanders.

In order to check to which drives is connected each IOC:

[root@4602Carles10 ~]# sg_map -i -x
/dev/sg0  0 0 0 0  0  /dev/sda  TOSHIBA   MG07SCA14TA       0101
/dev/sg1  0 0 1 0  0  /dev/sdb  TOSHIBA   MG07SCA14TA       0101
/dev/sg2  0 0 2 0  0  /dev/sdc  TOSHIBA   MG07SCA14TA       0101
/dev/sg3  0 0 3 0  0  /dev/sdd  TOSHIBA   MG07SCA14TA       0101
/dev/sg4  0 0 4 0  0  /dev/sde  TOSHIBA   MG07SCA14TA       0101
/dev/sg5  0 0 5 0  0  /dev/sdf  TOSHIBA   MG07SCA14TA       0101
/dev/sg6  0 0 6 0  0  /dev/sdg  TOSHIBA   MG07SCA14TA       0101
/dev/sg7  0 0 7 0  0  /dev/sdh  TOSHIBA   MG07SCA14TA       0101
/dev/sg8  1 0 8 0  0  /dev/sdi  TOSHIBA   MG07SCA14TA       0101
/dev/sg9  1 0 9 0  0  /dev/sdj  TOSHIBA   MG07SCA14TA       0101
/dev/sg10  1 0 10 0  0  /dev/sdk  TOSHIBA   MG07SCA14TA       0101
/dev/sg11  1 0 11 0  0  /dev/sdl  TOSHIBA   MG07SCA14TA       0101
[...]
/dev/sg16  4 0 16 0  0  /dev/sdq  TOSHIBA   MG07SCA14TA       0101
/dev/sg17  4 0 17 0  0  /dev/sdr  TOSHIBA   MG07SCA14TA       0101
[...]
/dev/sg30  0 0 30 0  13  NEWISYS   NDS-4602-CS       0112
[...]

Still after setting the right zone the Rebuilds were slow, the scan rate half of the obtained with a single processor.

I tested that the system was able to provide the expected performance by reading from all the drives at the same time. This is done with:

dd if=/dev/sda of=/dev/null bs=1M status=progress &
dd if=/dev/sdb of=/dev/null bs=1M status=progress &
dd if=/dev/sdc of=/dev/null bs=1M status=progress &
dd if=/dev/sdd of=/dev/null bs=1M status=progress &
[...]

I do this for all the drives at the same time and with iostat:

iostat -y 1 1

I check the status of the memory with:

slabtop
free
htop

I checked the memory and htop during a Rebuild. Memory was more than enough. However CPU usage was higher than expected.

The red bars in the image correspond to kernel processes, in this case is the DRAID Rebuild. I see that the load is higher than the usual with a single processor.

I capture all the parameters from ZFS with:

zfs get all

All this information is logged into my forensics document, so later can be checked by my Team or I can share with other Architects or other members of the company. I started this methodology after I knew how Google do their SRE forensics / postmortem documents. Also for myself is useful for the future to have a log of the commands I executed and a verbose output of the results.

I install the smp_utils

yum install smp_utils

Check things:

ls -al  /dev/bsg/
total 0drwxr-xr-x.  2 root root     3020 May 22 10:16 .
drwxr-xr-x. 20 root root     8680 May 22 10:16 ..
crw-------.  1 root root 248,  76 May 22 10:00 1:0:0:0
crw-------.  1 root root 248, 126 May 22 10:00 10:0:0:0
crw-------.  1 root root 248, 127 May 22 10:00 10:0:1:0
crw-------.  1 root root 248, 136 May 22 10:00 10:0:10:0
crw-------.  1 root root 248, 137 May 22 10:00 10:0:11:0
crw-------.  1 root root 248, 138 May 22 10:00 10:0:12:0
crw-------.  1 root root 248, 139 May 22 10:00 10:0:13:0
[...]
[root@4602Carles10 ~]# smp_discover /dev/bsg/expander-1:0
[...]
[root@4602Carles10 ~]# smp_discover /dev/bsg/expander-1:1

I check for errors in the expander that could justify the problems of performance:

for i in `seq 0 64`; do smp_rep_phy_err_log -p $i /dev/bsg/expander-1\:0 ; done
Report phy error log response:
  Expander change count: 567
  phy identifier: 0
  invalid dword count: 0
  running disparity error count: 0
  loss of dword synchronization count: 0
  phy reset problem count: 0
[...]
Report phy error log response:
  Expander change count: 567
  phy identifier: 52
  invalid dword count: 168
  running disparity error count: 172
  loss of dword synchronization count: 5
  phy reset problem count: 0
Report phy error log response:
  Expander change count: 567
  phy identifier: 53
  invalid dword count: 6
  running disparity error count: 6
  loss of dword synchronization count: 0
  phy reset problem count: 0
Report phy error log response:
  Expander change count: 567
  phy identifier: 54
  invalid dword count: 267
  running disparity error count: 270
  loss of dword synchronization count: 4
  phy reset problem count: 0
Report phy error log response:
  Expander change count: 567
  phy identifier: 55
  invalid dword count: 127
  running disparity error count: 131
  loss of dword synchronization count: 5
  phy reset problem count: 0
Report phy error log result: Phy vacant

There are some errors, and I check with the Hardware Team, which pass a battery of tests on the machine and say that the machine passes. They tell me that if the errors counted were in order of millions then it would be a problem, but having few of them is usual.

My colleagues previously reported that the memory was performing well, and the CPU too. They told me that the speed was exactly double respect a platform with one single CPU of the same kind.

Even if they told me that, I ran cmips tests to make sure.

git clone https://github.com/cmips/cmips_bin

It scored 16,000. The performance was Ok in general terms but the problem is that I didn’t have a baseline for that processor in single processor, so I cannot make sure that the memory bandwidth was Ok. The performance was less that an Amazon c3.8xlarge. The system I was testing is a two processor system, but each CPU is cheap, around USD $400.

Still my gut feeling was telling me that this double processor server should score more.

lscpu
[root@DRAID-1135-14TB-2CPU ~]# lscpu
 Architecture:          x86_64
 CPU op-mode(s):        32-bit, 64-bit
 Byte Order:            Little Endian
 CPU(s):                32
 On-line CPU(s) list:   0-31
 Thread(s) per core:    2
 Core(s) per socket:    8
 Socket(s):             2
 NUMA node(s):          2
 Vendor ID:             GenuineIntel
 CPU family:            6
 Model:                 79
 Model name:            Intel(R) Xeon(R) CPU E5-2620 v4 @ 2.10GHz
 Stepping:              1
 CPU MHz:               2299.951
 CPU max MHz:           3000.0000
 CPU min MHz:           1200.0000
 BogoMIPS:              4199.73
 Virtualization:        VT-x
 L1d cache:             32K
 L1i cache:             32K
 L2 cache:              256K
 L3 cache:              20480K
 NUMA node0 CPU(s):     0-7,16-23
 NUMA node1 CPU(s):     8-15,24-31
 Flags:                 fpu vme de pse tsc msr pae mce cx8 apic sep mtrr pge mca cmov pat pse36 clflush dts acpi mmx fxsr sse sse2 ss ht tm pbe syscall nx pdpe1gb rdtscp lm constant_tsc arch_perfmon pebs bts rep_good nopl xtopology nonstop_tsc aperfmperf eagerfpu pni pclmulqdq dtes64 monitor ds_cpl vmx smx est tm2 ssse3 sdbg fma cx16 xtpr pdcm pcid dca sse4_1 sse4_2 x2apic movbe popcnt tsc_deadline_timer aes xsave avx f16c rdrand lahf_lm abm 3dnowprefetch epb cat_l3 cdp_l3 intel_ppin intel_pt ibrs ibpb stibp tpr_shadow vnmi flexpriority ept vpid fsgsbase tsc_adjust bmi1 hle avx2 smep bmi2 erms invpcid rtm cqm rdt_a rdseed adx smap xsaveopt cqm_llc cqm_occup_llc cqm_mbm_total cqm_mbm_local dtherm ida arat pln pts spec_ctrl intel_stibp

I check the memory configuration with:

dmidecode -t memory

I examined the results, I see that the processor can only operate the DDR4 ECC 2400 Memory at 2133 and… I see something!. This Controller before was a single processor with 2 Memory Sticks of 16GB each, dual rank.

I see that now I have the same number of sticks in that machine, but I have two CPU!. So 2 Memory sticks in total, for 2 CPU.

That’s no good. The memory must be in pairs and in the right slots to get the maximum performance.

1 memory module for 1 CPU doesn’t allow to have Dual Channel and probably is affecting the performance. Many Servers will not even boot if you add an odd number of memory sticks per CPU.

And many Servers can operate at full speed only if all the banks are filled.

I request to the Engineers in Silicon Valley to add 4 modules in the right slots. They did, and I repeated the tests and the performance was doubled then.

After some days I had some time with the machine, I repeated the test and I got a CMIPS Score of around 20,000.

Multiprocessor world is far more complicated than single processor. Some times things can work not as expected, and not be evident, for example cache pipeline can act diferent for a program working in multiprocessor and single processor. Or the QPI could be saturated.

After this I shared my forensics document with as many Engineers as I could, so they could learn how I did to troubleshot the problem, and what was the origin of it, and I asked them to do the same so we can track their steps and progress if something needs to be troubleshoot.

After proper intensive testing the Server was qualified. Lesson here is that changes cannot be commited quickly, need their time.