Category Archives: Hardware

Some handy tricks for working with ZFS

Last Update: 2022-04-16 14:50 Irish time

Adding a RAM drive as SLOG (ZIL)

I came with this solution when one of my 4U60 Servers had two slots broken. You’ll not use this in Production, as SLOG loses its function, but I managed to use one $40K USD broken Server and to demonstrate that the Speed of the SLOG device (ZFS Intented Log or ZIL device) sets the constraints for the writing speed.

The ZFS DRAID config I was using required 60 drives, basically 58 14TB Spinning drives and 2 SSD for the SLOG ZIL. As I only had 58 slots I came with this idea.

This trick can be very useful if you have a box full of Spinning drives, and when sharing by iSCSI zvols you get disconnected in the iSCSI Initiator side. This is typical when ZFS has only Spinning drives and it has no SLOG drives (dedicated fast devices for the ZIL, ZFS INTENDED LOG)

Create a single Ramdrive of 10GB of RAM:

modprobe brd rd_nr=1 rd_size=10485760 max_part=0

Confirm ram0 device exists now:

ls /dev/ram*

Confirm that the pool is imported:

zpool list

Add to the pool:

zpool add carles-N58-C3-D16-P2-S4 log ram0

In the case that you want to have two ram devices as SLOG devices, in mirror.

zpool add carles-N58-C3-D16-P2-S4 log mirror <partition/drive 1> <partition/drive 2>

It is interesting to know that you can work with partitions instead of drives. So for this test we could have partitioned ram0 with 2 partitions and make it work in mirror. You’ll see how much faster the iSCSI communication goes over the network. The writing speed of the ZIL SLOG device is the constrain for ingesting Data from the Network to the Server.

Creating a partition bigger than 2TiB

Master Boot Record (MBR) based partitioning is limited to 2TiB however GUID Partition Table (GPT) has a limit of 8 ZiB.

That’s something very simply, but make you lose time if you’re partitioning big iSCSI Shares, or ZFS Zvols, so here is the trick:

[root@CTRLA-18 ~]# cat /etc/redhat-release 
 Red Hat Enterprise Linux Server release 7.6 (Maipo)
 [root@CTRLA-18 ~]# parted /dev/zvol/N58-C19-D2-P1-S1/vol54854gb 
 GNU Parted 3.1
 Using /dev/zd0
 Welcome to GNU Parted! Type 'help' to view a list of commands.
 (parted) mklabel gpt
 Warning: The existing disk label on /dev/zd0 will be destroyed and all data on this disk will be lost. Do you want to continue?
 Yes/No? y                                                                 
 (parted) print                                                            
 Model: Unknown (unknown)
 Disk /dev/zd0: 58.9TB
 Sector size (logical/physical): 512B/65536B
 Partition Table: gpt
 Disk Flags: 
 Number  Start  End  Size  File system  Name  Flags
 (parted) mkpart primary 0GB 58.9TB                                        
 (parted) print                                                            
 Model: Unknown (unknown)
 Disk /dev/zd0: 58.9TB
 Sector size (logical/physical): 512B/65536B
 Partition Table: gpt
 Disk Flags: 
 Number  Start   End     Size    File system  Name     Flags
  1      1049kB  58.9TB  58.9TB               primary
 (parted) quit                                                             
 Information: You may need to update /etc/fstab.
 [root@CTRLA-18 ~]# mkfs                                                   
 mkfs         mkfs.btrfs   mkfs.cramfs  mkfs.ext2    mkfs.ext3    mkfs.ext4    mkfs.minix   mkfs.xfs     
 [root@CTRLA-18 ~]# mkfs.ext4 /dev/zvol/N58-C19-D2-P1-S1/vol54854gb
 mke2fs 1.42.9 (28-Dec-2013)
....
[root@CTRLA-18 ~]# mount /dev/zvol/N58-C19-D2-P1-S1/vol54854gb /Data
[root@CTRLA-18 ~]# df -h
 Filesystem             Size  Used Avail Use% Mounted on
 /dev/mapper/rhel-root   50G  2.5G   48G   5% /
 devtmpfs               126G     0  126G   0% /dev
 tmpfs                  126G     0  126G   0% /dev/shm
 tmpfs                  126G  1.1G  125G   1% /run
 tmpfs                  126G     0  126G   0% /sys/fs/cgroup
 /dev/sdp1             1014M  151M  864M  15% /boot
 /dev/mapper/rhel-home   65G   33M   65G   1% /home
 logs                    49G  349M   48G   1% /logs
 mysql                  9.7G  128K  9.7G   1% /mysql
 tmpfs                   26G     0   26G   0% /run/user/0
 /dev/zd0                54T   20K   51T   1% /Data

ZFS is unable to use a disk

Some times, after creating many pools ZFS may be unable to create a new pool using a drive that is perfectly fine. In this situation, the ideal is wipe the first areas of it, or all of it if you want. If it’s an SSD that is very fast:

dd if=/dev/zero of=/dev/sdc bs=1M status=progress

The status=progress will show a nice progress bar.

Filling a half Petabyte pool as fast as possible

To fill a 60 drives pool composed by 10TB or 14TB spinning drives, so more than half PB, in order to test with real data, you can use this trick:

First, write to the Dataset directly, that’s way much more faster than using zvols.

Secondly, disable the ZIL, set sync=disabled.

Third, use a file in memory to avoid the paytime of reading the file from disk.

Fourth, increase the recordsize to 1M for faster filling (in my experience).

You can use this script of mine that does everything for you, normally you would like to run it inside an screen session, and create a Dataset called Data. The script will mount it in /Data (zfs set mountpoint=/data YOURPOOL/Data):

#!/usr/bin/env bash
# Created by Carles Mateo
FILE_ORIGINAL="/run/urandom.1GB"
FILE_PATTERN="/Data/urandom.1GB-clone."
# POOL="N56-C5-D8-P3-S1"
POOL="N58-C3-D16-P3-S1"
# The starting number, if you interrupt the filling process, you can update it just by updating this number to match the last partially written file
i_COPYING_INITIAL_NUMBER=1
# For 75% of 10TB (3x(16+3)+1 has 421TiB, so 75% of 421TiB or 431,104GiB is 323,328) use 323328
# i_COPYING_FINAL_NUMBER=323328
# For 75% of 10TB, 5x(8+3)+1 ZFS sees 352TiB, so 75% use 270336
# For 75% of 14TB, 3x(16+3)+1, use 453120
i_COPYING_FINAL_NUMBER=453120

# Creating an array that will hold the speed of the latest 1 minute
a_i_LATEST_SPEEDS=(0 0 0 0 0 0 0 0 0 0 0 0 0 0 0 0 0 0 0 0 0 0 0 0 0 0 0 0 0 0 0 0 0 0 0 0 0 0 0 0 0 0 0 0 0 0 0 0 0 0 0)
i_POINTER_SPEEDS=0
i_COUNTER_SPEEDS=-1
i_ITEMS_KEPT_SPEEDS=60
i_AVG_SPEED=0
i_FILES_TO_BE_COPIED=$((i_COPYING_FINAL_NUMBER-i_COPYING_INITIAL_NUMBER))

get_average_speed () {
# Calculates the Average Speed
   i_AVG_SPEED=0
   for i_index in {0..59..1}
       do
           i_SPEED=$((a_i_LATEST_SPEEDS[i_index]))
           i_AVG_SPEED=$((i_AVG_SPEED + i_SPEED))
       done
   i_AVG_SPEED=$((i_AVG_SPEED/((i_COUNTER_SPEEDS)+1)))
}


echo "Bash version ${BASH_VERSION}..."

echo "Disabling sync in the pool $POOL for faster speed"
zfs set sync=disabled $POOL
echo "Maximizing performance with recordsize"
zfs set recordsize=1M ${POOL}
zfs set recordsize=1M ${POOL}/Data
echo "Mounting the Dataset Data"
zfs set mountpoint=/Data ${POOL}/Data
zfs mount ${POOL}/Data

echo "Checking if file ${FILE_ORIGINAL} exists..."
if [[ -f ${FILE_ORIGINAL} ]]; then
    ls -al ${FILE_ORIGINAL}
    sha1sum ${FILE_ORIGINAL}
else
    echo "Generating file..."
    dd if=/dev/urandom of=${FILE_ORIGINAL} bs=1M count=1024 status=progress
fi

echo "Starting filling process..."
echo "We are going to copy ${i_FILES_TO_BE_COPIED} , starting from: ${i_COPYING_INITIAL_NUMBER} to: ${i_COPYING_FINAL_NUMBER}"

for ((i_NUMBER=${i_COPYING_INITIAL_NUMBER}; i_NUMBER<=${i_COPYING_FINAL_NUMBER}; i_NUMBER++));
    do
        s_datetime_ini=$(($(date +%s%N)/1000000))
        DATE_NOW=`date '+%Y-%m-%d_%H-%M-%S'`
        echo "${DATE_NOW} Copying ${FILE_ORIGINAL} to ${FILE_PATTERN}${i_NUMBER}"
        cp ${FILE_ORIGINAL} ${FILE_PATTERN}${i_NUMBER}
        s_datetime_end=$(($(date +%s%N)/1000000))
        MILLISECONDS=$(expr "$s_datetime_end" - "$s_datetime_ini")
        if [[ ${MILLISECONDS} -lt 1 ]]; then
            BANDWIDTH_MBS="Unknown (too fast)"
            # That sould not happen, but if did, we don't account crazy speeds
        else
            BANDWIDTH_MBS=$((1000*1024/MILLISECONDS))
            # Make sure the Array space has been allocated
            if [[ ${i_POINTER_SPEEDS} -gt ${i_COUNTER_SPEEDS} ]]; then
                # Add item to the Array the first times only
                a_i_LATEST_SPEEDS[i_POINTER_SPEEDS]=${BANDWIDTH_MBS}
                i_COUNTER_SPEEDS=$((i_COUNTER_SPEEDS+1))
            else
                a_i_LATEST_SPEEDS[i_POINTER_SPEEDS]=${BANDWIDTH_MBS}
            fi
            i_POINTER_SPEEDS=$((i_POINTER_SPEEDS+1))
            if [[ ${i_POINTER_SPEEDS} -ge ${i_ITEMS_KEPT_SPEEDS} ]]; then
                i_POINTER_SPEEDS=0
            fi
            get_average_speed
        fi
        i_FILES_TO_BE_COPIED=$((i_FILES_TO_BE_COPIED-1))
        i_REMAINING_TIME=$((1024*i_FILES_TO_BE_COPIED/i_AVG_SPEED))
        i_REMAINING_HOURS=$((i_REMAINING_TIME/3600))
        echo "File cloned in ${MILLISECONDS} milliseconds at ${BANDWIDTH_MBS} MB/s"
        echo "Avg. Speed: ${i_AVG_SPEED} MB/s Remaining Files: ${i_FILES_TO_BE_COPIED} Remaining seconds: ${i_REMAINING_TIME} s. (${i_REMAINING_HOURS} h.)"
    done

echo "Enabling sync=always"
zfs set sync=always ${POOL}
echo "Setting back recordsize to 128K"
zfs set recordsize=128K ${POOL}
zfs set recordsize=128K ${POOL}/Data
echo "Unmounting /Data"
zfs set mountpoint=none ${POOL}/Data

Creating a Sparse file that you can partition or create a loopback on it

I know, your laptop has 512GB of M.2 SSD or NVMe, so that’s it.

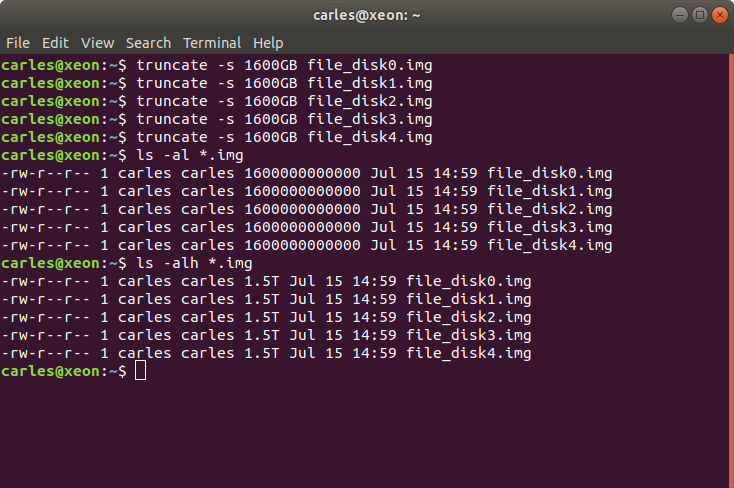
Well, you can create a sparse file much more bigger than your capacity, and use 0 bytes of it at all.

For example:

truncate -s 1600GB file_disk0.img

If the files are stored in / then you can add a loop device:

sudo losetup -f /file_disk0.img

I do with the 5 I created.

Then you can check that they exist with:

lsblk

or

cat /proc/partitions

The loop devices will appear under /dev/ now.

For some tests I did this in a Virtual Box Virtual Machine:

root@ansiblemaster:/home/carles# truncate -s 1GB /file_disk0.img
root@ansiblemaster:/home/carles# truncate -s 1GB /file_disk1.img
root@ansiblemaster:/home/carles# truncate -s 1GB /file_disk2.img
root@ansiblemaster:/home/carles# sudo losetup -f /file_disk0.img
root@ansiblemaster:/home/carles# sudo losetup -f /file_disk1.img
root@ansiblemaster:/home/carles# sudo losetup -f /file_disk2.img
root@ansiblemaster:/home/carles# lsblk
NAME                      MAJ:MIN RM   SIZE RO TYPE MOUNTPOINT
loop0                       7:0    0  61.9M  1 loop /snap/core20/1270
loop1                       7:1    0  94.5M  1 loop /snap/go/9028
loop2                       7:2    0  61.9M  1 loop /snap/core20/1328
loop3                       7:3    0    15M  1 loop /snap/aws-cli/130
loop4                       7:4    0  55.5M  1 loop /snap/core18/2344
loop5                       7:5    0 110.8M  1 loop /snap/core/12725
loop6                       7:6    0  55.5M  1 loop /snap/core18/2284
loop7                       7:7    0  67.8M  1 loop /snap/lxd/22753
loop8                       7:8    0  67.2M  1 loop /snap/lxd/21835
loop9                       7:9    0  38.7M  1 loop /snap/postgresql10/47
loop10                      7:10   0  43.6M  1 loop /snap/snapd/14978
loop11                      7:11   0    12M  1 loop /snap/slcli/2072
loop12                      7:12   0 254.4M  1 loop /snap/google-cloud-sdk/226
loop13                      7:13   0 293.2M  1 loop /snap/google-cloud-sdk/234
loop14                      7:14   0  43.6M  1 loop /snap/snapd/15177
loop15                      7:15   0  12.3M  1 loop /snap/slcli/2111
loop16                      7:16   0  99.4M  1 loop /snap/go/9415
loop17                      7:17   0 953.7M  0 loop 
loop18                      7:18   0 953.7M  0 loop 
loop19                      7:19   0 953.7M  0 loop 
sda                         8:0    0    20G  0 disk 
├─sda1                      8:1    0     1M  0 part 
├─sda2                      8:2    0     1G  0 part /boot
└─sda3                      8:3    0    19G  0 part 
  └─ubuntu--vg-ubuntu--lv 253:0    0    19G  0 lvm  /
sr0                        11:0    1  1024M  0 rom  
root@ansiblemaster:/home/carles# cat /proc/partitions 
major minor  #blocks  name

   7        0      63392 loop0
   7        1      96796 loop1
   7        2      63396 loop2
   7        3      15324 loop3
   7        4      56848 loop4
   7        5     113456 loop5
   7        6      56840 loop6
   7        7      69440 loop7
  11        0    1048575 sr0
   8        0   20971520 sda
   8        1       1024 sda1
   8        2    1048576 sda2
   8        3   19919872 sda3
 253        0   19918848 dm-0
   7        8      68856 loop8
   7        9      39632 loop9
   7       10      44632 loop10
   7       11      12244 loop11
   7       12     260484 loop12
   7       13     300224 loop13
   7       14      44676 loop14
   7       15      12584 loop15
   7       16     101792 loop16
   7       17     976562 loop17
   7       18     976562 loop18
   7       19     976562 loop19

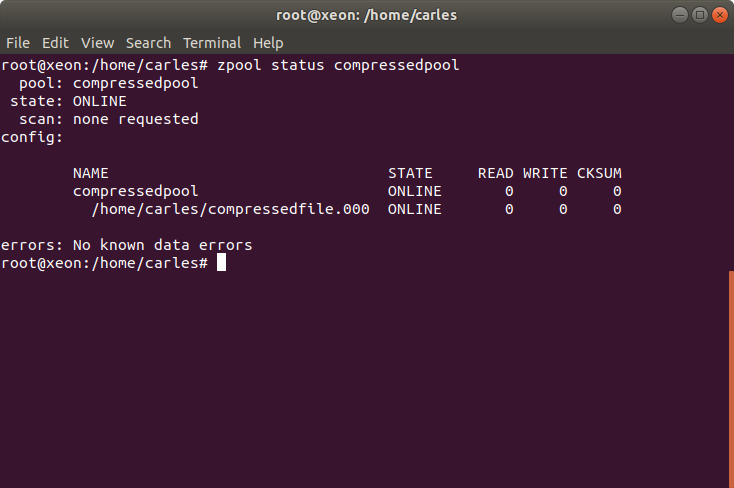
Finally I create a ZFS pool:

root@ansiblemaster:/home/carles# zpool create zfspool raidz loop17 loop18 loop19
root@ansiblemaster:/home/carles# zpool status
  pool: zfspool
 state: ONLINE
  scan: none requested
config:

	NAME        STATE     READ WRITE CKSUM
	zfspool     ONLINE       0     0     0
	  raidz1-0  ONLINE       0     0     0
	    loop17  ONLINE       0     0     0
	    loop18  ONLINE       0     0     0
	    loop19  ONLINE       0     0     0

errors: No known data errors

Erasure Coding, simple, for huge Storage needs

According to Wikipedia Erasure Coding means:

In coding theory, an erasure code is a forward error correction (FEC) code under the assumption of bit erasures (rather than bit errors), which transforms a message of k symbols into a longer message (code word) with n symbols such that the original message can be recovered from a subset of the n symbols. The fraction r = k/n is called the code rate. The fraction k’/k, where k’ denotes the number of symbols required for recovery, is called reception efficiency.

So Raid systems applied to drives are Erasure Code too.

But I want to talk about Erasure Code for the needs of organizations like Instagram, that need to store huge amount of files and they cannot afford to lose the data simply because several drives, or all the Server, fails.

So what is the way to make this sure if you have thousands of Servers?.

Many Start ups that require to host files, cannot afford to have every file duplicated or triplicated in other systems.

So how to do this in a cheap an efficient way?.

Here is where Erasure Coding comes to play.

Erasure Coding work so simply as:

  1. Given a given file, for example, 1 video of 10 MB
  2. We apply the Erasure Coding to encode the file
  3. We select, for example, to generate 3 additional chunks
  4. So our original 10MB file fill be split in 13 blocks (13 new files), each block will have approx. 1MB
  5. We can rebuild the original file by combining any 10 of those 13 files

That means that we can afford to loss 3 blocks (1MB files) and we will still be able to reconstruct the original file.

Examples:

  1. Ok, so now imagine we have 13 identical Servers, and we encode all our files, using Erasure Coding. Imagine that we store each block in a different Server. That means that we can lose 3 Servers and still have all our information intact.
  2. Imagine we have 100 Servers, and we split all those files to the Servers that have more free space available. We could lose 3 Serversand still not having lose any information. If we are really lucky (or the SDS – Software Defined Storage is very clever) we could lose more than 3 Servers.
  3. Now imagine we have 100 Racks full of Servers. Our SDS selects the Rack that has more free space and places one of the blocks in there, and the same for the other 12 blocks. We could afford to lose 3 racks without losing any Data. That’s more manageable for Google or Yahoo than managing at Server Level.

We can use Erasure coding with different configs like 8+3, or 10+4… The sample I choose 10+3 is easy to understand, as we clearly see that will occupy only 30% of additional space.

Those blocks can conveniently be stored in different Servers, across different regions too, for example, using a config of 9+3 you can have 4 different Cloud Providers in different geographic regions, and each holding 25% of the required files, so 3 files each. Then, you only require 3 Cloud providers to rebuild the original file (you only precise 9 surviving blocks, not all 12). Possibilities are infinite.

When one Rack is down, you can rebalance all the blocks that were there to another rack.

Also you can have different Servers, with different capacity… your SDS should be clever enough to accommodate the blocks for protection and space efficiency. To checksum them to ensure no corruption in the block as was stored or transported over the network. Your SDS Software should be clever enough to be able to add new nodes and Racks, and to substract nodes, to Rebalance, to checksum the blocks in the Servers… and to store the information effectively on the local Servers (not many files per folder…), to use Commodity Hardware with low memory, or even VM’s… if your System is good enough it will even put to sleep, to save energy, the Servers that are not in use (typically the Servers that are full), until required.

Also, when in need to recover a file, the clever SDS Software, using multithread, will ask to the 9 locations at the same time, in parallel, so using all the available bandwidth, in order to fetch the blocks and rebuild the original file really quick. This can also be implemented with no single point of failure, will all the nodes being able to be the headnode.

That’s exactly what my Erasure Coding solution did.

I invented a lot of technologies to scale out since I created my messenger in 1996.

You can do it yourself, or use existing Erasure Coding solutions. The most known is OpenStack Swift, although in my opinion is a pain to configure and to maintain.

Dealing with Performance degradation on ZFS (DRAID) Rebuilds when migrating from a single processor to a multiprocessor platform

This is the history it happen to me some time ago, and so the commands I used to troubleshot. The purpose is to share knowledge in a interactive way. There are some hidden gems that you’ll acquire if you have the patience to go over all the document and read it all…

I had qualified Intel Xeon single processor platform to run my DRAID (ZFS Declustered RAID) project for my employer.

The platforms I qualified were:

1) single processor for Cold Storage (SAS Spinning drives): 4U60, newest models 4602

2) for multiprocessor: the 4U90 (90 Spinning drives) and Flash: All-Flash-Arrays.

The amounts of RAM I was using for my tests range for 64GB to 384GB.

Somebody in the company, at executive level, assembled an experimental config that was totally new for us and wanted to try by their own. It was the 4602 with multiprocessor and 32GB of RAM.

When they were unable to make it work at the expected speed, they required me to troubleshot and to make it work.

The 4602 single processor had two IOC (Input Output Controller, LSI Logic / Symbios Logic SAS3008 PCI-Express Fusion-MPT SAS-3 (rev 02) ), while the 4602 double processor had four IOC, so given that each of those IOC can perform at peaks of 6GB/s, with a maximum total of 24 GB/s, the performance when reading/writing from all the drives should be better.

But this Server was returning double times for Rebuilding, respect the single processor version, which didn’t make any sense.

I had to check everything. There was the commands I ran:

Check the upgrade of the CPU:

htop
lscpu

Changing the Zoning.

Those Servers use SAS drives dual ported, which means that two different computers can be connected to the same drive and operate at the same time. Is up to you to make sure you don’t introduce corruption. Those systems are used mainly for HA (High Availability).

Those Systems allow to be configured in different zoning modes. That’s the way on how each of the two servers (Controllers) see the disk. In one zoning each Controller sees only 30 drives, in another each IOC sees all the drives (for redundancy but performance constrained to 1 IOC Speed).

The config I set is each IOC will see 15 drives, so each one of the 4 IOC will have 6GB/s for 15 drives. Given that these spinning drives perform in the outtermost part of the cylinder at 265MB/s, that means that at maximum speed one IOC will be using 3.97 GB/s, will say 4GB/s. Plenty of bandwidth.

Note: Spinning drives have different performance depending on how close you’re to the cylinder. In the innermost part it goes under 145 MB/s, and if you read all of those drive sequentially with dd it will return an average speed of 145 MB/s.

With this command you can sive live how it performs and the average read speed in real time. Use skip to jump to that position (relative to bs) in the drive, so you can test directly the speed at the innermost close to the cylinder part of t.

dd if=/dev/sda of=/dev/null bs=1M status=progress

I saw that the zoning was not right one, so I set it correctly:

[root@4602Carles ~]# sg_map -i | grep NEWISYS
/dev/sg30  NEWISYS   NDS-4602-CS       0112
/dev/sg61  NEWISYS   NDS-4602-CS       0112
/dev/sg63  NEWISYS   NDS-4602-CS       0112
/dev/sg64  NEWISYS   NDS-4602-CS       0112
[root@4602Carles10 ~]# sg_senddiag /dev/sg30  --pf --raw=04,00,00,01,53
[root@4602Carles10 ~]# sleep 50
[root@4602Carles10 ~]# sg_senddiag /dev/sg30 --pf -r 04,00,00,01,43
[root@4602Carles10 ~]# sleep 50
[root@4602Carles10 ~]# reboot

The sleeps after rebooting the expanders are recommended. Rebooting the Operating System too, to avoid problems with some Software as the expanders changed live.

If you have ZFS pools or workloads stop them and export the pool before messing with the expanders.

In order to check to which drives is connected each IOC:

[root@4602Carles10 ~]# sg_map -i -x
/dev/sg0  0 0 0 0  0  /dev/sda  TOSHIBA   MG07SCA14TA       0101
/dev/sg1  0 0 1 0  0  /dev/sdb  TOSHIBA   MG07SCA14TA       0101
/dev/sg2  0 0 2 0  0  /dev/sdc  TOSHIBA   MG07SCA14TA       0101
/dev/sg3  0 0 3 0  0  /dev/sdd  TOSHIBA   MG07SCA14TA       0101
/dev/sg4  0 0 4 0  0  /dev/sde  TOSHIBA   MG07SCA14TA       0101
/dev/sg5  0 0 5 0  0  /dev/sdf  TOSHIBA   MG07SCA14TA       0101
/dev/sg6  0 0 6 0  0  /dev/sdg  TOSHIBA   MG07SCA14TA       0101
/dev/sg7  0 0 7 0  0  /dev/sdh  TOSHIBA   MG07SCA14TA       0101
/dev/sg8  1 0 8 0  0  /dev/sdi  TOSHIBA   MG07SCA14TA       0101
/dev/sg9  1 0 9 0  0  /dev/sdj  TOSHIBA   MG07SCA14TA       0101
/dev/sg10  1 0 10 0  0  /dev/sdk  TOSHIBA   MG07SCA14TA       0101
/dev/sg11  1 0 11 0  0  /dev/sdl  TOSHIBA   MG07SCA14TA       0101
[...]
/dev/sg16  4 0 16 0  0  /dev/sdq  TOSHIBA   MG07SCA14TA       0101
/dev/sg17  4 0 17 0  0  /dev/sdr  TOSHIBA   MG07SCA14TA       0101
[...]
/dev/sg30  0 0 30 0  13  NEWISYS   NDS-4602-CS       0112
[...]

Still after setting the right zone the Rebuilds were slow, the scan rate half of the obtained with a single processor.

I tested that the system was able to provide the expected performance by reading from all the drives at the same time. This is done with:

dd if=/dev/sda of=/dev/null bs=1M status=progress &
dd if=/dev/sdb of=/dev/null bs=1M status=progress &
dd if=/dev/sdc of=/dev/null bs=1M status=progress &
dd if=/dev/sdd of=/dev/null bs=1M status=progress &
[...]

I do this for all the drives at the same time and with iostat:

iostat -y 1 1

I check the status of the memory with:

slabtop
free
htop

I checked the memory and htop during a Rebuild. Memory was more than enough. However CPU usage was higher than expected.

The red bars in the image correspond to kernel processes, in this case is the DRAID Rebuild. I see that the load is higher than the usual with a single processor.

I capture all the parameters from ZFS with:

zfs get all

All this information is logged into my forensics document, so later can be checked by my Team or I can share with other Architects or other members of the company. I started this methodology after I knew how Google do their SRE forensics / postmortem documents. Also for myself is useful for the future to have a log of the commands I executed and a verbose output of the results.

I install the smp_utils

yum install smp_utils

Check things:

ls -al  /dev/bsg/
total 0drwxr-xr-x.  2 root root     3020 May 22 10:16 .
drwxr-xr-x. 20 root root     8680 May 22 10:16 ..
crw-------.  1 root root 248,  76 May 22 10:00 1:0:0:0
crw-------.  1 root root 248, 126 May 22 10:00 10:0:0:0
crw-------.  1 root root 248, 127 May 22 10:00 10:0:1:0
crw-------.  1 root root 248, 136 May 22 10:00 10:0:10:0
crw-------.  1 root root 248, 137 May 22 10:00 10:0:11:0
crw-------.  1 root root 248, 138 May 22 10:00 10:0:12:0
crw-------.  1 root root 248, 139 May 22 10:00 10:0:13:0
[...]
[root@4602Carles10 ~]# smp_discover /dev/bsg/expander-1:0
[...]
[root@4602Carles10 ~]# smp_discover /dev/bsg/expander-1:1

I check for errors in the expander that could justify the problems of performance:

for i in `seq 0 64`; do smp_rep_phy_err_log -p $i /dev/bsg/expander-1\:0 ; done
Report phy error log response:
  Expander change count: 567
  phy identifier: 0
  invalid dword count: 0
  running disparity error count: 0
  loss of dword synchronization count: 0
  phy reset problem count: 0
[...]
Report phy error log response:
  Expander change count: 567
  phy identifier: 52
  invalid dword count: 168
  running disparity error count: 172
  loss of dword synchronization count: 5
  phy reset problem count: 0
Report phy error log response:
  Expander change count: 567
  phy identifier: 53
  invalid dword count: 6
  running disparity error count: 6
  loss of dword synchronization count: 0
  phy reset problem count: 0
Report phy error log response:
  Expander change count: 567
  phy identifier: 54
  invalid dword count: 267
  running disparity error count: 270
  loss of dword synchronization count: 4
  phy reset problem count: 0
Report phy error log response:
  Expander change count: 567
  phy identifier: 55
  invalid dword count: 127
  running disparity error count: 131
  loss of dword synchronization count: 5
  phy reset problem count: 0
Report phy error log result: Phy vacant

There are some errors, and I check with the Hardware Team, which pass a battery of tests on the machine and say that the machine passes. They tell me that if the errors counted were in order of millions then it would be a problem, but having few of them is usual.

My colleagues previously reported that the memory was performing well, and the CPU too. They told me that the speed was exactly double respect a platform with one single CPU of the same kind.

Even if they told me that, I ran cmips tests to make sure.

git clone https://github.com/cmips/cmips_bin

It scored 16,000. The performance was Ok in general terms but the problem is that I didn’t have a baseline for that processor in single processor, so I cannot make sure that the memory bandwidth was Ok. The performance was less that an Amazon c3.8xlarge. The system I was testing is a two processor system, but each CPU is cheap, around USD $400.

Still my gut feeling was telling me that this double processor server should score more.

lscpu
[root@DRAID-1135-14TB-2CPU ~]# lscpu
 Architecture:          x86_64
 CPU op-mode(s):        32-bit, 64-bit
 Byte Order:            Little Endian
 CPU(s):                32
 On-line CPU(s) list:   0-31
 Thread(s) per core:    2
 Core(s) per socket:    8
 Socket(s):             2
 NUMA node(s):          2
 Vendor ID:             GenuineIntel
 CPU family:            6
 Model:                 79
 Model name:            Intel(R) Xeon(R) CPU E5-2620 v4 @ 2.10GHz
 Stepping:              1
 CPU MHz:               2299.951
 CPU max MHz:           3000.0000
 CPU min MHz:           1200.0000
 BogoMIPS:              4199.73
 Virtualization:        VT-x
 L1d cache:             32K
 L1i cache:             32K
 L2 cache:              256K
 L3 cache:              20480K
 NUMA node0 CPU(s):     0-7,16-23
 NUMA node1 CPU(s):     8-15,24-31
 Flags:                 fpu vme de pse tsc msr pae mce cx8 apic sep mtrr pge mca cmov pat pse36 clflush dts acpi mmx fxsr sse sse2 ss ht tm pbe syscall nx pdpe1gb rdtscp lm constant_tsc arch_perfmon pebs bts rep_good nopl xtopology nonstop_tsc aperfmperf eagerfpu pni pclmulqdq dtes64 monitor ds_cpl vmx smx est tm2 ssse3 sdbg fma cx16 xtpr pdcm pcid dca sse4_1 sse4_2 x2apic movbe popcnt tsc_deadline_timer aes xsave avx f16c rdrand lahf_lm abm 3dnowprefetch epb cat_l3 cdp_l3 intel_ppin intel_pt ibrs ibpb stibp tpr_shadow vnmi flexpriority ept vpid fsgsbase tsc_adjust bmi1 hle avx2 smep bmi2 erms invpcid rtm cqm rdt_a rdseed adx smap xsaveopt cqm_llc cqm_occup_llc cqm_mbm_total cqm_mbm_local dtherm ida arat pln pts spec_ctrl intel_stibp

I check the memory configuration with:

dmidecode -t memory

I examined the results, I see that the processor can only operate the DDR4 ECC 2400 Memory at 2133 and… I see something!. This Controller before was a single processor with 2 Memory Sticks of 16GB each, dual rank.

I see that now I have the same number of sticks in that machine, but I have two CPU!. So 2 Memory sticks in total, for 2 CPU.

That’s no good. The memory must be in pairs and in the right slots to get the maximum performance.

1 memory module for 1 CPU doesn’t allow to have Dual Channel and probably is affecting the performance. Many Servers will not even boot if you add an odd number of memory sticks per CPU.

And many Servers can operate at full speed only if all the banks are filled.

I request to the Engineers in Silicon Valley to add 4 modules in the right slots. They did, and I repeated the tests and the performance was doubled then.

After some days I had some time with the machine, I repeated the test and I got a CMIPS Score of around 20,000.

Multiprocessor world is far more complicated than single processor. Some times things can work not as expected, and not be evident, for example cache pipeline can act diferent for a program working in multiprocessor and single processor. Or the QPI could be saturated.

After this I shared my forensics document with as many Engineers as I could, so they could learn how I did to troubleshot the problem, and what was the origin of it, and I asked them to do the same so we can track their steps and progress if something needs to be troubleshoot.

After proper intensive testing the Server was qualified. Lesson here is that changes cannot be commited quickly, need their time.

Solving an infinite loop in CentOS after inducing a Kernel Panic in a Server

This trick may be useful for you.
Almost surely if you power cycle, completely powering down your Server you’ll fix booting too.
Unfortunately we do not always have access to the Data Center or Remote Hands service available, so this trick may be useful for you.

Just reset your BMC card with this:

ipmitool -H 172.30.30.7 -U admin -P thepassword bmc reset cold

After this use the remote control tool to request a reboot and it will do and power on normally.

This may not work in all the Servers, it depends on a lot of aspects (firmware, bmc manufacturer, etc…) but can do the trick for you maybe.

Create a small partition on the drives for tests

Ok, as you know I work with ZFS, DRAID, Erasure Coding… and Cold Storage.
I work with big disks, SAS, SSD, and NVMe.
Sometimes I need to conduct some tests that involve filling completely to 100% the pool.
That’s very slow having to fill 14TB drives, with Servers with 60, 90 and 104 drives, for obvious reasons. So here is a handy script for partitioning those drives with a small partition, then you use the small partition for creating a pool that will fill faster.

1. Get the list of drives in the system
For example this script can help

DRIVES=`ls -al /dev/disk/by-id/ | grep "sd" | grep -v "part" | grep "wwn" | tr "./" "  " | awk '{ print $11; }'`

If your drives had a previous partition this script will detect them, and will use only the drives with wwn identifier.
Warning: some M.2 booting drives have wwn where others don’t. Use with caution.

2. Identify the boot device and remove from the list
3. Do the loop with for DRIVE in $DRIVES or manually:

for DRIVE in sdar sdcd sdi sdj sdbp sdbd sdy sdab sdbo sdk sdz sdbb sdl sdcq sdbl sdbe sdan sdv sdp sdbf sdao sdm sdg sdbw sdaf sdac sdag sdco sds sdah sdbh sdby sdbn sdcl sdcf sdbz sdbi sdcr sdbj sdd sdcn sdr sdbk sdaq sde sdak sdbx sdbm sday sdbv sdbg sdcg sdce sdca sdax sdam sdaz sdci sdt sdcp sdav sdc sdae sdf sdw sdu sdal sdo sdx sdh sdcj sdch sdaw sdba sdap sdck sdn sdas sdai sdaa sdcs sdcm sdcb sdaj sdcc sdad sdbc sdb sdq
do
(echo g; echo n; echo; echo; echo 41984000; echo w;) | fdisk /dev/$DRIVE
done

Simulating a SAS physical pull out of a drive

Please, note:
Nothing is exactly the same as a physical disk pull.
A physical disk pull can trigger errors by the expander that will not be detected just emulating.
Hardware failures are complex, so you should not avoid testing physically.
If your company has the Servers in another location you should request them to have Servers next to you, or travel to the location and spend enough time hands on.

A set of commands very handy for simulating a physical drive pull, when you have not physical access to the Server, or working within a VM.

To delete a disk (Linux stop seeing it until next reboot/power cycle):

echo "1" > /sys/block/${device_name}/device/delete

Set a disk offline:

echo "offline" > /sys/block/${device_name}/device/state

Online the disk

echo "running" > /sys/block/${device_name}/device/state

Scan all hosts, rescan

for host in /sys/class/scsi_host/host*; do echo '- - -' > $host/scan; done

Disabling the port in the expander

This is more like physically pulling the drive.
In order to use the commands, install the package smp_utils. This is now
installed on the 4602 and the 4U60.

The command to disable a port on the expander:

smp_phy_control --phy=${phy_number} --op=dis /dev/bsg/${expander_id}

You will need to know the phy number of the drive. There may be a better
way, but to get it I used:

smp_discover /dev/bsg/${expander_id}

You need to look for the sas_address of the drive in the output from the
smp_discover command. You may need to try all the expanders to find it.

You can get the sas_address for your drive by:

cat /sys/block/${device_name}/device/sas_address

To re-enable the port use:

smp_phy_control --phy=${phy_number} --op=lr /dev/bsg/${expander_id}

Some handy scripts when working with ZFS

To kill one drive given the id (device name may change between reboots)

TO_REMOVE="wwn-0x5000c500a6134007"
DRIVE=`ls -al /dev/disk/by-id/ | grep ${TO_REMOVE} | grep -v "\-part" | awk '{ print $11 }' | tr --delete './'`; 

if [[ ! -z "${DRIVE}" ]];
then
    echo "1" > /sys/block/${DRIVE}/device/delete
else
    echo "Drive not found"
fi

Loop to see the status of the pool

while true; do zpool status carles-N58-C3-D16-P3-S1 | head --lines=20; sleep 5; done

Solving a persistent MD Array problem in RHEL7.4 (Dual Port SAS drives)

Ok, so I lend one of my Servers to two of my colleagues in The States, that required to prepare some test for a customer. I always try to be nice and to stimulate sales across the organizations I help, so if they need a Server for a PoC and demo to a customer, they know they can count on me.

It is important to remark that the Servers I was using had two motherboards, with their CPU and RAM, and Dual Port SAS drives. We had those Servers so we can implement High Availability. The Dual Port SAS allow two different computers or IO controllers to access the same drive at the same time.

I work with Declustered RAID, DRAID, and ZFS.

The Server was a 4U90, so a 4U Server with 90 SAS3 spinning drives and 4 SSD. Drives are Dual Ported, and two Controllers (motherboard + CPU + RAM) have access simultaneously to the drives for HA.

After their tests my colleagues, returned me the Server, and I needed to use it and my surprise was when I tried to provision with ZFS and I encountered problems. Not much in the logs. Please note I was using only one node (or controller), and the other was not in use but they ask me to keep the OS and the data (in 2xMD drive). I shutdown the node A after the Engineers in San Jose powered the Server off, so only my node was working.

I checked:

cat /proc/mdstat

And that was the thing 8 MD Arrays where there.

[root@4u90-B ~]# cat /proc/mdstat 
Personalities : 
md2 : inactive sdba1[9](S) sdag1[7](S) sdaf1[3](S)
11720629248 blocks super 1.2

md1 : inactive sdax1[7](S) sdad1[5](S) sdac1[1](S) sdae1[9](S)
12056071168 blocks super 1.2

md0 : inactive sdat1[1](S) sdav1[9](S) sdau1[5](S) sdab1[7](S) sdaa1[3](S)
19534382080 blocks super 1.2

md4 : inactive sdbf1[9](S) sdbe1[5](S) sdbd1[1](S) sdal1[7](S) sdak1[3](S)
19534382080 blocks super 1.2

md5 : inactive sdam1[1](S) sdan1[5](S) sdao1[9](S)
11720629248 blocks super 1.2

md8 : inactive sdcq1[7](S) sdz1[2](S)
7813752832 blocks super 1.2

md7 : inactive sdbm1[7](S) sdar1[1](S) sdy1[9](S) sdx1[5](S)
15627505664 blocks super 1.2

md3 : inactive sdaj1[9](S) sdai1[5](S) sdah1[1](S)
11720629248 blocks super 1.2

md6 : inactive sdaq1[7](S) sdap1[3](S) sdr1[8](S) sdp1[0](S)
15627505664 blocks super 1.2

Ok. So I stop the Arrays

mdadm --stop /dev/md127

And then I zero the superblock:

mdadm --zero-superblock /dev/sdb1

After doing this for all I try to provision and… surprise! does not work. /dev/md127 has respawned like in the old times from Doom video game.

I check the mdmonitor service and even disable it.

systemctl disable mdmonitor

I repeat the process.

And /dev/md127 appears again, using another device.

At this point, just in case, I check the other controller, which should be powered off.

Ok, it was on. With different Ip, so it was not answering to ping, but I still had access to BMC//IPMI. After confirming with my colleagues that I can shutdown that node (they did not turn it on apparently) I launch the poweroff command, and repeat, same!.

I see that the poweroff command on the second Controller is doing a reboot, not poweroff. Is a Firmware issue I find. So I access to the Linux from the management tool and I launch the halt command that makes it not respond to the ping anymore.

I repeat the process, and still the ghost md array appears there, and blocks me from doing my zpool create.

The /etc/mdadm.conf file did not exist (by default is not created).

I try a more aggressive approach:

DRIVES=`cat /proc/partitions | grep 3907018584 | awk '{ print $4; }'`

for DRIVE in $DRIVES; do echo "Trying /dev/${DRIVE}1"; mdadm --examine /dev/${DRIVE}1; done

Ok. And destruction time:

for DRIVE in $DRIVES; do echo "Trying /dev/${DRIVE}"; wipefs -a -f /dev/${DRIVE}; done

for DRIVE in $DRIVES; do echo "Trying /dev/${DRIVE}1"; mdadm --zero-superblock /dev/${DRIVE}1; done

Apparently the system is clean, but still I cannot provision, and /dev/md127 respawns and reappears all the time.

After googling and not finding anything about this problem, and my colleagues no having clue about what is causing this, I just proceed with a simple solution, as I need the Server for my company completing the tests in the next 24 hours.

So I create the file /etc/mdadm.conf with this content:

[root@draid-08 ~]# cat /etc/mdadm.conf 
AUTO -all

After that I rebooted the Server and I saw the infamous /dev/md127 is not there and I’m able to provision.

I share the solution as it may help other people.

The most straightforward procedure would had been reinstalling clean the OS, but this operation is very slow when simulating a Virtual CD remotely, so it was worth fixing that as OS level, as I save one day delaying my work.

ZFS Improving iSCSI performance for Block Devices (trick for Volumes)

ZFS has a performance problem with the zvol volumes.

Even using a ZIL you will experience low speed when writing to a zvol through the Network.

Even locally, if you format a zvol, for example with ext4, and mount locally, you will see that the speed is several times slower than the native ZFS filesystem.

zvol volumes are nice as they support snapshots and clone (from the snapshot), however too slow.

Using a pool with Spinning Drives and two SSD SLOG devices in mirror, with a 40Gbps Mellanox NIC accessing a zvol via iSCSI, with ext4, from the iSCSI Initiator, you can be copying Data at 70 MB/s, so not even saturating the 1Gbps.

The trick to speed up this consist into instead of using zvols, creating a file in the ZFS File System, and directly share it through iSCSI.

This will give 4 times more speed, so instead of 70MB/s you would get 280MB/s.

Creating a compressed filesystem with Linux and ZFS (using just files)

Many times it could be very convenient to have a compressed filesystem, so a system that compresses data in Real Time.

This not only reduces the space used, but increases the IO performance. Or better explained, if you have to write to disk 1GB log file, and it takes 5 seconds, you have a 200MB/s performance. But if you have to write 1GB file, and it takes 0.5 seconds you have 2000MB/s or 2GB/s. However the trick in here is that you really only wrote 100MB, cause the Data was compressed before being written to the disk.

This also works for reading. 100MB are Read, from Disk, and then uncompressed in the memory (using chunks, not everything is loaded at once), assuming same speed for Reading and Writing (that’s usual for sequential access on SAS drives) we have been reading from disk for 0.5 seconds instead of 5. Let’s imagine we have 0.2 seconds of CPU time, used for decompressing. That’s it: 0.7 seconds versus 5 seconds.

So assuming you have installed ZFS in your Desktop computer those instructions will allow you to create a ZFS filesystem, compressed, and mount it.

ZFS can create pools using disks, partitions or other block devices, like regular files or loop devices.

# Create the File that will hold the Filesystem, 1GB

root@xeon:/home/carles# dd if=/dev/zero of=/home/carles/compressedfile.000 bs=1M count=1024
1024+0 records in
1024+0 records out
1073741824 bytes (1.1 GB, 1.0 GiB) copied, 0.621923 s, 1.7 GB/s

# Create the pool

zpool create compressedpool /home/carles/compressedfile.000

# See the result

# If you don’t have automount set, then set the mountpoint

zpool set compressedpool mountpoint=/compressedpool

# Set the compression. LZ4 is fast and well balanced

zfs set compression=lz4 compressedpool

# Push some very compressible 1GB file. Don’t use just 0s as this is optimized :)

# Myself I copied real logs

ls -al --block-size=M *.log
-rw------- 1 carles carles 1329M Sep 26 14:34 messages.log
root@xeon:/home/carles# cp messages.log /compressedpool/

Even if the pool only had 1GB we managed to copy 1.33 GB file.

Then we check and only 142MB are being used for real, thanks to the compression.

root@xeon:/home/carles# zfs list
NAME USED AVAIL REFER MOUNTPOINT
compressedpool 142M 738M 141M /compressedpool
root@xeon:/home/carles# df /compressedpool
Filesystem 1K-blocks Used Available Use% Mounted on
compressedpool 899584 144000 755584 17% /compressedpool

By default ZFS will only import the pools that are based on drives, so in order to import your pool based on files after you reboot or did zfs export compressedpool, you must specify the directory:

zpool import -d /home/carles compressedpool

You can also create a pool using several files from different hard drives. That way you can create mirror, RAIDZ1, RAIDZ2 or RAIDZ3 and not losing any data in that pool based on drives in case you loss a physical drive.

If you use one file in several hard drive, you are aggregating the bandwidth.

You can also do this in your instances or VMs. Create one file of 1GB and creating the pool for compressed logs or compressed core dumps. If later you need more space you can add another file to he pool. You don’t need to use any redundancy, just creating a pool with mountpoint /var/log or /var/core and grow as you need.

Logs and core dumps can be greatly compressed, for example a core dump of 54MB will be around 645KB if you compress it using a tool like bzip2. Using the compression from ZFS, you can choose different algorithms of compression, so expect a massive reduction of space and huge space savings for logs and core dumps.

My talk at OpenZFS 2018 about DRAID

This September I was invited to talk in OpenZFS 2018 about DRAID and Cold Storage (Spinning drives) in San Francisco, US.

Thanks to @delphix for all their kindness.

Here you can watch mine and all the presentations.

The slides:


You can download the video of the sample Rebuild with DRAID in here:

draid-rebuild-read-write-1sec-vokoscreen-2018-09-06_11-37-48

Also in the Hackaton I presented my mini utility run_with_timeout.sh to execute a command (zdb, zpool, zfs, or any shell command like ls, “sleep 5; ping google.com”…) with a timeout, and returning a Header with the Error Level and the Error Level itself.

Myself I appear at minute 53:50.

Special greetings to my Amazing Team in Cork, Ireland. :)