This article explains how you can protect your WordPress site from attacks using my PHP Firewall WordPress plugin version 1.0.8.
This plugin is a commercial plugin, with one time fee, that it’s absolute worth it. It is not available as free plugin lite in WordPress.org. Only in my Software store. It is also available as PHP Firewall Drupal module.
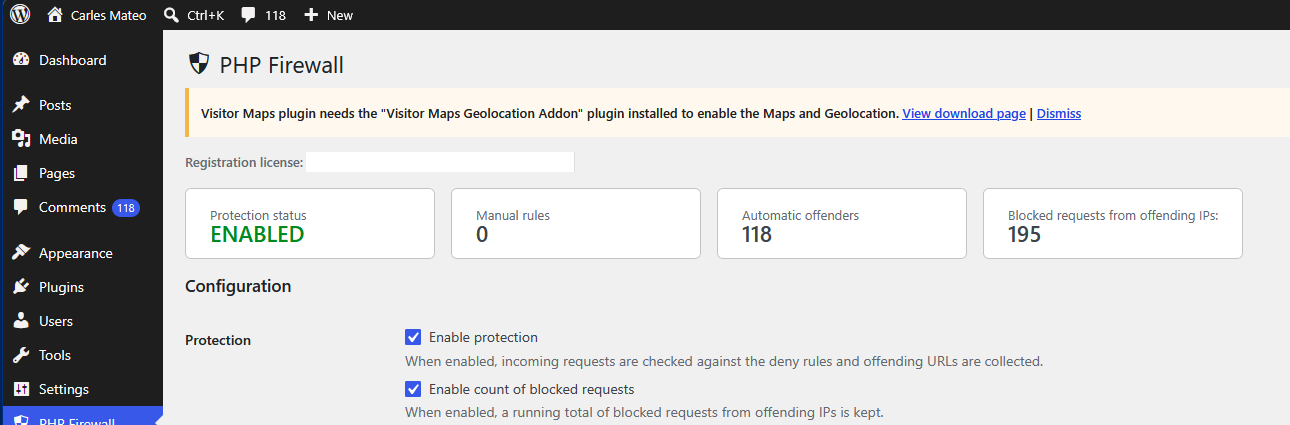
Once you install the plugin, you click in Enable protection and the Firewall will start to detect attempts to find exploits in your server automatically, and will block the offending IPs.
If you Enable count of blocked requests you’ll see than in few minutes, the Firewall has blocked hundreds of attempts.
In this example, I activated the protection, and after some time it has automatically detected and blocked 118 offending IP Addresses, and has blocked 195 malevolent requests.
In 36 hours the number of blocked requests will get to thousands:
Enabling the count of blocked requests makes a small update in the database to increment the counter, it’s a very lightweight operation, but it is worth it to get an idea of how many malevolent requests the software is blocking. You can enable it for an hour, see how many bad requests you get, and disable it if you want.
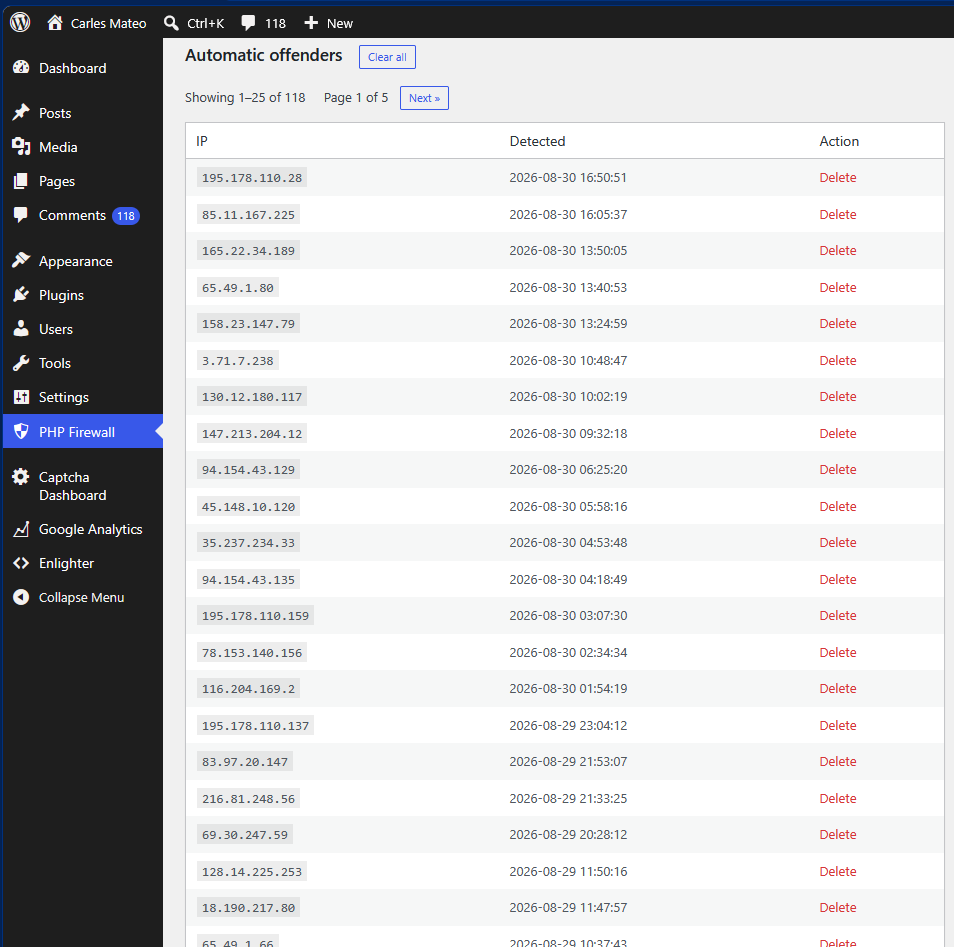
Once you activate the protection you will start to see IP Addresses that have been blocked because they attempted a known exploit, and the IPs have been added to the list of Automatic offenders.
This function is known as WAF or Web Application Firewall.
Once an IP is detected as offender, it will get a 403 Forbidden answer from the Server immediately, and the precious resources from the server will be saved (CPU, Memory, Internet bandwidth).
If you want, you can delete the IP from the list to allow it access again (for example, if a colleague was doing a test).
As you see, you will get many IP from attackers blocked in a short window of time.
The reality is that bots are trying exploits against random IP Addresses all the times, and some times your server will go very slow because of all those bots trying to hack into your server, and your visitors will experience slow loading pages or even the server may crash due to all these bots activity. Also, depending on your Cloud provider, you may be paying for Internet Outgoing traffic that is consumed by bots.
So this plugin is a must have, in my opinion as Engineer. That’s why I created it. Because many people was asking for help.
But there are other types of abuse. For example, malicious bots will try to get access to your blog by doing requests with random passwords to wp-login.php every second.
The Firewall cannot block this route by default because is the route that legit users use to login to WordPress. But we have functionalities in the plugin to deal with these attacks (without having to analyse the web server logs, which is a task that System Administrators and Site Reliability Engineers do).
Activate Enable log of non blocked requests for analysis
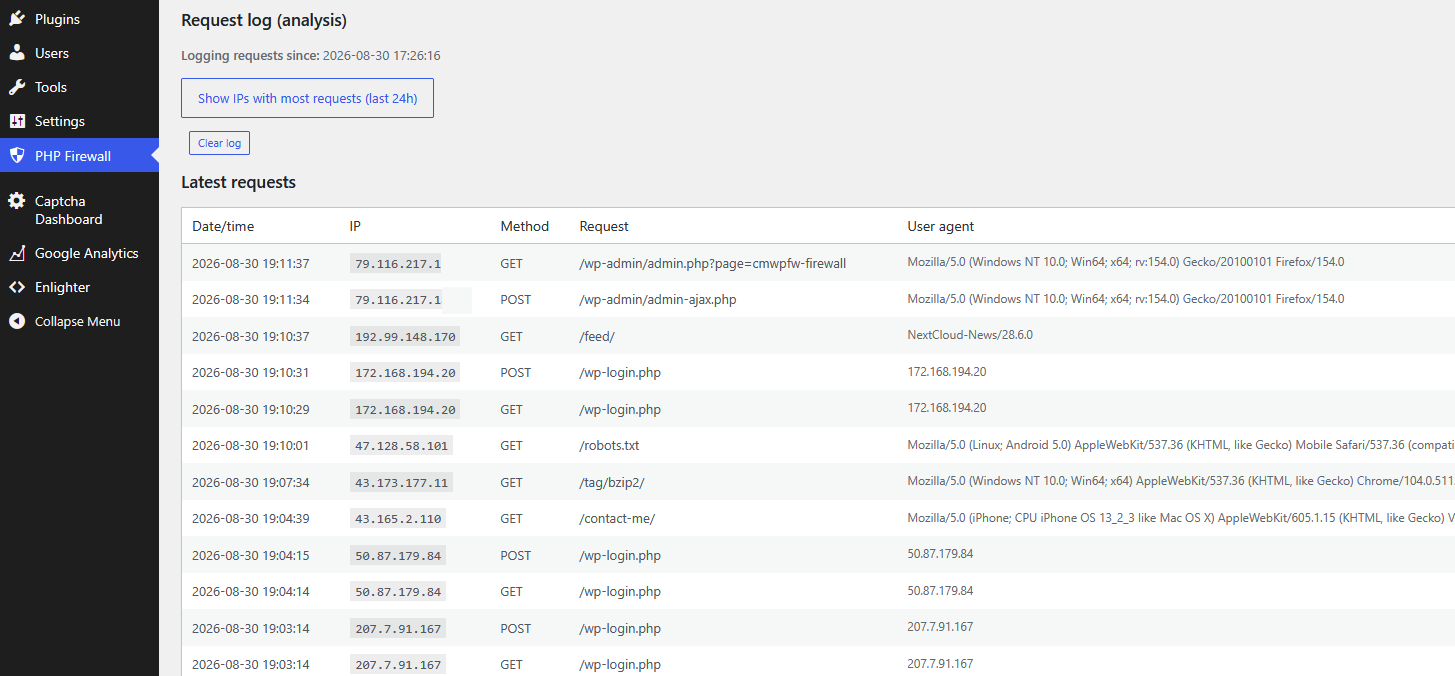
This will record every allowed request (not the blocked ones), so we can analyse them.
Just scroll down, to Latest requests
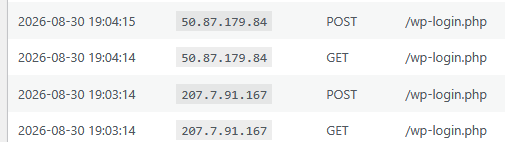
As you can see there are IP Addresses that did a POST to /wp-login.php
That means that attempted to login in your site. So, they tried a password to hack your WordPress site.
Those IP Addresses are attempting to login every second or every two seconds.
These kind of attacks are not only bad, as they can get access to your site, they can also degrade the health of your database.
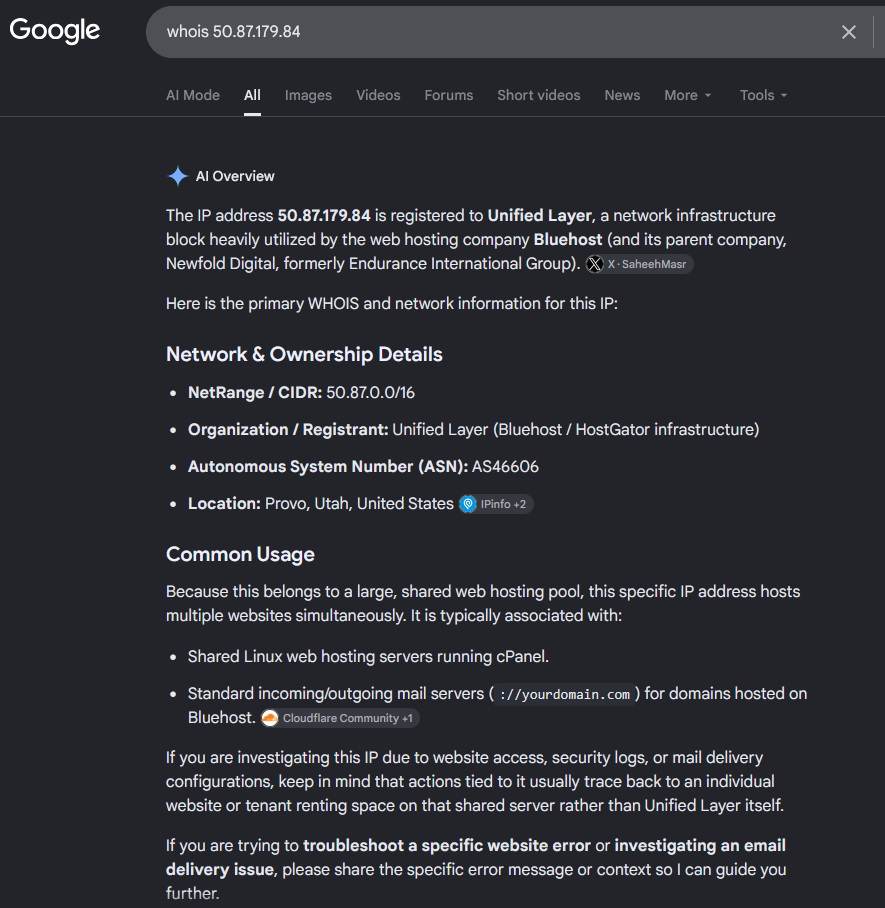
You can investigate where these IP’s come from doing a Whois search, or asking Google: whois 50.87.179.84
So, it’s a hosting from Bluehost / HostGator, a Cloud Provider. Servers from Cloud providers are typically hacked to try to hack other servers.
You can block the IP directly in the PHP Firewall using the custom rules, or as you can see in the information provider, this Cloud Provider has a NetRange / CIDR of 50.87.0.0/16.
A block /16 comprises 65,536 IP Addresses, so you’ll probably get attacks from many different IP’s in from that block. Instead of blocking just the IP that attacked your site, my approach is to block all the IP’s from that block.
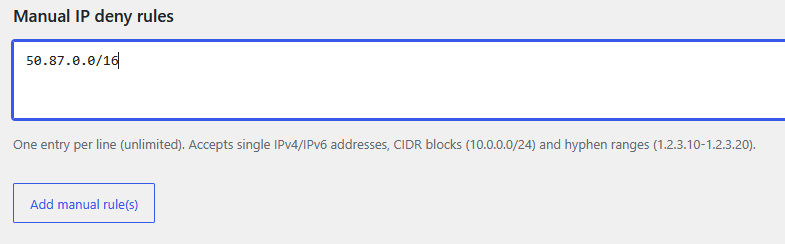
So we add to Manual IP deny rules the block:
The reasoning about blocking all the 65,536 IP Addresses from the Cloud provider is that your WordPress site is probably a site for humans. You want humans to read your blog posts, or if it’s an e-Commerce site, you want to sell to humans. You don’t want bots to use the resources of your server or to try to hack your server. So blocking Cloud Provider’s IP ranges, seems like a good strategy.
If you are one of the few WordPress sites with third party integrations that need to be reached from Cloud providers, you can avoid denying those blocks of IP Addresses that your partners use.
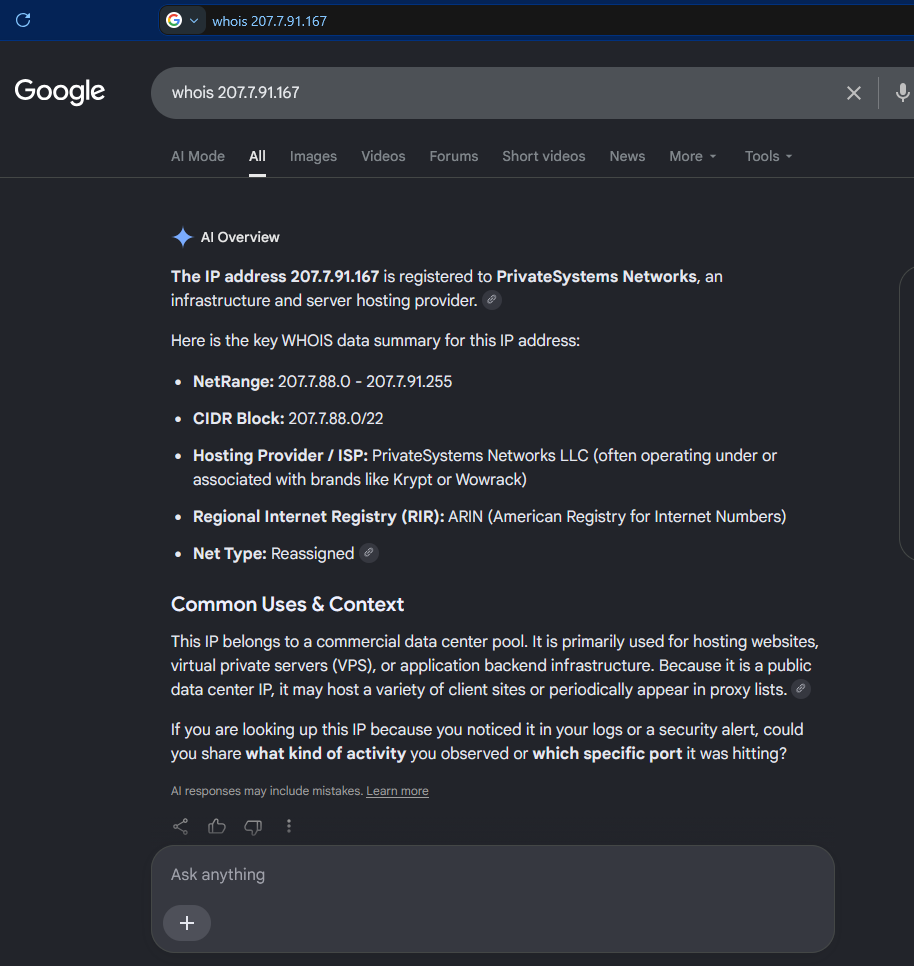
We investigate the other IP:
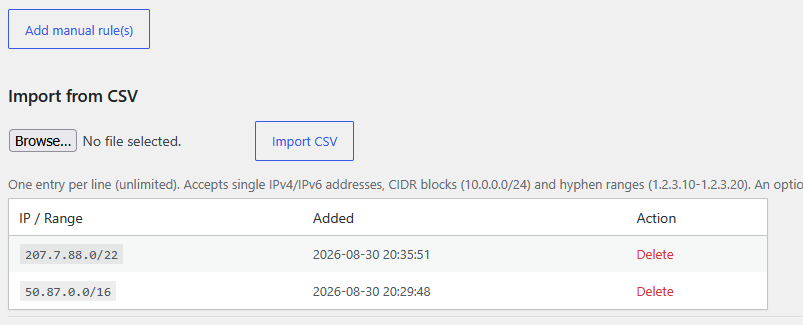
And it’s the same case, so we also block the CIDR Block in the PHP Firewall.
A /22 block comprises 1,024 IP Addresses. So, with two lines in our firewall we have blocked potential malicious requests from 66,560 IP Addresses.
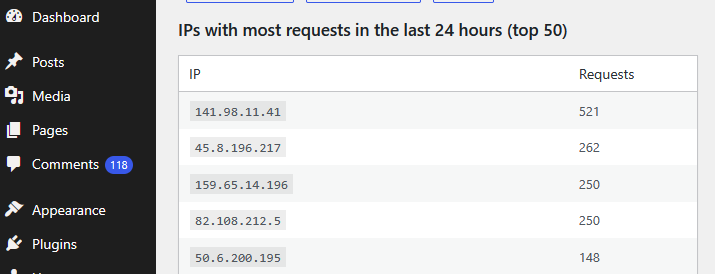
Obviously we cannot analize all the requests we get, but Firewall PHP plugin provides a very useful tool that will display the IP Addresses that did more request to our server in the last 24 hours.
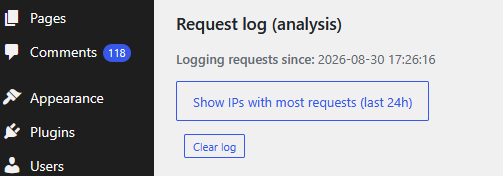
Just click on Show IPs with most requests (last 24h)
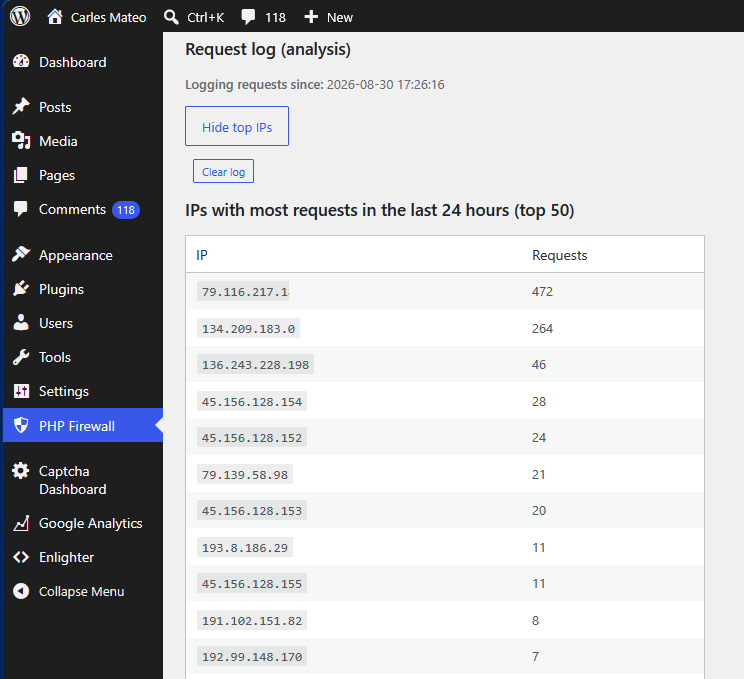
The top 50 IP Addresses that performed more requests are displayed:
In this case, the first IP Address belongs to my own IP Address. Which makes sense because WordPress opened in the browser keeps doing requests to the server.
As I activated the log at 17:26:16 and it’s 21:44:10 in around 4 hours and 15 minutes I got an IP Addresses that did 264 requests.
The IP 134.209.183.0 has performed 264 requests that went through.
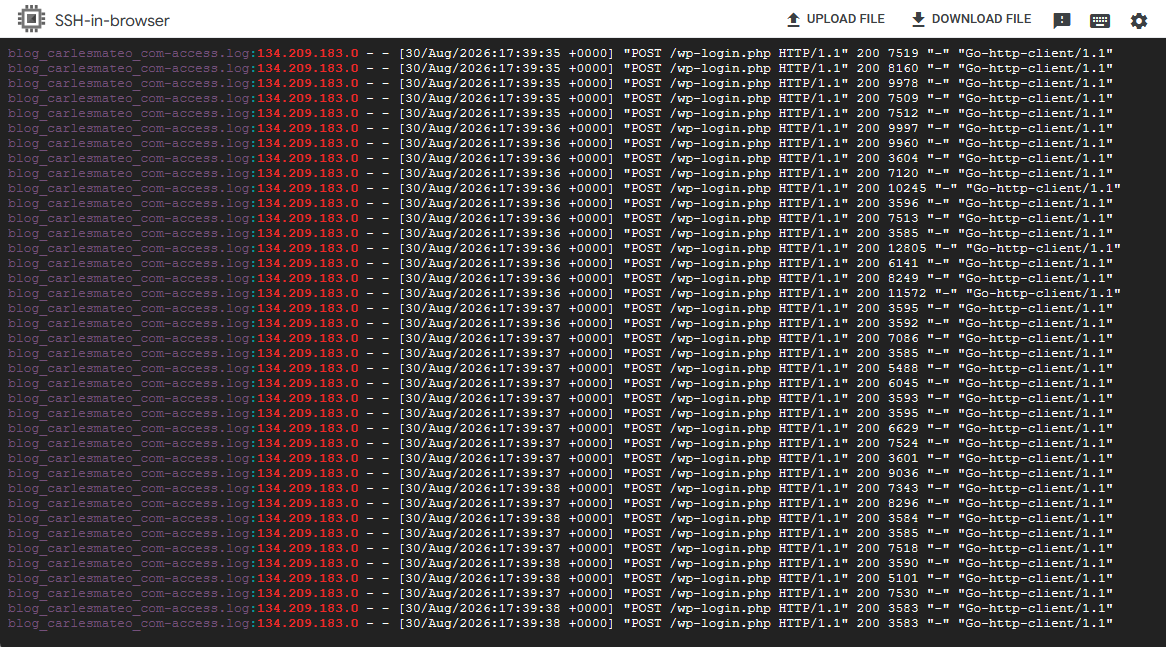
If I check the logs of the server I see that it was attempting to hack the server (trying user/password on wp-login.php)
grep "134.209.183.0" *.log
As you can see, this IP was requesting 12 requests per second trying to hack into /wp-login.php
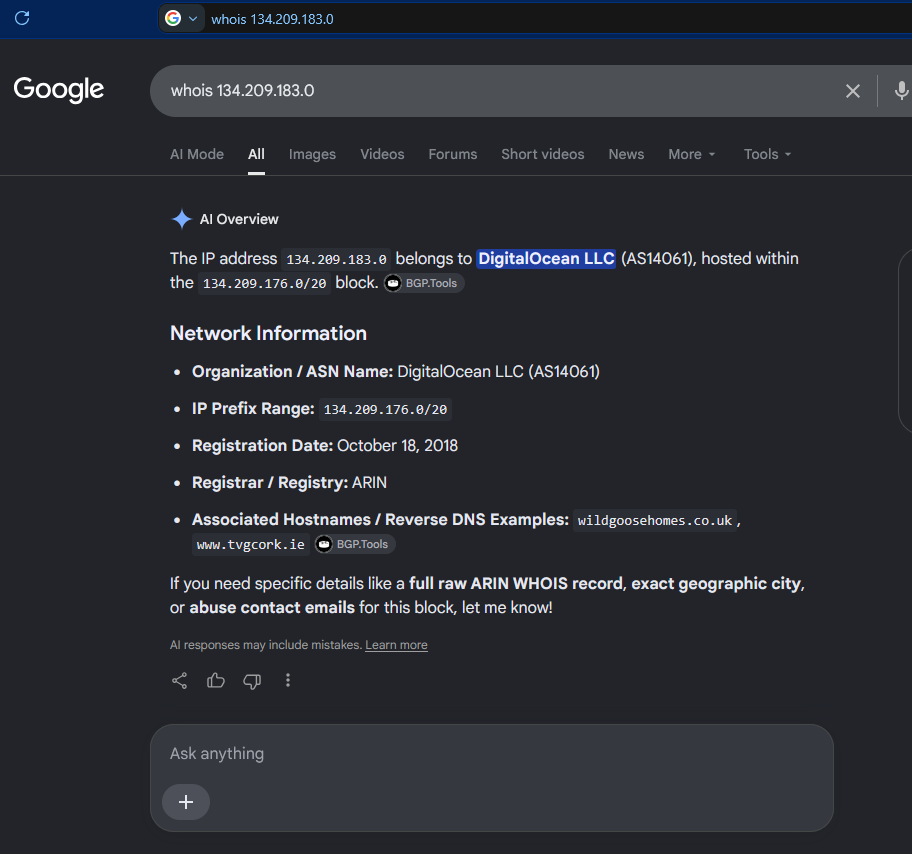
And if we do the whois of this IP Address, it belongs to Digital Ocean:
So we block the entire block 134.209.176.0/20 in the PHP Firewall.
Now the server will block any request from the 4,096 in that block range and will not spend time and resources that are intended for your human visitors.
Most of the attacks come from Cloud providers. Normally are servers that got hacked, and they used those servers to try to hack other servers.
PHP Firewall provides great help in protecting your sites, specially if you don’t have a dedicated team of System Engineers that check the logs regularly, and block the offending IP Addresses in the firewalls.
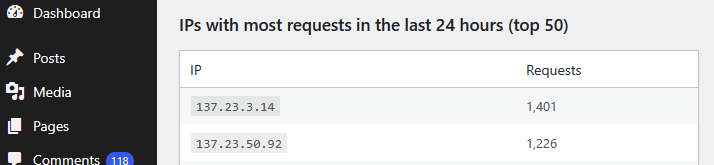
After 12 hours we see more IP Addresses that made thousands of requests:
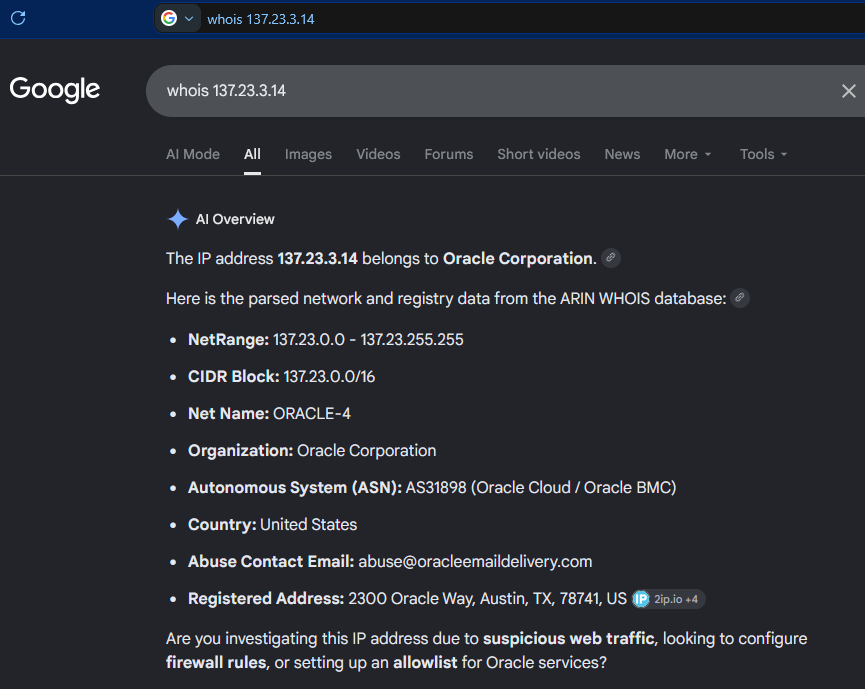
According to google those IP Addresses belong to Oracle Cloud:
So, we block the CIDR Block: 137.23.0.0/16 (which will block the two offending IP Addresses, as they form part of that block)
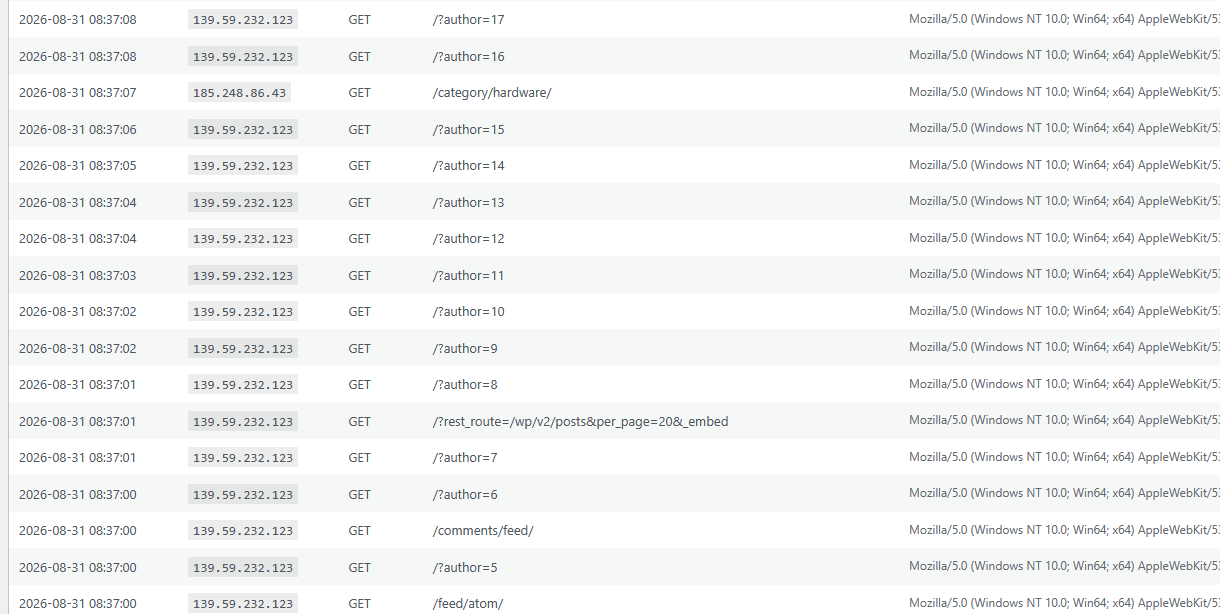
In the latest requests we can see how are new IP Addresses scanning for authors in order to try to attempt logins:
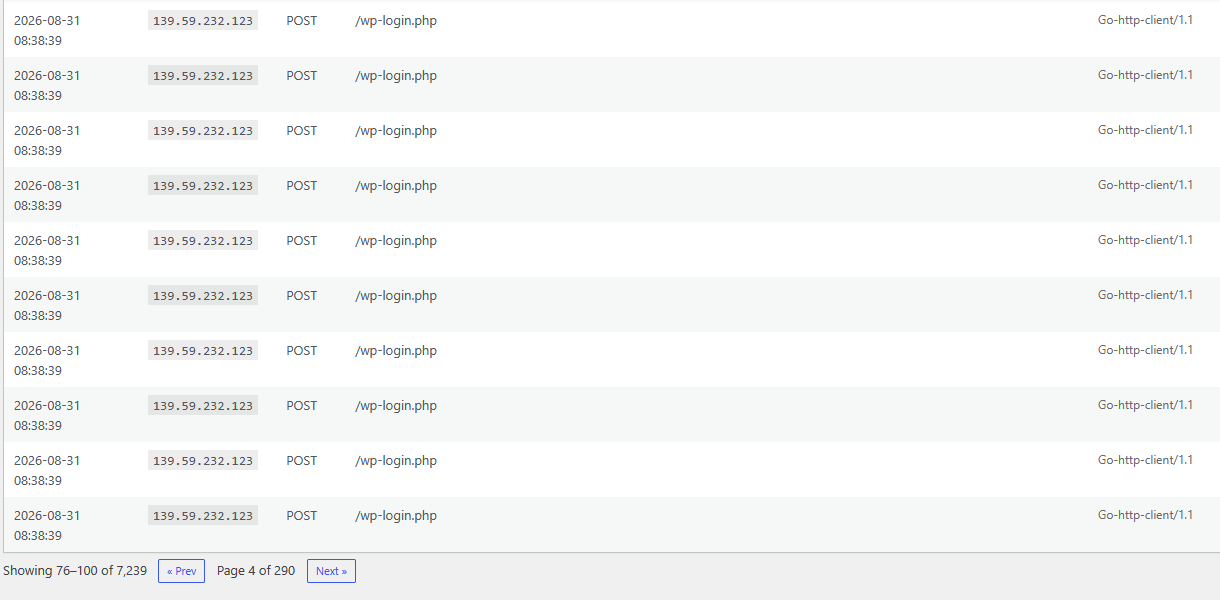
As you can see this IP Address is doing 10 requests in the same second trying passwords (POST to /wp-login.php) in order to attempt to hack the WordPress site.
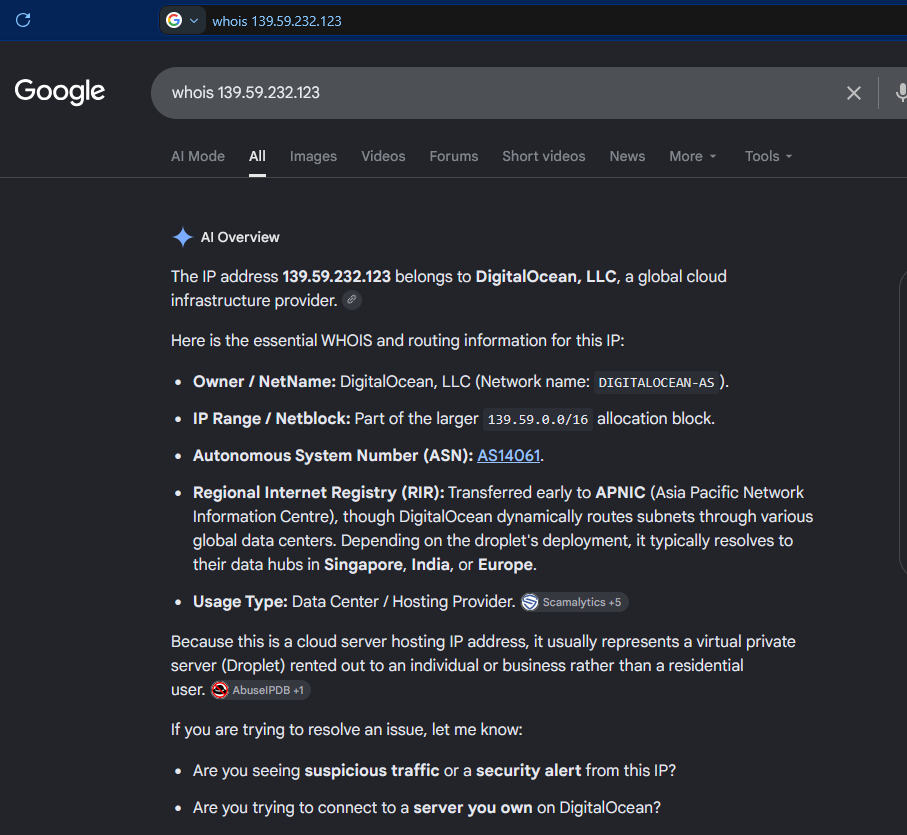
We do a whois search to see who is the owner of that IP Address:
Is from DigitalOcean, the Cloud Provider. We block all the Netblock 139.59.0.0/16
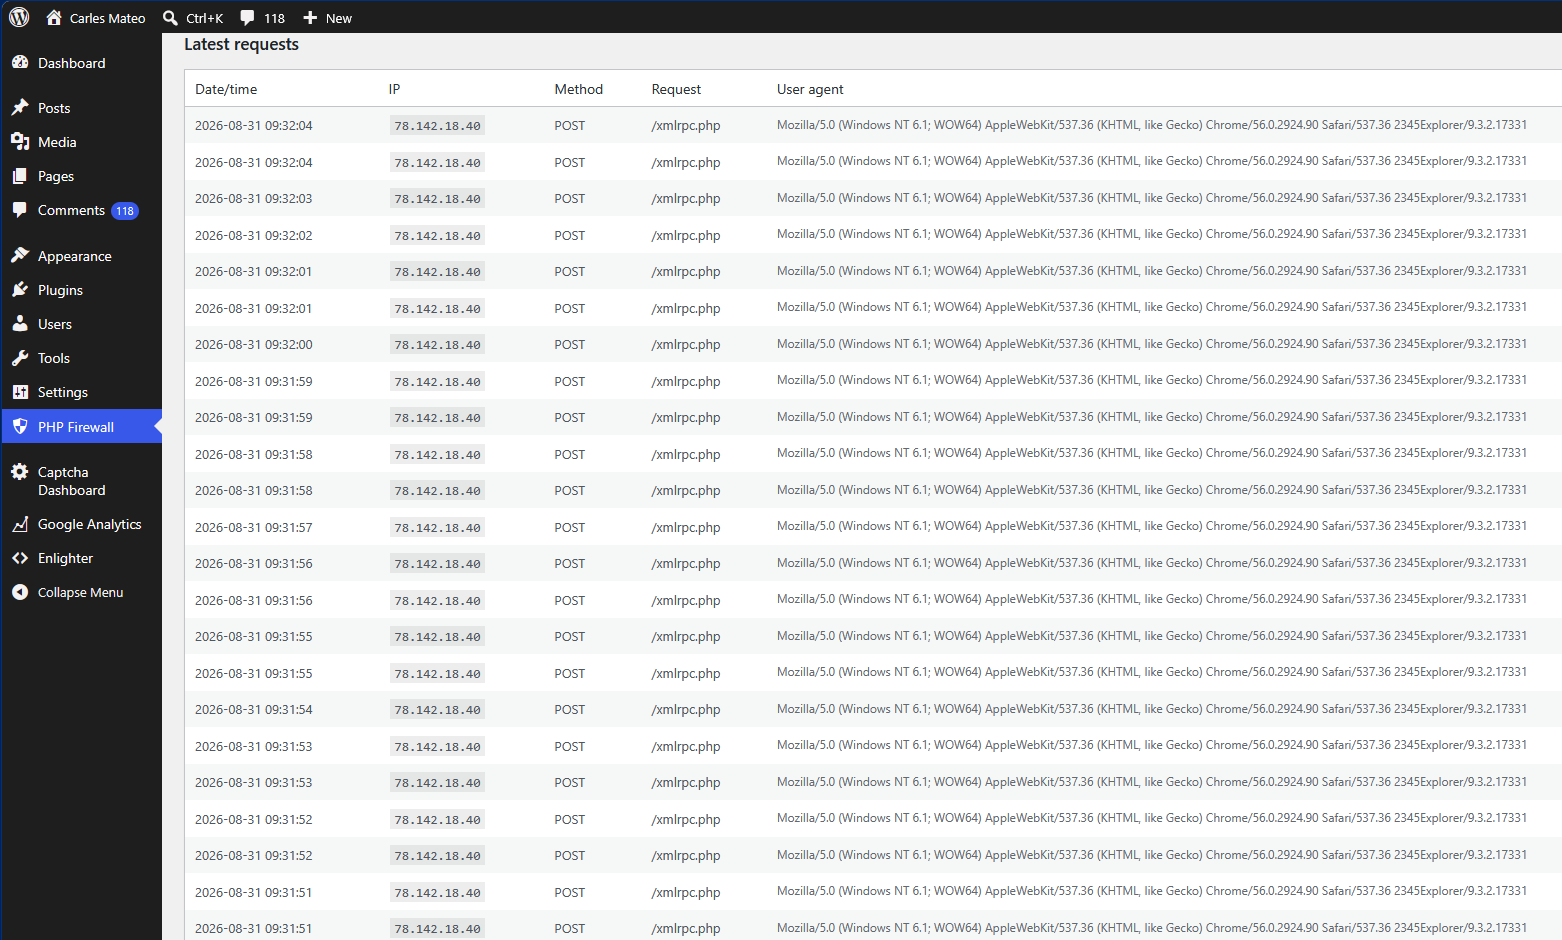
We see a new IP attacking the server, it is attempting two connections per second POST to /xmlrpc.php which tries to perform actions on the site. xmlrpc.php is a legit mechanism from WordPress, for example to register pingbacks, so it is not blocked by default. But hackers use xmlrpc.php to try thousands of passwords at once without passing by the login screen.
If you do not use older mobile apps or specific remote publishing tools that rely on it you sholud block xmlrpc.php
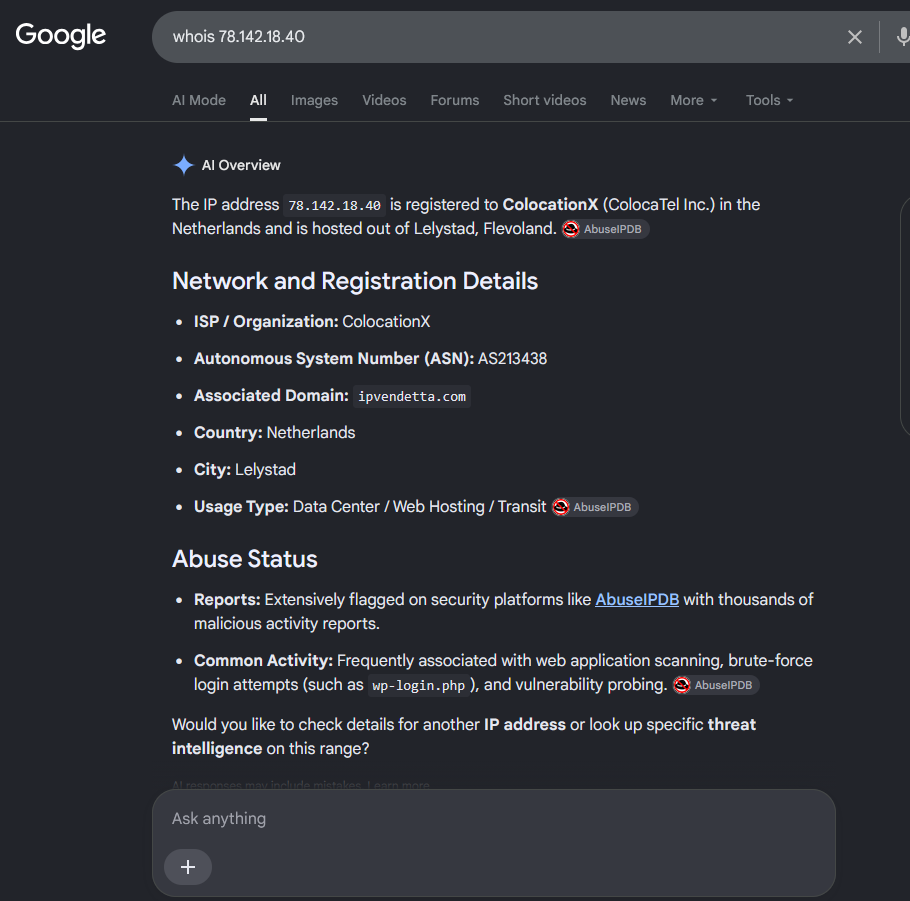
The whois shows that many attacks come from this provider:
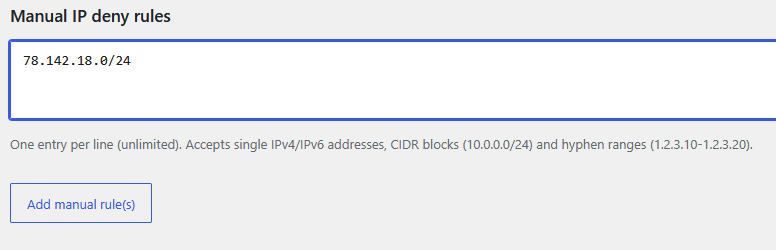
We can block the 256 IP Addresses of the class C, so: 78.142.18.0/24
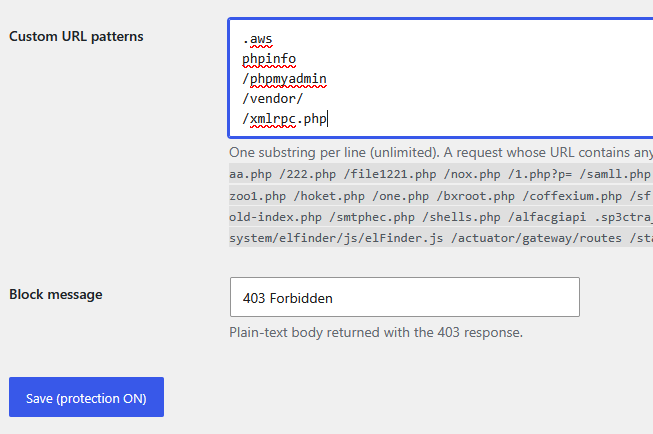
We will also block the requests to /xmlrpc.php using Custom URL patterns:
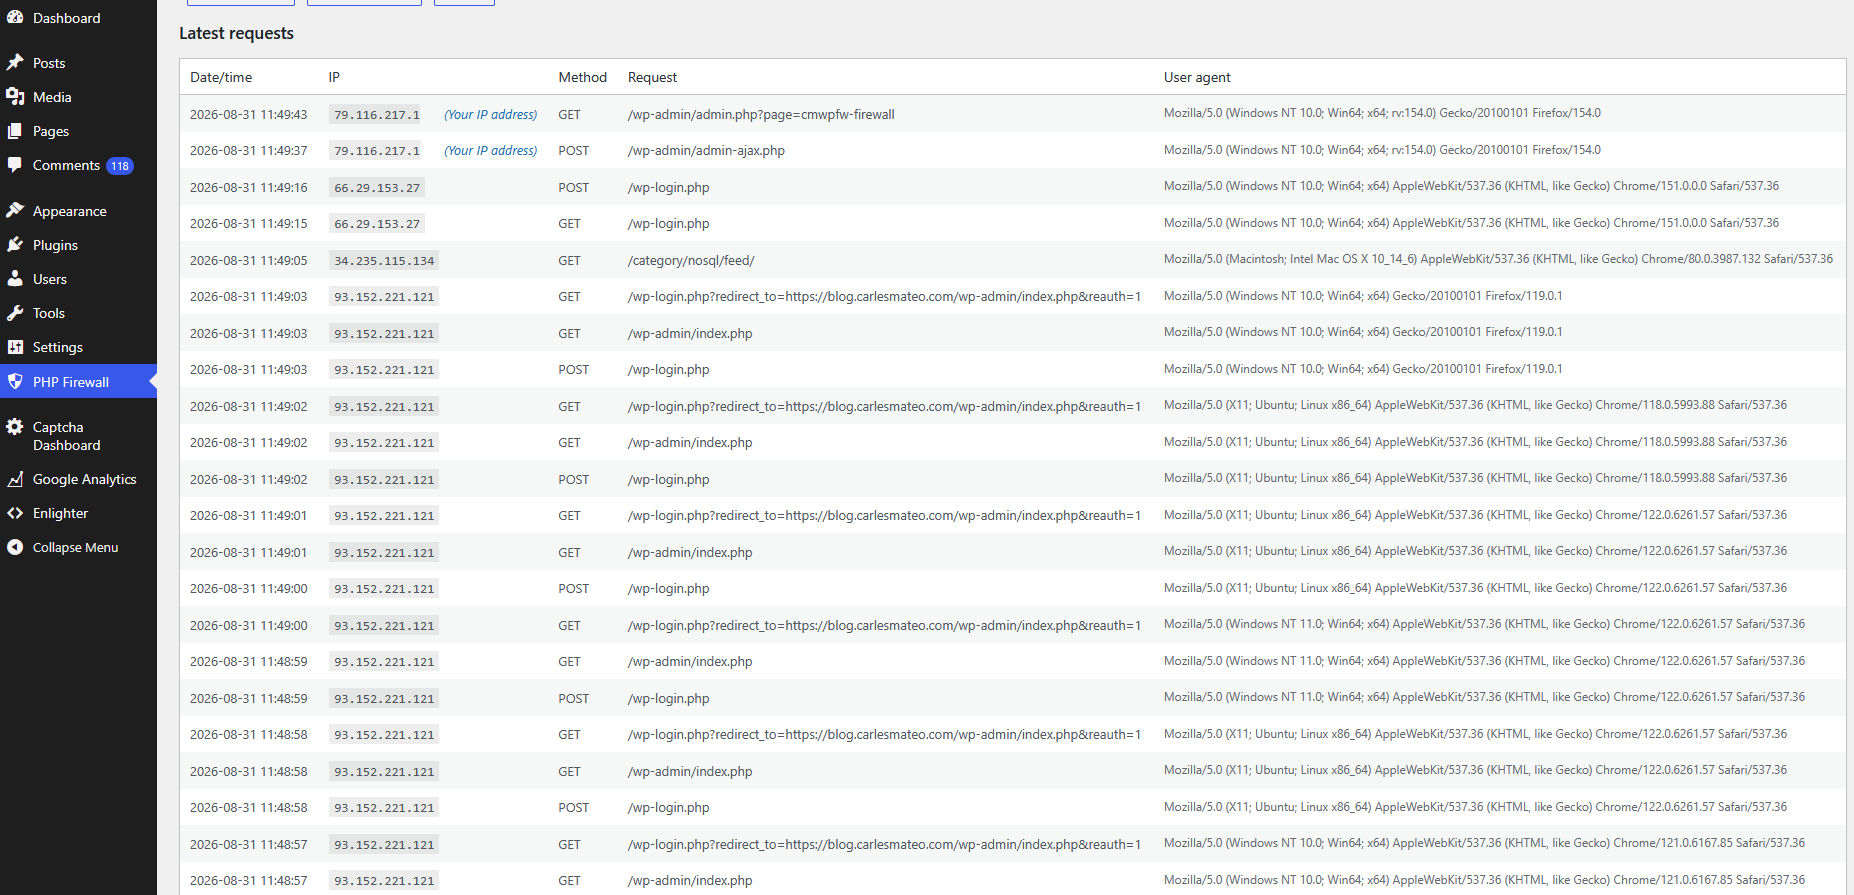
Later, we see that there are more IPs attacking trying to abuse wp-login.php so we will block them:
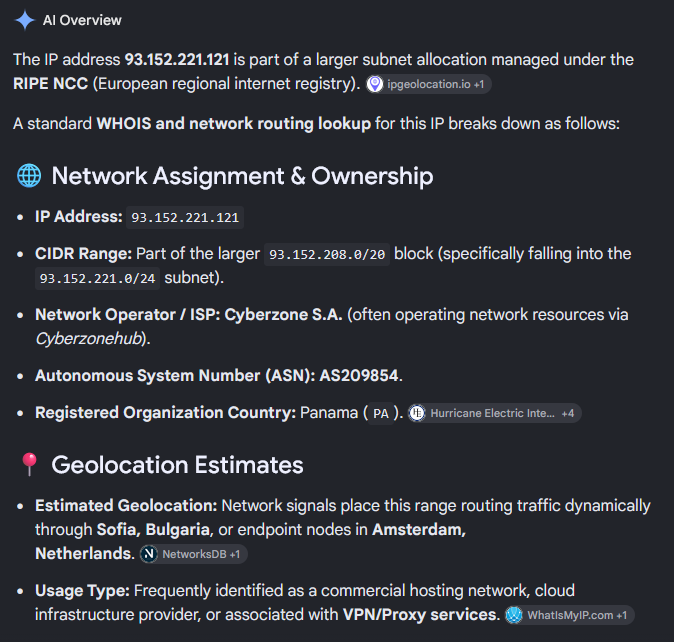
We check the IP that is doing so many attempts to hack requesting wp-login.php
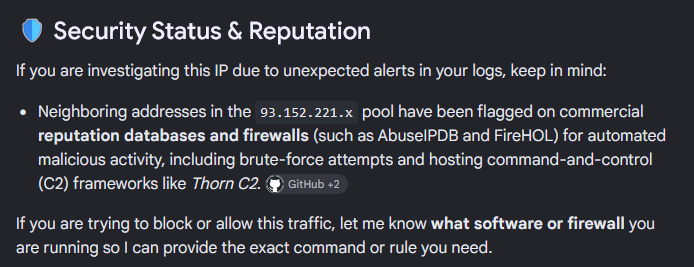
And all the range has been flagged for automated malicious activity and brute-force attempts
So we block all the 256 IP (class C) 93.152.221.0/24.
Two days later I check the IPs doing more requests:
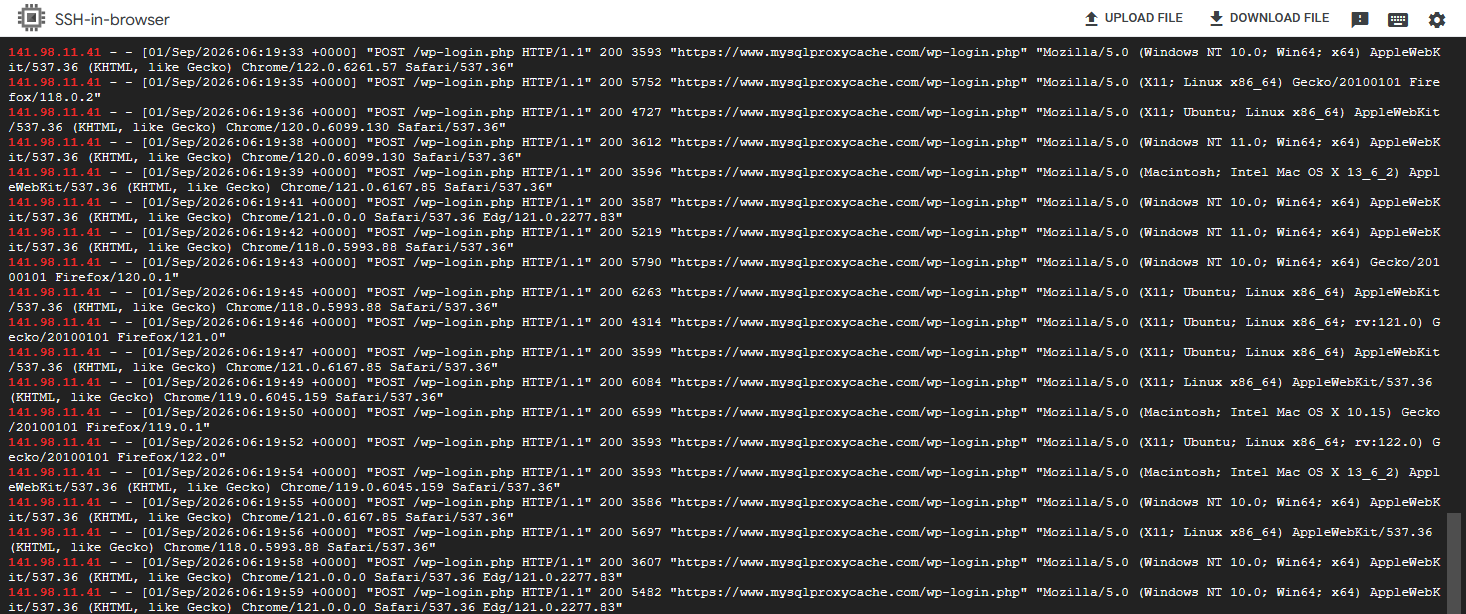
I looked at the logs what requests was doing the first IP:
All were attempts to hack the site through /wp-login.php
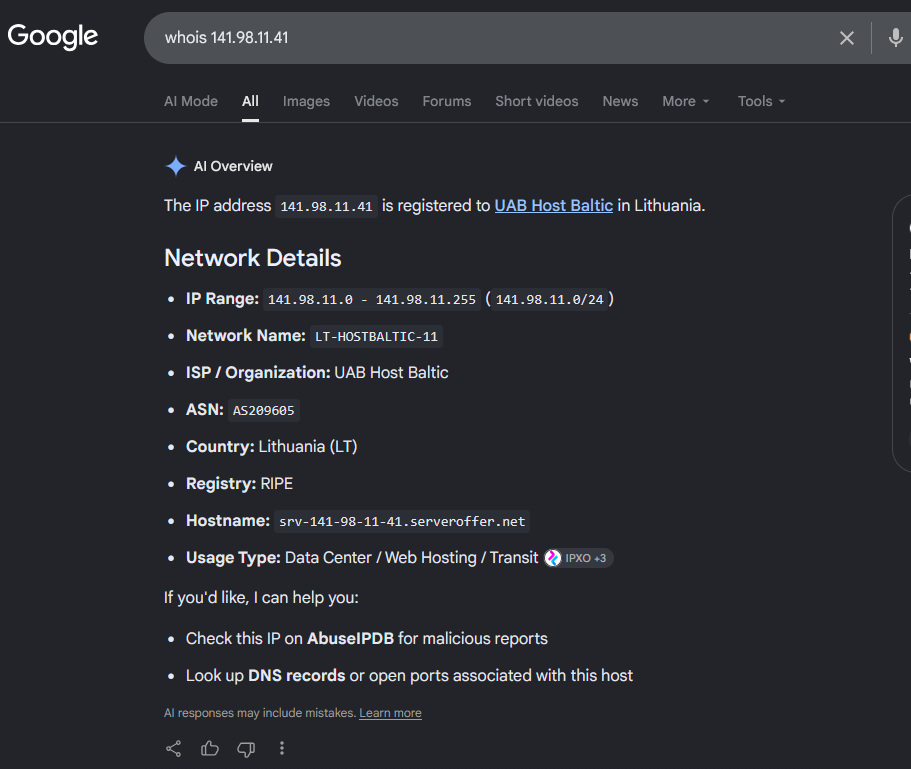
We check what kind of IP is this, and it’s from a Cloud provider:
So we block the range 141.98.11.0/24 in IP Firewall.
If you have SSH to the server you can block it in the firewall.
For Ubuntu, with ufw that is:
sudo ufw insert 1 deny from 141.98.11.0/24 to any
PHP Firewall WordPress plugin is a great help, as it blocks most of the attacks automatically, and offers you tools to detect the IPs that do more requests, so you can block them (or the entire range) easily, and to track the latest requests and export them.
Also, the price of the plugin is one time fee per site. Not a recurring payment.
If you want to acquire the Firewall rules that we have been collecting over the years, you can also buy the Firewall rules of Cloud providers from which we received attacks. These can be applied to any Firewall software, for instance Ubuntu ufw, or to my plugin/modules.
I tested Google Cloud when they were in beta, years ago, and I helped their Team to improve the service. And I’ve been using Google Cloud for years.
Here I explain, how an incident, this August, almost made me leave Google Cloud for good. In fact, I migrated many services to other providers. I walk through the steps I took.
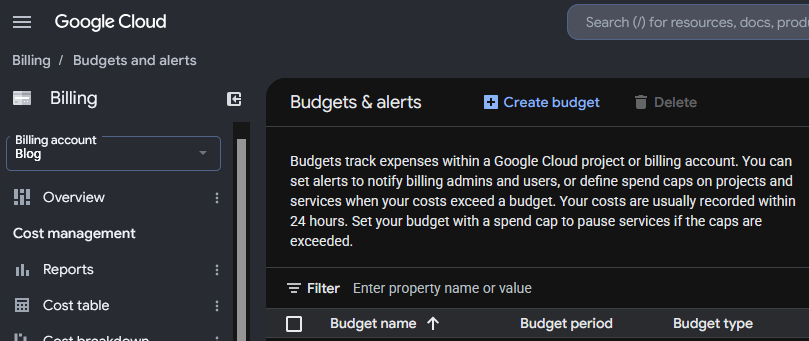
The best advice to start with, is, enable Cloud Billing alerts.
Everything started with the alert of Cloud Billing alerting me that half of the budget for the month had been exhausted around the 7th of the month. I checked the panel, and at the beginning I didn’t pay much attention to it, as Billing was indicating that the extra cost was in Compute in a specific region where I had provisioned new instances and more storage and it was just few euros.
Compute Engine Costs are mixed with the bandwidth consumption in the Dashboards which makes no sense:
So, I had to check different dashboards to realise it was a data transfer issue, and honestly, at the beginning I didn’t know where the problem was, but as I wrongly inferred, that the instance generating egress traffic was the one named “ubuntu26-04” I was investigating mainly that.
The first thing to learn that Google Cloud Billing shows the pure Compute and bandwidth usage together. I dislike it, for obvious reasons.
Next day budget for the month was almost gone.
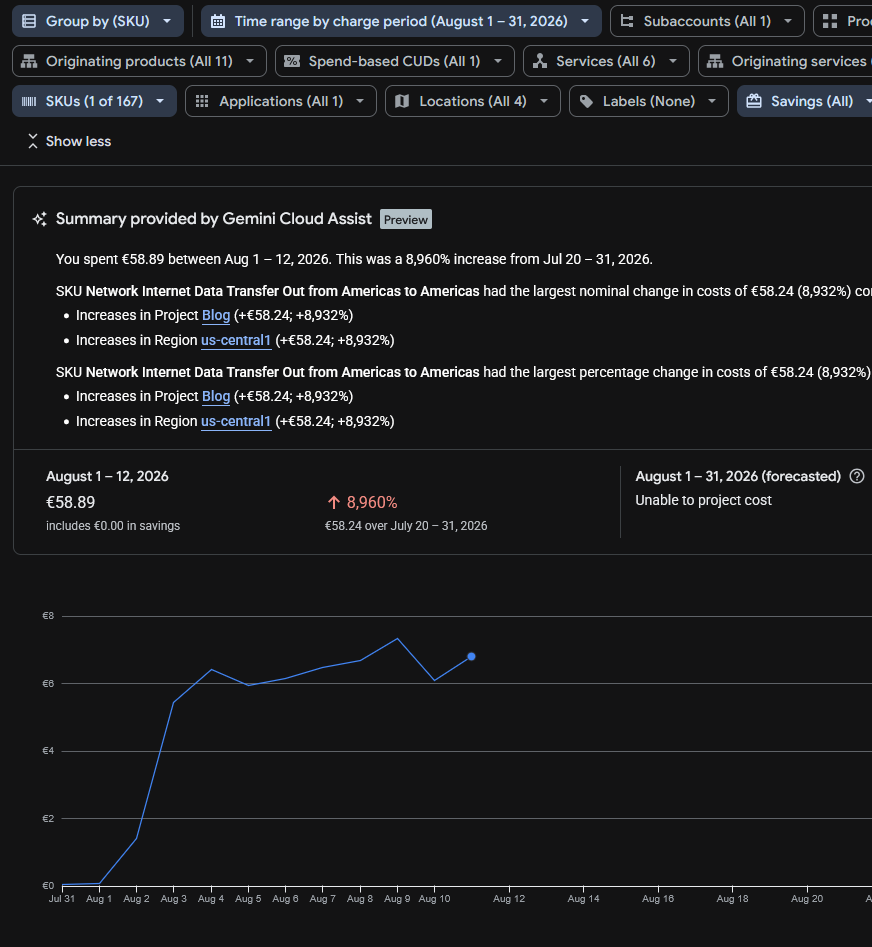
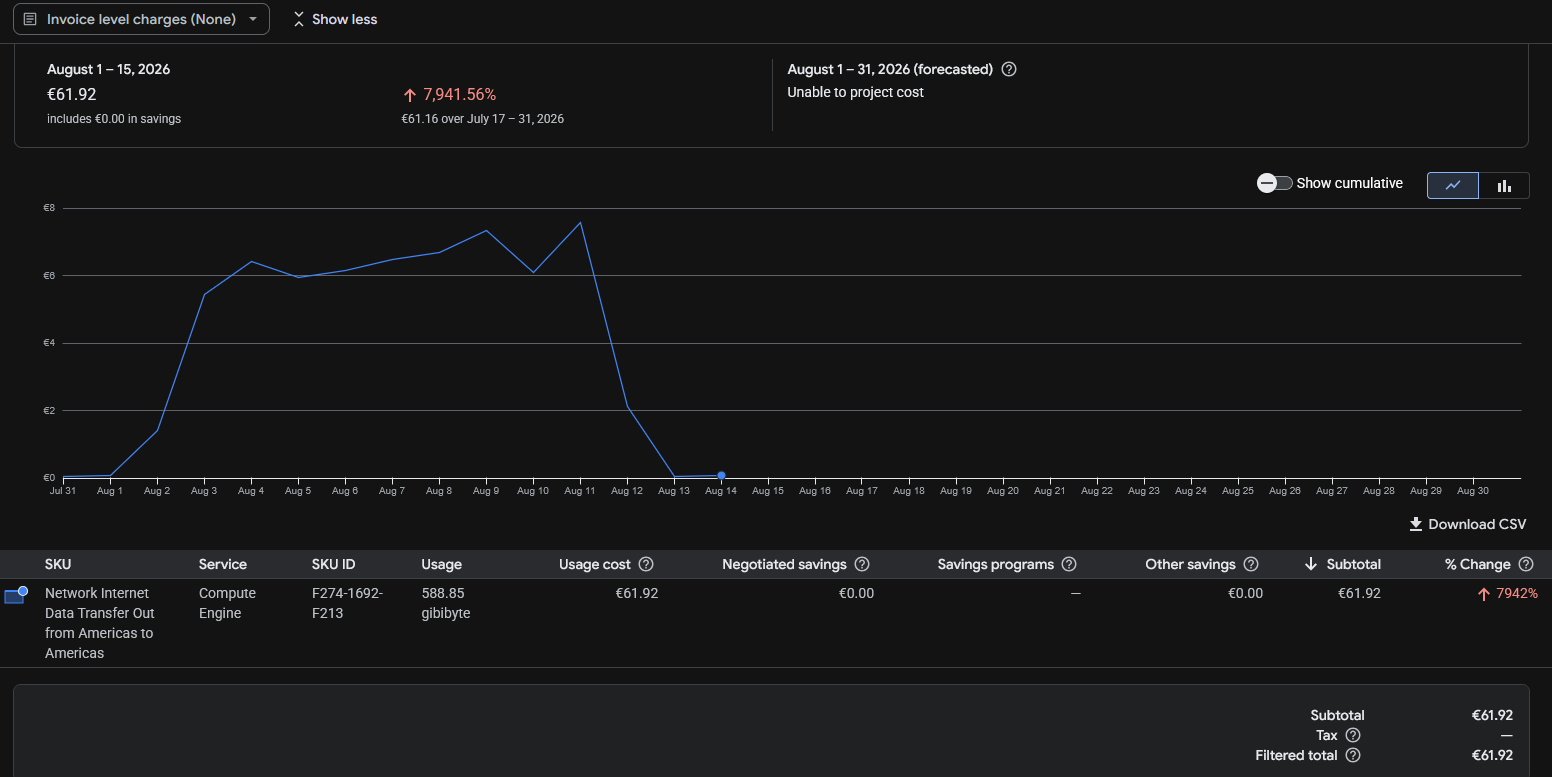
Running the reports I saw “SKU Network Internet Data Transfer Out from Americas to Americas” which was confusing, and initially made me think if it could be the new backups system, sending the backups to my centralised server using the AI compatible agent with the public IP for the API and encryption, but I discarded this very quickly due to the volume of data and I modified the system to use internal IPs instead of the public ones.
The only clear thing at this point was that Internet data transfer (egress) was being sent, and Google makes you pay for that.
I had released several projects recently, like https://read.carlesmateo.com/en Text-to-speech to generate MP3 from text files, or https://sendmeafile.carlesmateo.com/en to send and receive huge files, with resume, checksum verification, AI compatible… So my first thought was that one of the projects or its dependencies could have been compromised, or fanatic AI/crawlers were downloading the sample MP3 files again and again.
I made a mistake when checking Cloud Billing. It indicated that the expenses came from us-central1, so checked the list of instances’ regions and I thought the problem came from a new instance named “ubuntu26-04”.
But I made a mistake, because there are several zones in every region, like us-central1-a, us-central1-b, us-central1-c… My new instance for the new projects was in the zone us-central1-f but I had more than that one instance in the region, only that in different zones. But when I checked the zones for the instances I did not realise that there was more than one instance in the zone us-central1 and I assumed the new instance was the only one in the zone and should be the one generating the egress traffic.
I only had ports 80 and 443 opened in Google’s firewall, so there could be requests to the web server, or that the server got hacked. I analysed the nginx logs for the server and found no huge traffic or big files being requested.
Nowadays bots and crawlers and AI’s generate a crazy amount of traffic, so I had to discard this.
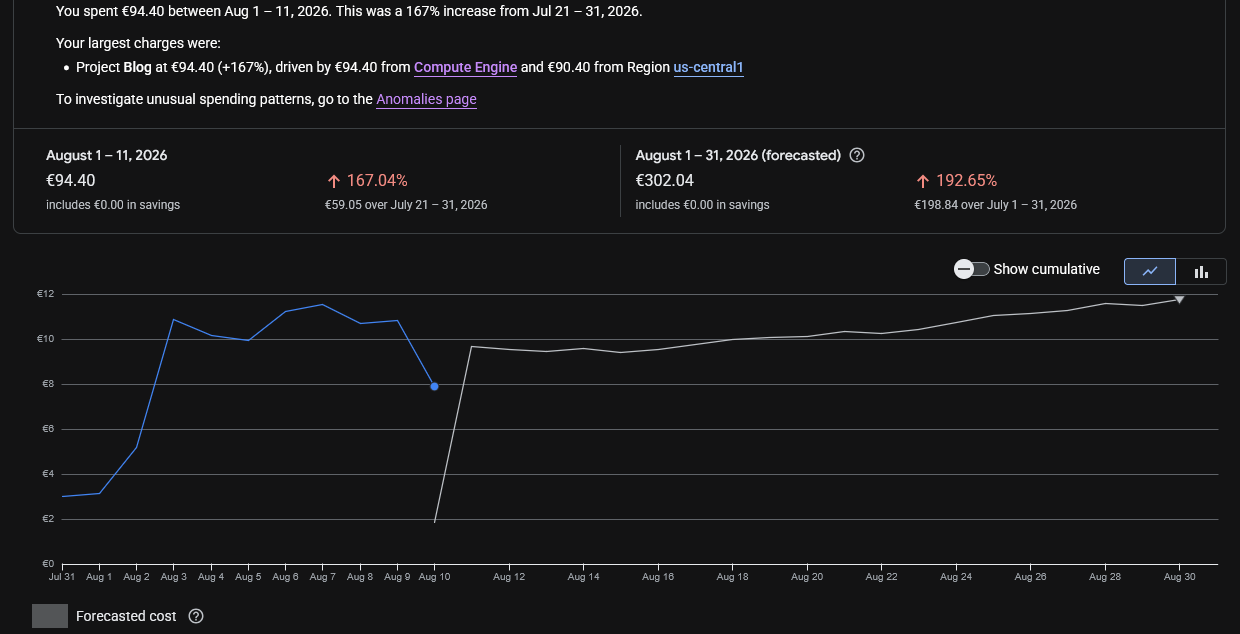
The Billing Dashboard showed that the increment in data sent was costing me around 11€ per day, so it allowed me to start moving services from that server, with relative calm. The forecast for all the August month displayed that the bill would cost me 300€, which was not nice.
In the meantime I hired a VPS with unlimited data and started to migrate the Docker services there as fast as I could with the idea of shutting down the compromise instance to cut the costs.
One of the things that really made me angry, while I was migrating to avoid those over costs, is that I checked again, the next day, the Cloud Billing Reports, the web loaded and informed me that it had changed with news and showed some floating popups pointing how it work and some improvements pushed by the Google Dev Team, and when I continued, the Cloud Billing Report was displaying an unexpected amount of money to pay in August 2026, more than 10 times what I expected, instead of the forecast I saw previously. So it looked like I had to pay that amount for August, and I started to look at what caused that increment of costs quickly, which fas frustrating. And after a while, when I was thinking about stopping the services, I found that Google had changed the page of the reports and the filters were reset to yearly, and the page was showing the already paid costs from 1st August 2025 to 31th August 2026.
Later I reported how frustrating was the experience to Google as “you should not do that” and “users dislike frequent changes”.
Companies are not aware that when they change things, they often annoy the customers a lot.
Years ago I migrated from my long term account with Amazon AWS to Google Cloud Compute Engine cause I was feed up of the problems in Amazon, how many programming errors they had, the changes they did, causing problems, like to the identifiers of the objects (I had older created objects, with shorter hash, and some API calls did not work any more), and how difficult they made simple things. User Interface was bad, and they also lost two of my instances and communicated really poorly (I also reported that to a friend in Amazon and I had some conversations with Amazon’s AWS PMs), and they were over expensive for developers, so I ended migrating to Google Cloud. And now Google is repeating some of the same mistakes.
They are not only expensive. They make things that could be easy, difficult, for the developers.
These big companies force you to stay continuously learning they changes. They offer great solutions for the Enterprise, but for developers and Startups the costs could be overkill.
Probably they are over-kill and over-expensive for developers and Startups.
With Google Cloud I have experienced some technical issues too, as my older instance froze several times and became irresponsive and I had to do a stop from the web console and I had to wait until the command timed out and Google realised there was a problem so it would consider the instance finally shutdown and I could start it again in other non faulty hardware.
If you are a company with a Load Balancer, with health checks, and several front servers, and 20 developers, you can afford to have Web servers KO, as the Load Balancer will handle it nicely, but if you have a single server with WordPress sites, if the instance stops it means that nobody can access those sites.
As an example of costs, for a Google e2-medium (2 vCPUs, 4 GB of Memory and 20 GB of disk) in us-central1 I pay around 30 € per month. And it happens that the forecast for this month in bandwidth was 300 €.
Also storage is around 1€/month per 10GB for standard. So 200GB of regular space is 20 €/month.
For SSD 1.7€/month per 10GB, even tough provides more IOPS, but not more speed. 200GB of space more is 34 € more per month.
I migrated to a provider were I pay 30 € per month for a 8 vCPU and 24 GB of memory and includes 200 GB of NVMe, and I have unlimited bandwidth. Extra storage is also much more cheap. And the static IP is included (for Google you pay around 1.1€ per month).
The key in here was the unlimited bandwidth.
I also could have rented a dedicated server with 64GB of RAM for around 64 €/month, but these comes with some down sides, like if your server experiences a hardware error, you’ll have to wait for the System Administrators from the Cloud Provider to physically replace the components. With a VPS or instance, I can just launch it in a healthy hardware immediately.
As I was migrating services and investigating the origin of the problems, I saw that 500 GB of data were transferred from us-central1 since the 1st of August.
The Billing Report didn’t allow me to filter for IP. It only helped to know the region, us-central1, which helped me to identify the possible services that could be having the problems.
To be honest, I should have located the origin of the problem quickly, but I did so well blocking bots and uneducated crawlers in the past years, that I had no problems for years, and GCE has mad many changes over time, so I did not remember that I could monitor real time network usage of my servers. Most of the servers I troubleshoot I have only SSH access, so I use network tools.
But as I told previously, I mistakenly thought that just one instance was running in us-central1, and that was not the case. They were in different zones of us-central1.
The live traffic inspection in the server with tools like ss, netstat, nethogs, iftop, iotop and ps revealed normal traffic and load.
A second revision from the nginx logs didn’t reveal any problem over time. And the only opened ports were 80 and 443. With the services I considered potentially more vulnerable (as they used python dependencies) migrated to the new VPS and stopped in the “ubuntu26-04” Google server, the usage shown and the forecast for bandwidth was not reduced and it was the same.
One thing I learned, and I suspected it from my tests with https://sendmeafile.carlesmateo.com/en is that the maximum speed that my instances were able to transfer from Google to Internet (egress) was around 50 Mbps per connection.
I didn’t see this in Google Cloud’s documentation, but in my tests transferring data from Google servers using the public interface and from different locations to this google server I consistently achieved always that top speed of around 50 Mbps per connection (around 6.25 MB/s), but when I communicated Google servers using their private interfaces, the speed for a single connection was much more higher. So I assumed that the bandwidth was capped. After seeing the data transferred in the Billing Cloud Report, it looks clear to me that an important part of the server’s bandwidth max was being used. Later, Apache logs, confirmed me many requests at the same exact second.
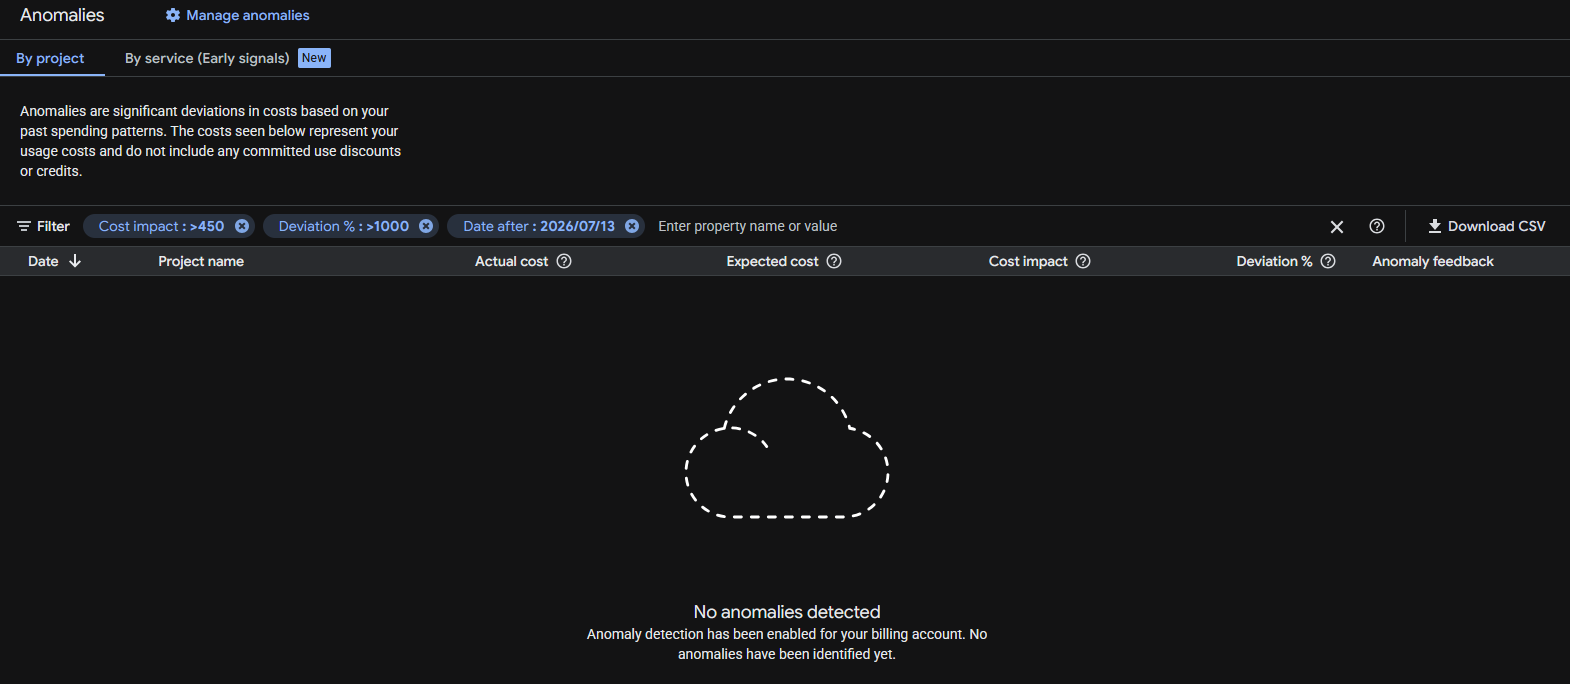
Google anomalies tool detected nothing despite the huge increment in data transfer and cost variation (8,960% respect July!).
Before taking the decision to migrating to another server one has to think, not only in costs, but also on how trustworthy are the storage systems, the resiliency of the systems, how many times they are down per year… there are surprises that you discover as you go. With the experience.
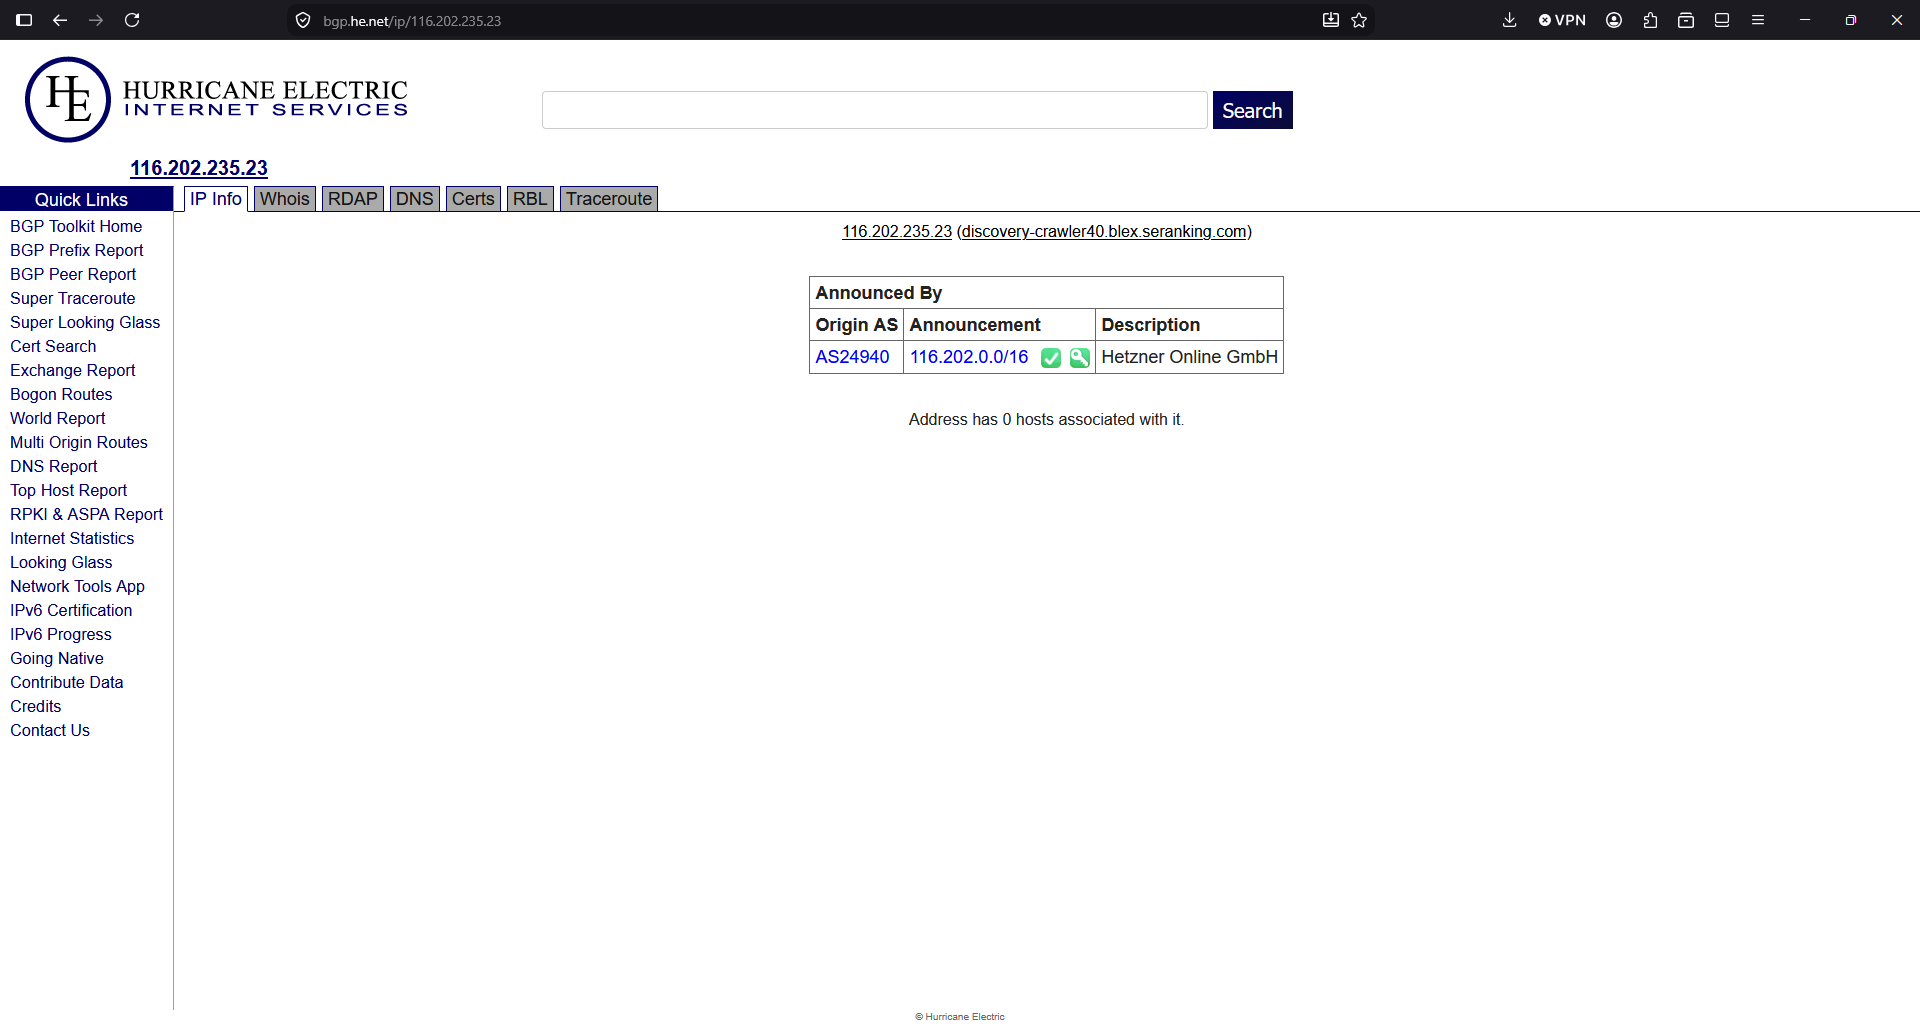
But honestly, I felt it was not worth the price to continue with Google Cloud and it was conditioning the kind of projects I could start. My architecture is resilient, based in containers and I can deploy it fast. I also have backups.
Google storage is not that super trustable in my opinion (neither Amazon’s). Some times my VMs froze and Google monitor dashboard stops drawing the lines of metrics (like CPU usage), but Google doesn’t catch that the VM is frozen. My guess is that the problem is the storage or compute servers dying.
Having to pay per GB transferred in a time where bots and AI index your sites continuously, and abuse the servers by launching many requests concurrently, generating load, and where bots consume much more data than humans, force you to take architecture decisions and to implement strategies.
Possible solutions like using CDN’s like Cloudflare to be protected against DoS, to cache statics and to cut bandwidth and CPU abuse (requests to origin), using other cache systems or migrating to other Cloud providers that are more developer and Start up friendly, and that have unlimited data transfer, etcetera.
When I was presented with the new Google Billing Reports page and the filter was reset to one year, and I saw the price that should be showing multiplied by 10, I contacted Google Cloud by X. They kindly replied and invited me to contact them privately. I did and we opened a ticket. Around three hours later I got an email from a Google staff, telling me that they will investigate the problem, and giving me an expected response deadline of 5 days.
It was nice, but by the time I received the email I already had found and sorted the problem.
I troubleshoot the instance “ubuntu26-04” but the CPU usage was low, and no permanent connections (a sign that could have indicated that was hacked):
That Looked normal
sudo ss -tunp state established
Then I did something that I should have done before, I checked the metrics from all the different instances in Google Cloud Compute, starting from the one I initially guessed was the one suffering the problems. That machine was clear. No high CPU usage. No high bandwidth usage. Nothing.
And then I saw it.
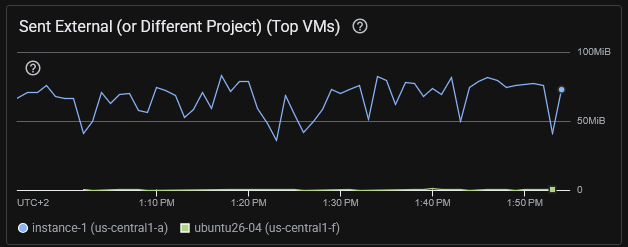
Through VM Instances I narrowed to the one in us-central1 that was consuming the Internet bandwidth, “instance-1”:
I was checking the wrong server. The consuming excess of egress was from instance-1 that hosted several WordPress sites and it was using Apache2, not nginx.
Some commands I ran:
# Check for the data sent by Apache. This found a lot of traffic. Note: the access.log of all the sites were being analysed
sudo awk '{s+=$10} END {print s/1024/1024/1024 " GB"}' /var/log/apache2/*access.log
# returned 36.4578 GB that's for a day, so something was clearly wrong

# Analyze requests: See what is more heavy. So basically bots trying to hack into the server and some heavy images. Note root home for at least a server is huge (50MB)
sudo awk '{a[$7]+=$10} END {for(u in a) print a[u]/1024/1024" MB\t"u}' /var/log/apache2/*access.log | sort -rn | head -20
54.3218 MB      /
21.6173 MB      /wp-login.php
17.1676 MB      /wp-content/uploads/2022/10/20221001_200930-cut.png
16.5822 MB      /wp-content/uploads/2022/10/20221001_201033.png
10.7245 MB      /wp-content/uploads/2022/02/python_loop.gif
6.61174 MB      /xmlrpc.php
6.60595 MB      /page/2/?shopdetail%2FI37266592159
6.60595 MB      /page/2/?shopdetail%2FI37256267952
6.60595 MB      /page/2/?shopdetail%2FI37256137878
6.60595 MB      /page/2/?shopdetail%2FI37256033568
6.60595 MB      /page/2/?shopdetail%2FI37224959793
6.60595 MB      /page/2/?shopdetail%2FI37214305672
6.60595 MB      /page/2/?shopdetail%2FI37203620584
6.60595 MB      /page/2/?shopdetail%2FE37266925367
6.60595 MB      /page/2/?shopdetail%2FE37242498260
6.60595 MB      /page/2/?shopdetail%2FE37207321261
6.60595 MB      /page/2/?shopdetail%2FA37259909717
6.60595 MB      /page/2/?shopdetail%2FA37259600135
6.60595 MB      /page/2/?shopdetail%2FA37256306882
6.60595 MB      /page/2/?shopdetail%2FA37256197883

# Analyze requests: See what IP's are requesting more traffic in total. Gotcha
sudo awk '{a[$1]+=$10} END {for(i in a) print a[i]/1024/1024" MB\t"i}' /var/log/apache2/*access.log | sort -rn | head -20
34549.2 MB      74.7.241.60
1491.36 MB      116.202.235.23
287.651 MB      3.41.188.33
232.362 MB      74.7.227.160
199.987 MB      18.97.9.169
183.748 MB      66.249.74.42
84.1681 MB      114.119.140.64
78.3209 MB      114.119.149.169
70.5166 MB      114.119.156.46
67.8224 MB      114.119.150.29
66.7544 MB      114.119.145.237
58.7278 MB      114.119.147.113
57.1822 MB      114.119.162.62
56.0061 MB      66.249.74.43
55.3612 MB      114.119.141.79
21.9245 MB      216.73.217.35
21.2516 MB      104.243.44.93
17.7313 MB      79.116.217.181
17.1676 MB      189.81.71.184
16.5822 MB      205.188.63.181
So we see that this IP 74.7.241.60 is requesting 34.5 GB in a day.
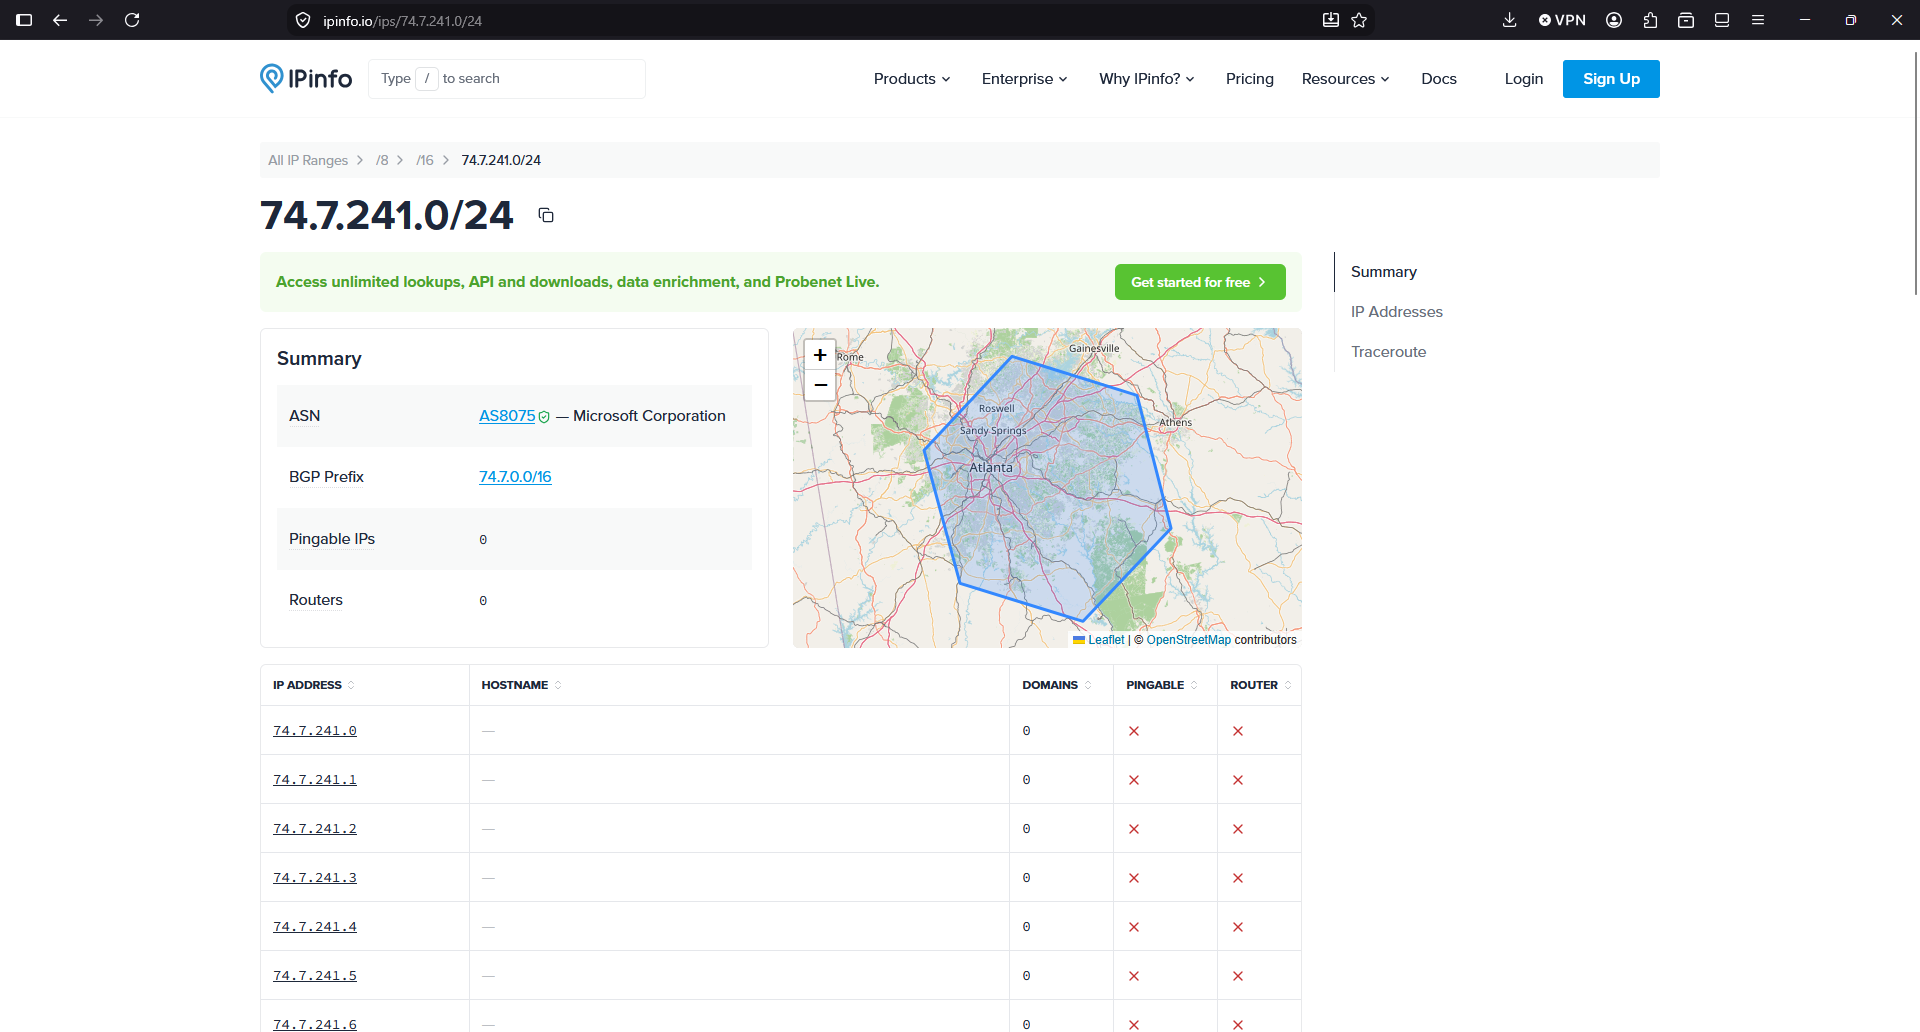
So, according to this IP Info service, the IP is from Microsoft. So apparently, crawlers/IA from Microsoft or running in Microsoft infrastructure, were costing me money because they are abusing, scanning my sites, with many connections concurrently, like horrible soulless machines:
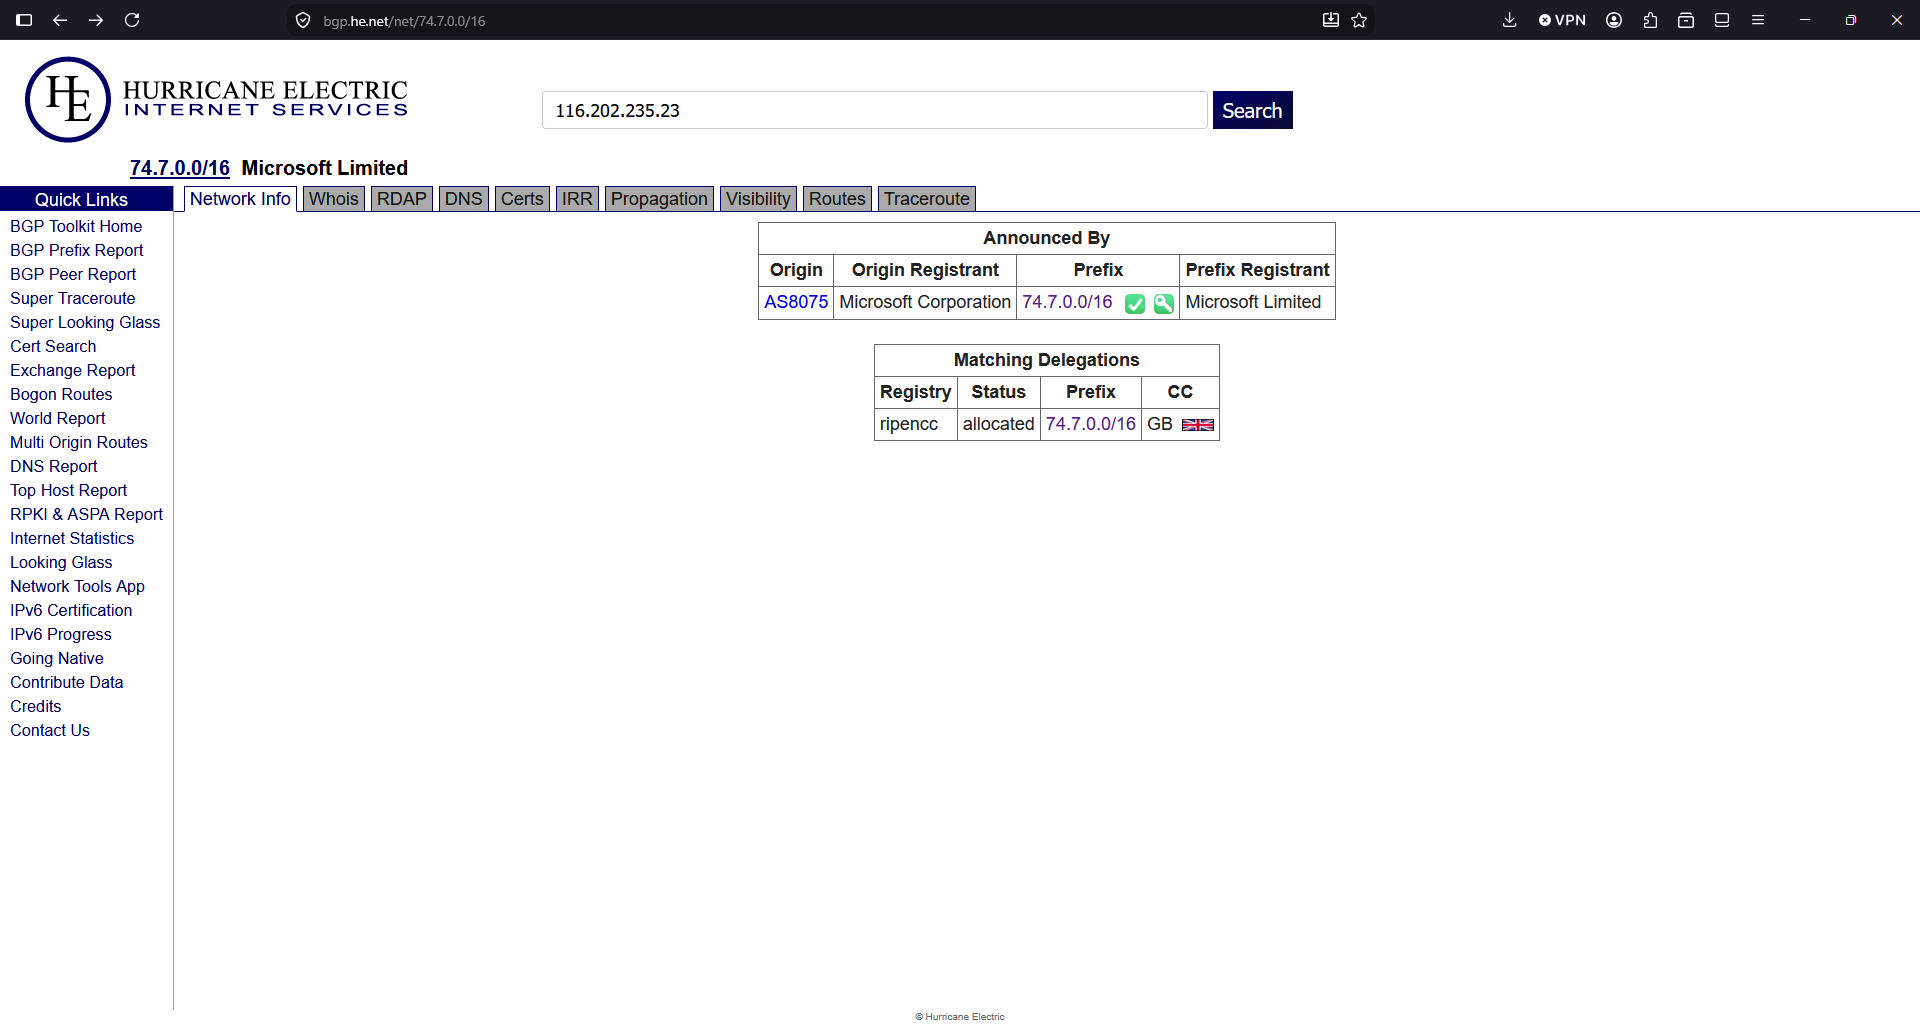
I double checked the IP with another provider:
A command to see a sample of what kind of requests I have from this IP, brings more light:
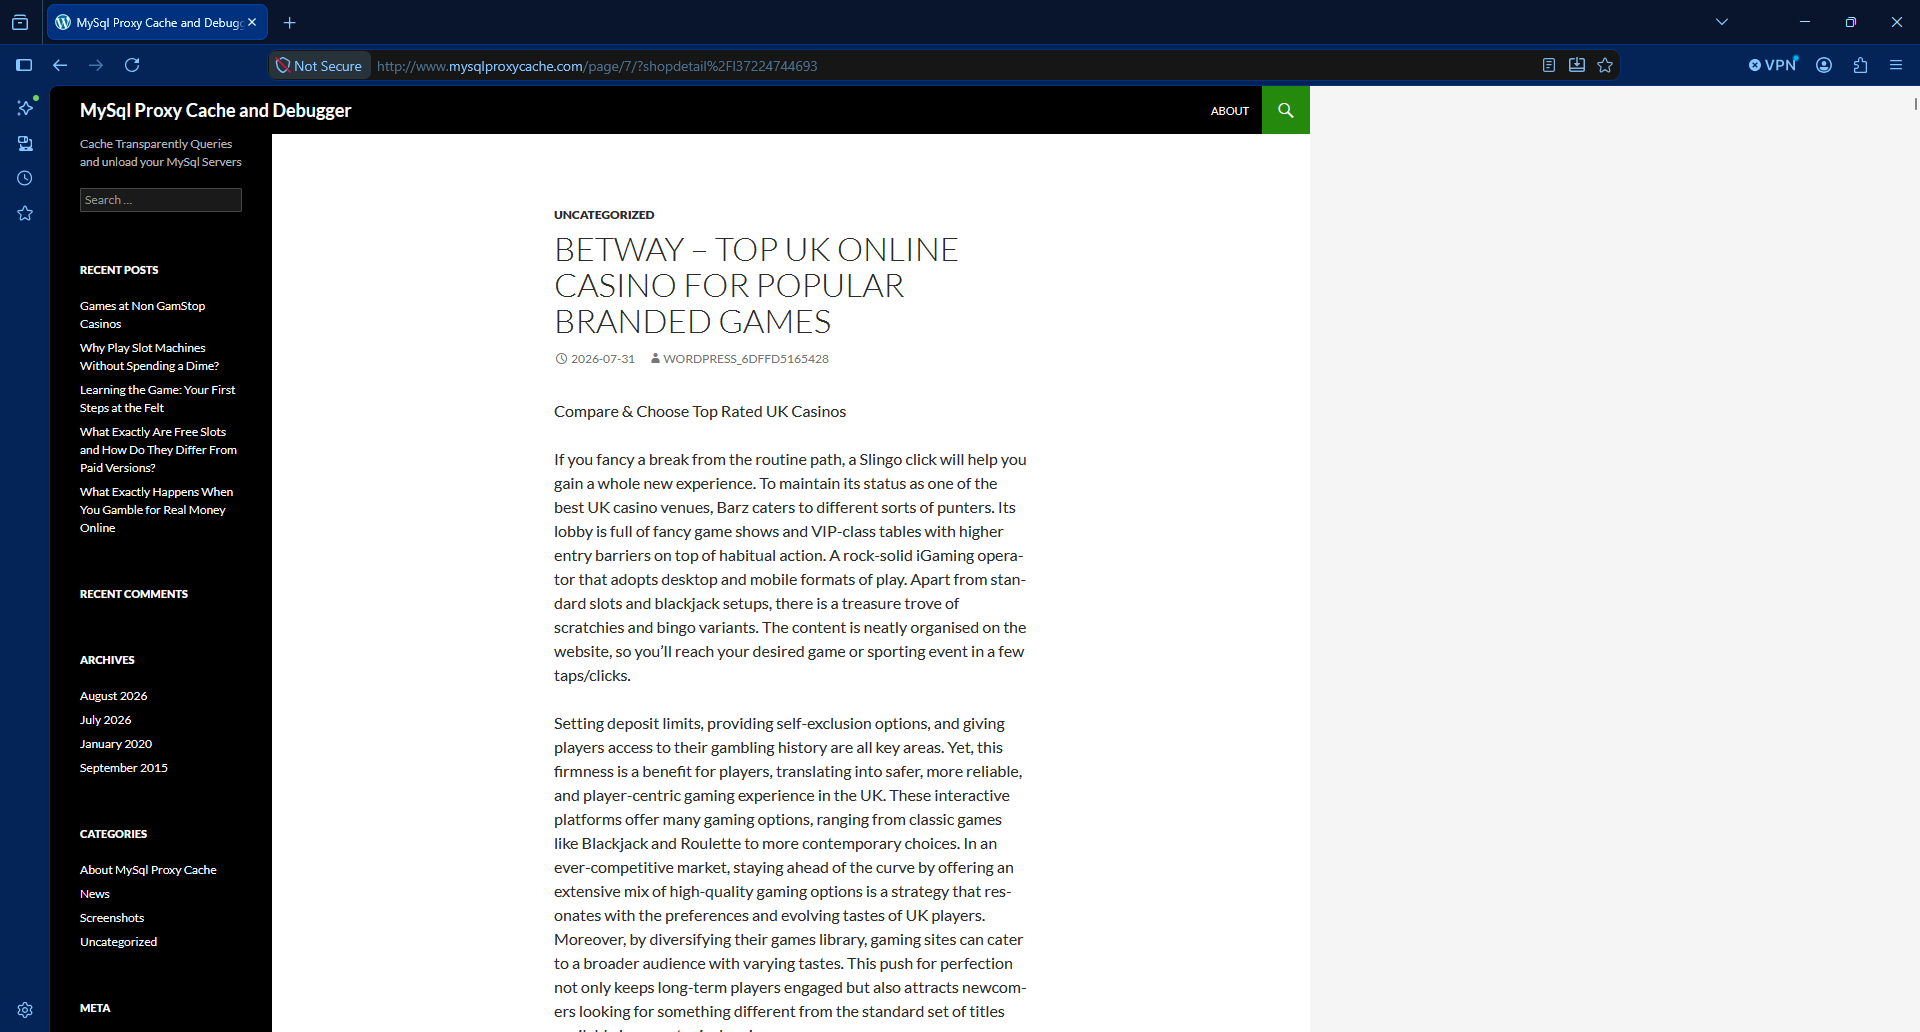
According to the User-Agent is GPTBot. So apparently a bot running in Microsoft self-identifying as OpenAI were killing causing high usage to my server and to my budget by requesting many pages at the same time, for an old shopdetail page that does not exist in that server (maybe there was a shop years before I got that IP), and spends a lot of bandwidth responding with a heavy page of 6 MB.
In the logs I saw many request at the same precise second.
Asking to Claude it tells me that the range of IPs of the Microsoft attacker IP are not in the publicly published IPs of OpenAI for GPTBot, so apparently somebody using Microsoft IPs is pretending to be a GPT Bot, and it isn’t:
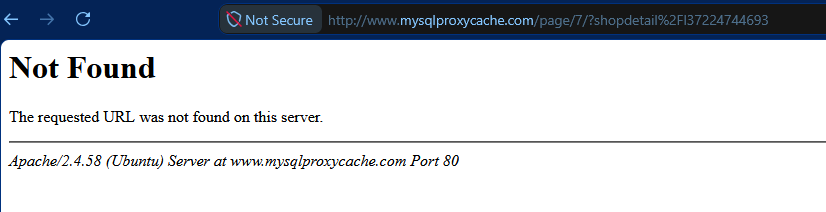
The domain is an old WordPress that has been hacked. Yes, this happens more often that we would like, with WordPress.
I checked the https and it returns a SSL potential warning in the SSL.
So, to summarise, there was a bot from a Microsoft IP, that was requesting many times per second pages to a WordPress site that was compromised and it was returning a large article with many photos, so heavy in terms of data usage.
With Apache2 server stopped, I moved the config symbolic link from /etc/apache2/sites-enabled/ to another folder /etc/apache2/sites-disabled/ that I created.
So basically, when I started Apache, the compromised site will not be served. It will be served by the default site.
I restarted the Apache server and checked that the URLs for that domain were catch by default site and no processing resources of bandwidth was used.
That was to avoid a main site marked as default in the Apache config to attend those requests and waste data.
And then I added to the firewall, to Google Cloud’s Firewall and to the servers in all my instances, to block all the IPs from Microsoft from that range.
I saw that the BGP Prefix is 74.7.0.0/16 so I block all the 65,536 IP Addresses:
ufw insert 1 deny from 74.7.0.0/16 to any
As you can see I inserted this rule on the first position. Don’t just add it with ufw deny from 74.7.0.0/16 to any or otherwise it will go to the last position, after the allow rules. And then it would not be enforced.
Check your rules with:
ufw status numbered
You can block the range in your provider’s Firewall (VPC Firewall in Google Cloud).
If you didn’t have the Ubuntu Firewall active, and want to activate it now, make sure that you have the rules for the SSH connection:
I recommend you to add the rules to a script in git (Infrastructure as Code), so you can replay it another day, and to any server you have.
By default, ufw sets deny by default for rules not specified. You can check it with:
sudo ufw status verbose | head
Bots, IA, crawlers abuse our servers nowadays.
Also the automated bots attempting to hack into the servers.
If you just check your logs, you’ll see many attempts to exploit vulnerabilities in your servers, every day.
I checked for the second IP consuming more bandwidth in the list:
116.202.235.23
It’s from hetzner, a Cloud provider. https://bgp.he.net/net/74.7.0.0/16
Another 65,536 addresses that get blocked:
# Hetzner
ufw insert 1 deny from 116.202.0.0/16  to any
The third IP will be blocked too, even if I didn’t find any information about who owns the block of IPs.
ufw insert 1 deny from 3.41.188.33 to any
The fourth was part of the same block I blocked first, so it’s already blocked.
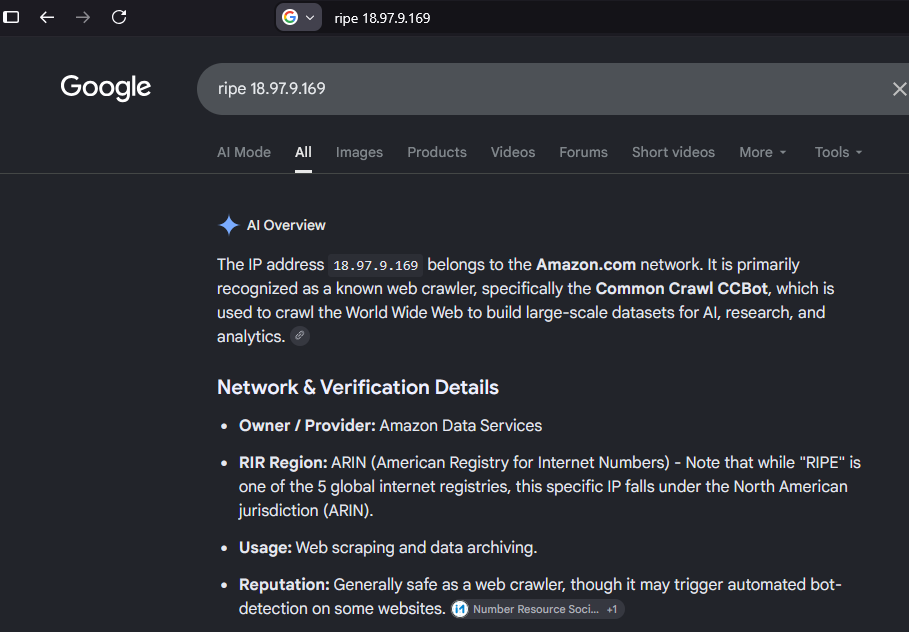
The fifth IP, I ask to Google Gemini:
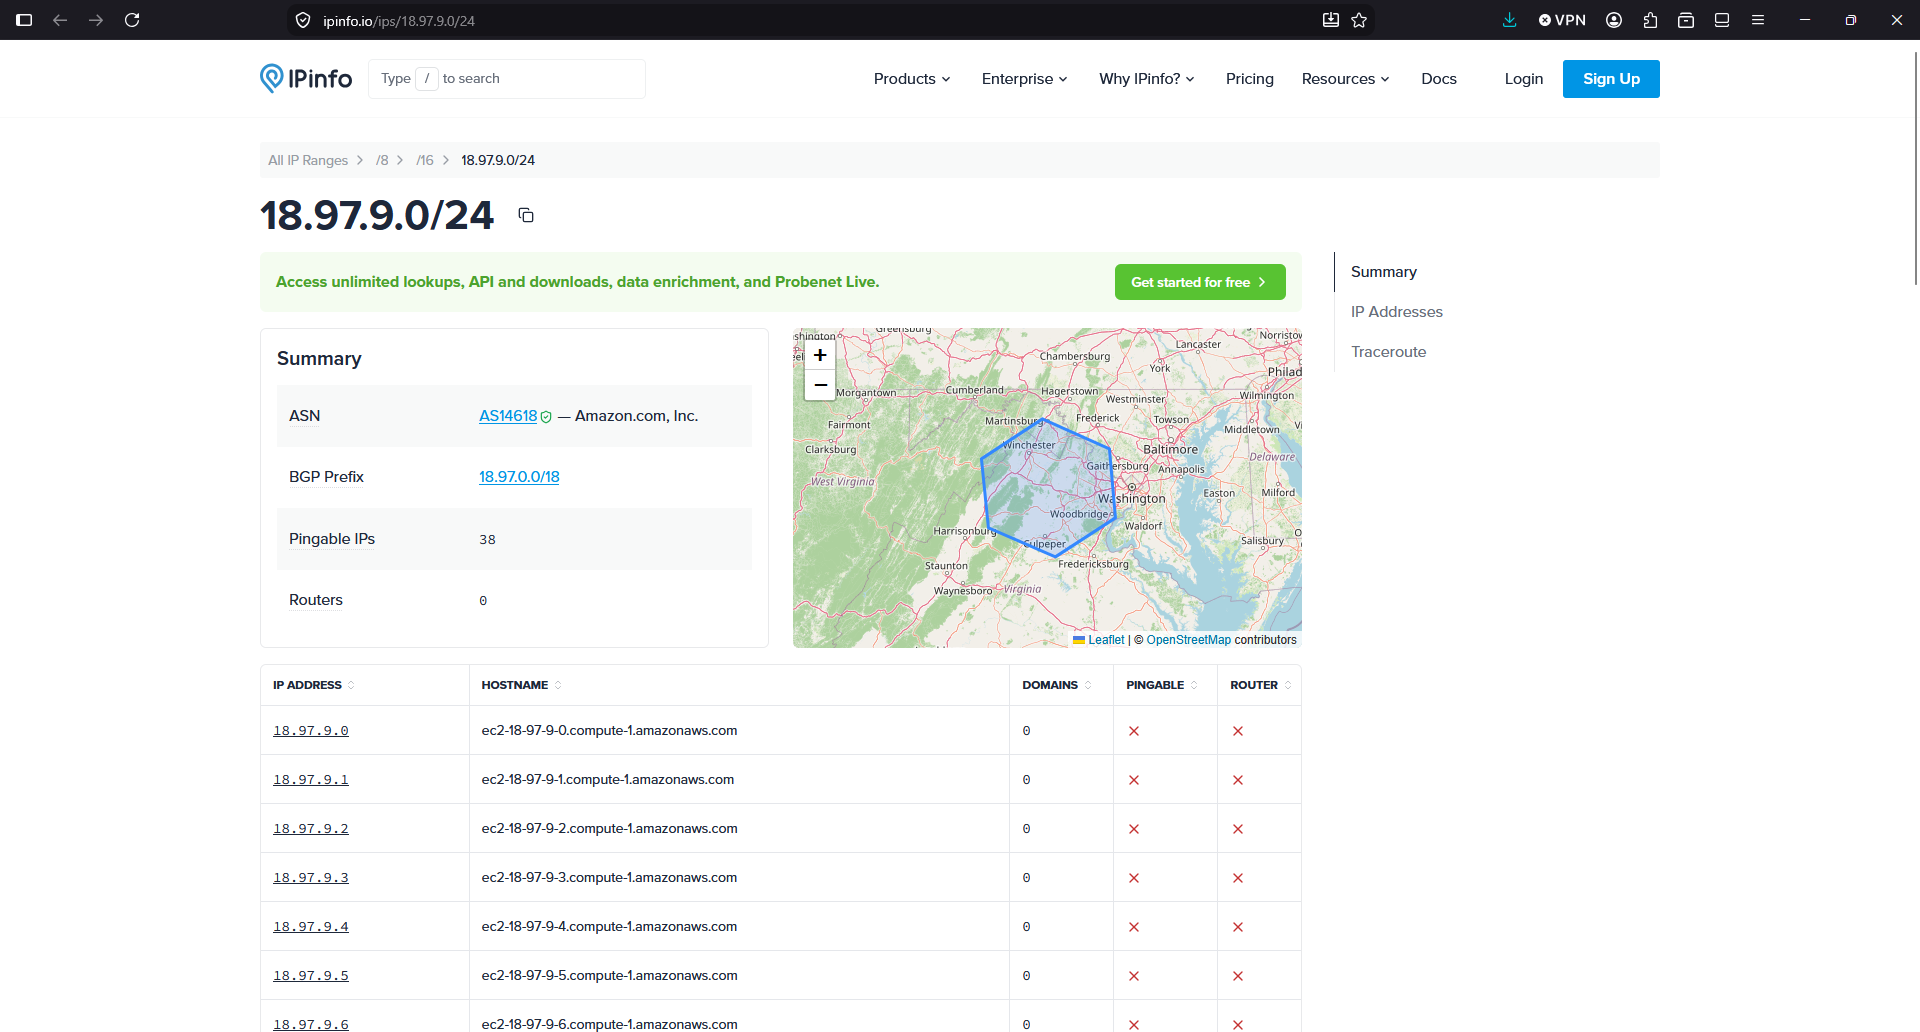
The block is 18.97.9.0/24 but I’ll block all the BGP Prefix, all the 16K addresses.
ufw insert 1 deny from 18.97.0.0/18 to any
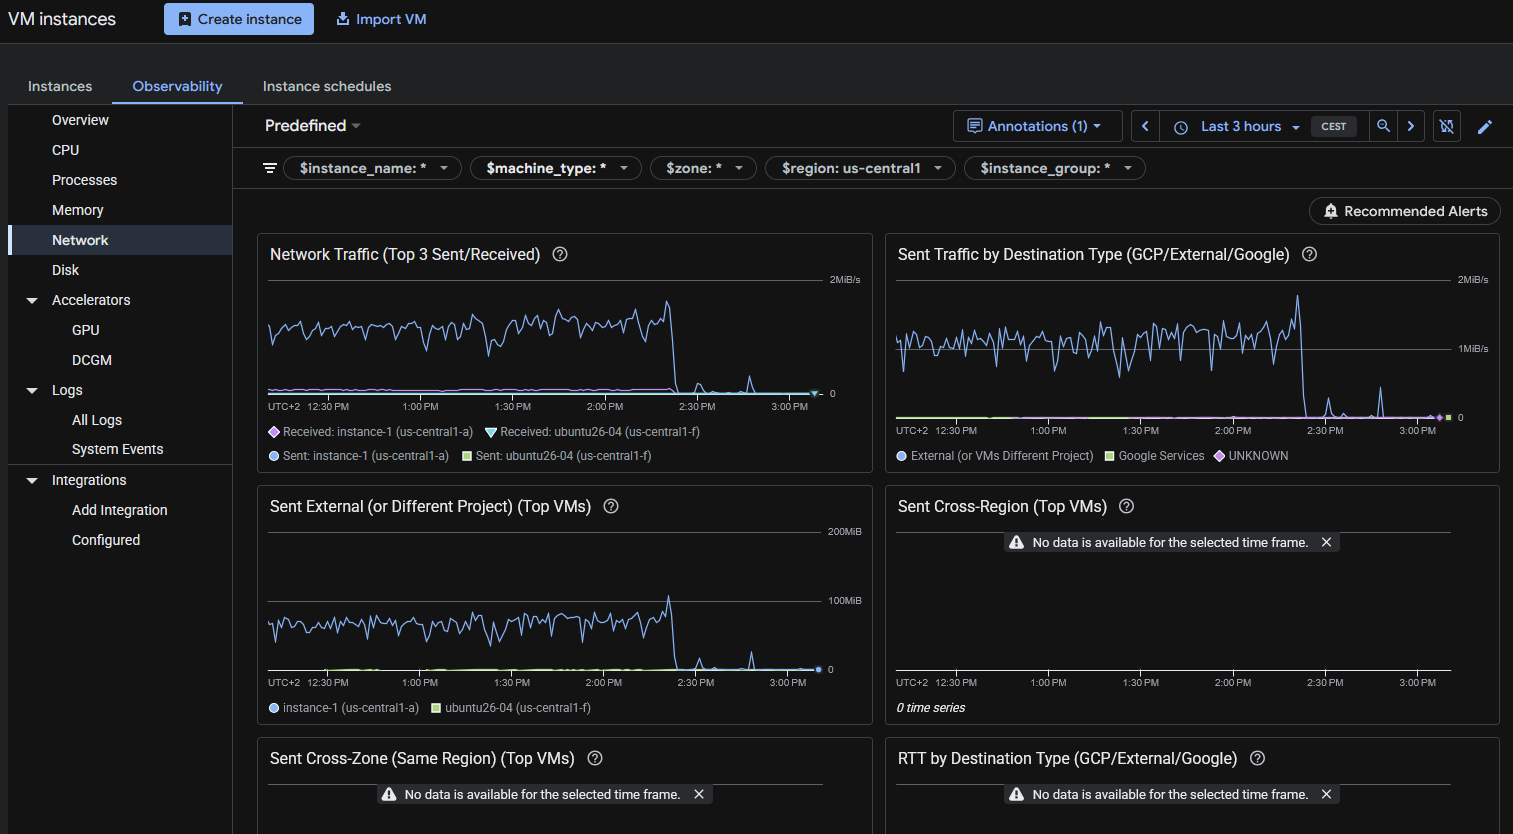
See what is the traffic from the servers since I blocked the Microsoft range in the Ubuntu Firewall:
As you can see, after I blocked the first abusive IP allegedly from Microsoft with seemingly OpenAI User-Agent falsified, all the egress traffic went down.
I like how Google reacted when I contacted them. And I should have checked the Network traffic bandwidth first. So I decided to keep the WordPress instance in Google Cloud.
But the new instance “ubuntu26-04” I’m migrating it to the new server. What they offer for the price is much better, and the price of the storage really it’s important for some of my projects. The unlimited bandwidth usage in the new provider it’s also key.
The Billing report from Google Cloud doesn’t show the data up to the moment. But the 16th of August I was able to see that from the 12th and absolutely on 13th and 14th the egress Internet cost have almost disappeared.
Not all is perfect. I had to learn the web interface from that provider (I used it in the past, but companies change the user interface very often nowadays, causing headaches to users), the place were my VPS was listed was hidden and difficult to find, and by default the VPS had no firewall enabled. Something that I believe that is basic to have enabled by default.
But I think it will be great for my projects and for my budget, to have all those new resources available (8 vCPU and 24 GB of RAM and 200 GB of NVMe disk for the same cost provided in Google Cloud of 2 vCPU and 4 GB of RAM and 20 GB of standard disk).
In fact, the speed I have detected transferring from/to sendmeafile with the new provider shows a great improvement.
Take one thing in mind: They AI is hungry for contents, and the mega-rich AI providers are making you pay the bill, by scanning your sites non-stop.
The new provider says it provides 3 Gbps of bandwidth for the instance, with no data usage limits (not having to pay for GB transferred). If I had not reacted fast, the forecast for this month with Google for just a single instance was 300€. It is a risk for developers and small companies, to have the possibility to face a huge bill because more frequent every day bots/crawlers/AIs and processes attempting to breach in your servers, cause your server to use a lot of egress data. So it is worth considering using a Cloud Provider with unlimited data plan. Or at least, activate the Billing Alerts to be notified if your costs exceed a certain threshold.
If you have problems with abusive bots degrading your Drupal or WordPress performance, I created a commercial WordPress plugin and a commercial Drupal module that automatically and easily record and block offending IP Addresses.
I completed my ZFS on Ubuntu 20.04 LTS book. I had an error in an actual hard drive so I added a Troubleshooting section explaining how I fixed it.
I paused for a while the advance of my book Python: basic exercises for beginners, as my colleague Michela is translating it to Italian. She is a great Engineer and I cannot be more happy of having her help.
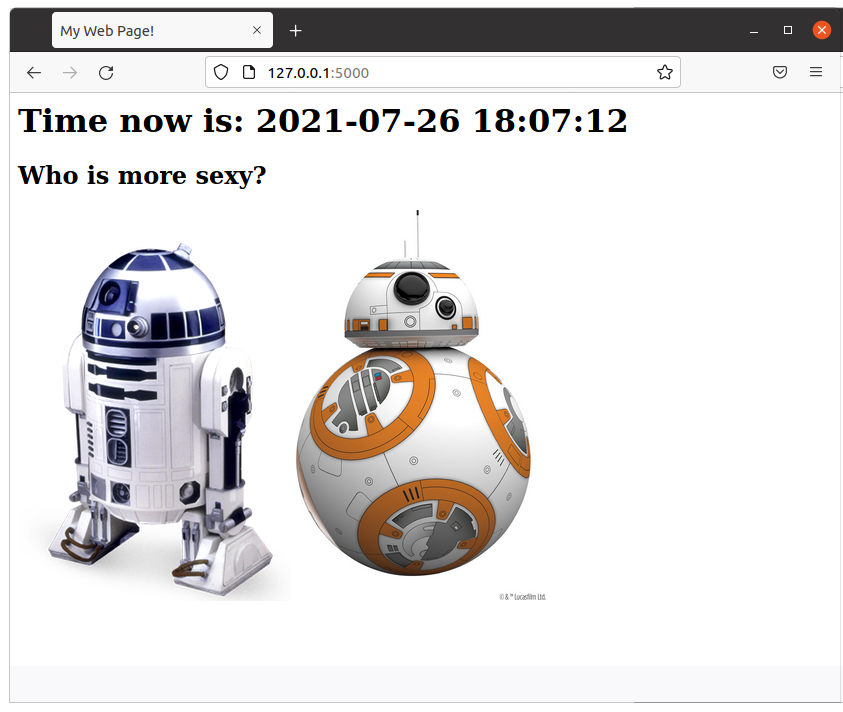
I added a new article about how to create a simple web Star Wars game using Flask. As always, I use Docker and a Dockerfile to automate the deployment, so you can test it without messing with your local system. The code is very simple and easy to understand.
This way I set an entry in /etc/hosts and I can do all the tests I want.
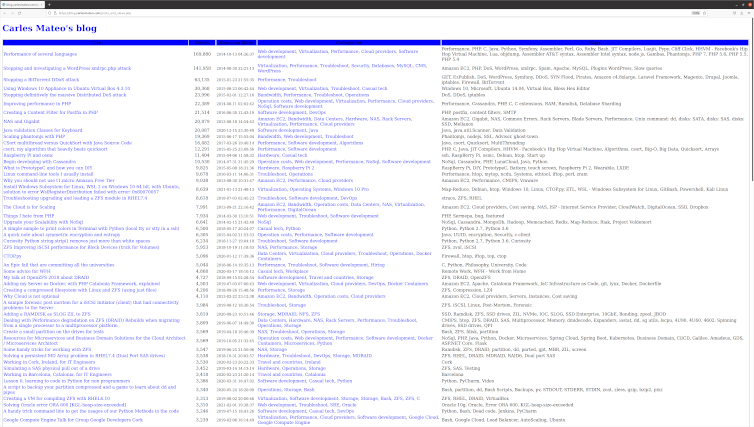
I added a new section to the blog, is a link where you can see all the articles published, ordered by number of views. /posts_and_views.php
Is in the main page, just after the recommended articles. Here you can see the source code.
I removed the Categories:
Storage
ZFS
In favor of:
Hardware
Storage
ZFS
So the articles with Categories in the group deleted were reassigned the Categories in the second group.
Visually:
I removed some annoying lines from the Quick Selection access. They came from inherited CSS properties from my WordPress, long time customized, and I created new styles for this section.
I adjusted the line-height to avoid separation between lines being too much.
I added a link in the section of Other Engineering Blogs that I like, to the great https://github.com/lesterchan site, author of many super cool WordPress plugins.
As you can see I use wp-config.php file to get the Database Settings (username, password, database) but I don’t use the WordPress Engine, it is just a stand alone PHP. So I wrote my own function to get the slug based on the category name. I believe the slug for it is in the Database and I could have added this as a SubQuery with JOINs, which would be better, but I wanted to keep the Database workload lightweight and especially, I did not want to invest more time investigating how the get the slug.
As I tested my function I didn’t find any Category failing but I saw that I had the Category Storage repeated in two different structure tree in Categories, and I will only always link to just the first one (So I was not linkin to the slug storage-2). I fixed that Category that I found repeated but to be honest if this script was a commercial solution or an Open Source solution properly maintained rather than just a sample, I would update it to have Categories and Tags’ slugs coming from the Database.
I would probably make it work with a Cron that would generate a cached page, updated every hour or every ten minutes. I did this in other projects I worked or in my PHP Framework Catalonia Framerwork.
But honestly, the load of the page does not justify a major effort in optimizing here, in this case.
<!DOCTYPE html>
<html>
<head>
    <style>
        .first {

            background-color: blue;
            padding: 12px;
        }
        .second {
            background-color: rgba(254, 253, 252, 0.7);
            text-align: center;
            padding:20px 0;
            font-size: 20px;
        }

        .centered {
            text-align: center;
        }

        /* unvisited link */
        a:link {
            color: blue;
            text-decoration: none;
        }

        /* visited link */
        a:visited {
            color: blue;
            text-decoration: none;
        }

        /* mouse over link */
        a:hover {
            color: #00A8EF;
            text-decoration: underline;
        }

        /* selected link */
        a:active {
            color: blue;
        }
    </style>
<body>
<?php

include "wp-config.php";

$s_site_name = "Carles Mateo's blog";
$s_site_link = "https://blog.carlesmateo.com";

function get_category_slug($s_text) {
    $s_output_text = strtolower($s_text);
    $s_output_text = str_replace(" ", "-", $s_output_text);

    return $s_output_text;
}

?>
<h1><a href="<?php print $s_site_link; ?>"><?php print($s_site_name); ?></a></h1>
<?php


$s_sort = "views DESC, post_date, post_title DESC";

if (array_key_exists("sort", $_GET)) {
    if ($_GET["sort"] == "date") {
        $s_sort = "post_date, views, post_title";
    }
}

$s_servername = "localhost";
$s_database = DB_NAME;
$s_username = DB_USER;
$s_password = DB_PASSWORD;


// Create connection
$o_conn = new mysqli($s_servername, $s_username, $s_password, $s_database);

// Check connection
if ($o_conn->connect_error) {
    die("Connection failed: " . $o_conn->connect_error);
}

/*
mysql> DESCRIBE wp_posts;
+-----------------------+-----------------+------+-----+---------------------+----------------+
| Field                 | Type            | Null | Key | Default             | Extra          |
+-----------------------+-----------------+------+-----+---------------------+----------------+
| ID                    | bigint unsigned | NO   | PRI | NULL                | auto_increment |
| post_author           | bigint unsigned | NO   | MUL | 0                   |                |
| post_date             | datetime        | NO   |     | 0000-00-00 00:00:00 |                |
| post_date_gmt         | datetime        | NO   |     | 0000-00-00 00:00:00 |                |
| post_content          | longtext        | NO   |     | NULL                |                |
| post_title            | text            | NO   |     | NULL                |                |
| post_excerpt          | text            | NO   |     | NULL                |                |
| post_status           | varchar(20)     | NO   |     | publish             |                |
| comment_status        | varchar(20)     | NO   |     | open                |                |
| ping_status           | varchar(20)     | NO   |     | open                |                |
| post_password         | varchar(255)    | NO   |     |                     |                |
| post_name             | varchar(200)    | NO   | MUL |                     |                |
| to_ping               | text            | NO   |     | NULL                |                |
| pinged                | text            | NO   |     | NULL                |                |
| post_modified         | datetime        | NO   |     | 0000-00-00 00:00:00 |                |
| post_modified_gmt     | datetime        | NO   |     | 0000-00-00 00:00:00 |                |
| post_content_filtered | longtext        | NO   |     | NULL                |                |
| post_parent           | bigint unsigned | NO   | MUL | 0                   |                |
| guid                  | varchar(255)    | NO   |     |                     |                |
| menu_order            | int             | NO   |     | 0                   |                |
| post_type             | varchar(20)     | NO   | MUL | post                |                |
| post_mime_type        | varchar(100)    | NO   |     |                     |                |
| comment_count         | bigint          | NO   |     | 0                   |                |
+-----------------------+-----------------+------+-----+---------------------+----------------+
 */

/*
mysql> describe wp_postmeta;
+------------+-----------------+------+-----+---------+----------------+
| Field      | Type            | Null | Key | Default | Extra          |
+------------+-----------------+------+-----+---------+----------------+
| meta_id    | bigint unsigned | NO   | PRI | NULL    | auto_increment |
| post_id    | bigint unsigned | NO   | MUL | 0       |                |
| meta_key   | varchar(255)    | YES  | MUL | NULL    |                |
| meta_value | longtext        | YES  |     | NULL    |                |
+------------+-----------------+------+-----+---------+----------------+
 */

$s_sql = "SELECT DISTINCT post_title, post_content,
                 (SELECT CAST(meta_value AS SIGNED) FROM wp_postmeta WHERE wp_postmeta.meta_key = 'views' AND wp_postmeta.post_id = wp_posts.ID) AS 'views',
                 (SELECT group_concat(wp_terms.name separator ',')
                         FROM wp_terms
                  INNER JOIN wp_term_taxonomy
                          ON wp_terms.term_id = wp_term_taxonomy.term_id
                  INNER JOIN wp_term_relationships wpr
                          ON wpr.term_taxonomy_id = wp_term_taxonomy.term_taxonomy_id
                  WHERE
                         taxonomy= 'category' AND wp_posts.ID = wpr.object_id
                ) AS 'Categories',
                (SELECT group_concat(wp_terms.name separator ', ')
                        FROM wp_terms
                 INNER JOIN wp_term_taxonomy
                         ON wp_terms.term_id = wp_term_taxonomy.term_id
                 INNER JOIN wp_term_relationships wpr
                         ON wpr.term_taxonomy_id = wp_term_taxonomy.term_taxonomy_id
                 WHERE
                        taxonomy= 'post_tag' AND wp_posts.ID = wpr.object_id
                ) AS 'Tags',
               ID, post_name, post_date, post_modified, post_type
          FROM wp_posts
          WHERE
                post_type = 'post' AND post_status = 'publish'
          ORDER BY
                $s_sort";

$o_result = $o_conn->query($s_sql);

if ($o_result->num_rows > 0) {
    ?><table style="border:1px solid">
    <tr class="first"><th>Title</th><th style="min-width:100px">Views</th><th style="min-width:150px">Creation Date</th><th>Categories</th><th>Tags</th></tr>

    <?php
    $i_total_views = 0;
    $i_articles = 0;

    // output data of each row
    while($row = $o_result->fetch_assoc()) {
        $s_style='style="border:1px solid"';
        $s_style='';
        $s_url = $row['post_name'];
        print('<tr>');
        print("<td $s_style>");
        print('<a href="'.$s_url.'" target="_blank">');
        print($row["post_title"]);
        print('</a>');
        print("</td>");
        print('<td class="centered" '.$s_style.'>');
        print(number_format($row["views"]));
        print("</td>");
        print("<td $s_style>");
        print("<small>");
        print($row["post_date"]);
        print("</small>");
        print("</td>");
        print("<td $s_style>");
        $s_categories = $row["Categories"];
        $a_categories = explode (",", $s_categories);
        $s_categories_content = "";
        foreach($a_categories as $s_category) {
            $s_category_slug = "/category/".get_category_slug($s_category)."/";
            $s_categories_content = $s_categories_content .'<a href="'.$s_category_slug.'" target="_blank">';
            $s_categories_content = $s_categories_content .$s_category;
            $s_categories_content = $s_categories_content ."</a>, ";
        }

        if (strlen($s_categories_content) > 0) {
            $s_categories_content = substr($s_categories_content, 0, -2);
        }

        print($s_categories_content);
        print("</td>");
        print("<td $s_style>");
        print($row["Tags"]);
        print("</td>");
        // $row["post_content"];
        $i_total_views = $i_total_views + intval($row["views"]);
        $i_articles++;
        echo "</tr>";
    } ?></table><?php
    print("<strong>Total articles:</strong> ".number_format($i_articles)." <strong>Total Views:</strong> ".number_format($i_total_views));
    print("<br>");
} else {
    echo "<p>0 results</p>";
}
$o_conn->close();

?>
</body>
</html>
One of my colleagues showed me dstat, a very nice tool for system monitoring, and bandwidth of a drive monitoring. Also ifstat, as complement to iftop is very cool for Network too. This functionality is also available in CTOP.py
As I shared in the past news of the blog, I’m resuming my contributions to ZFS Community.
Long time ago I created some ZFS tools that I want to share soon as Open Source.
I equipped myself with the proper Hardware to test on SAS and SATA:
12G Internal PCI-E SAS/SATA HBA RAID Controller Card, Broadcom’s SAS 3008, compatible for SAS 9300-8I. This is just an HDA (Host Data Adapter), it doesn’t support RAID. Only connects up to 8 drives or 1024 through expander, to my computer. It has a bandwidth of 9,600 MB/s which guarantees me that I’ll be able to add 12 SAS SSD Enterprise grade at almost the max speed of the drives. Those drives perform at 900 MB/s so if I’m using all of them at the same time, like if I have a pool of 8 + 3 and I rebuild a broken drive or I just push Data, I would be using 12×900 = 10,800 MB/s. Close. Fair enough.
VANDESAIL Mini-SAS Cables, 1m Internal Mini-SAS to 4x SAS SATA Forward Breakout Cable Hard Drive Data Transfer Cable (SAS Cable).
SilverStone SST-FS212B – Aluminium Trayless Hot Swap Mobile Rack Backplane / Internal Hard Drive Enclosure for 12x 2.5 Inch SAS/SATA HDD or SSD, fit in any 3x 5.25 Inch Drive Bay, with Fan and Lock, black
Terminator is here. I ordered this T-800 head a while ago and finally arrived.
Finally I will have my empty USB keys located and protected. ;)
There are many robots scanning sites for vulnerabilities, to gain control or exploit the servers. Most of them come from China and Russia ip’s.
Here I explain an easy way to block them using the Ubuntu Firewall ufw.
If you use a CMS like WordPress and you know there are extensions that have had security exploits, for example, wp-file-manager then you can search directly for this request in Apache Access Logs.
In the example we look for the access.log file, for the rotated access.log.1 and for the rotated and compressed access.log.2.gz. We use the tool zcat which does a cat over a compressed file.
If we don’t expect to have anybody posting to our xmlrpc Service, we can check for the offending Ip’s by doing:
You can identify manually what are attacks, and what are legit requests.
After you have your definitive list of offending Ip’s (and make sure you didn’t introduce yours accidentally), then you can execute the second part of the script:
echo '#!/bin/bash' > add_ufw_rules.sh

i_COUNTER_RULE=0; for s_OFFENDING_IP in $(cat 2020-10-03-offending-ips.txt); do i_COUNTER_RULE=$((i_COUNTER_RULE+1)); echo "ufw insert $i_COUNTER_RULE deny from $s_OFFENDING_IP to any" >> add_ufw_rules.sh; done

echo "ufw status numbered" >> add_ufw_rules.sh
echo "sudo ufw allow OpenSSH" >> add_ufw_rules.sh
echo "sudo ufw allow 22/tcp" >> add_ufw_rules.sh
echo 'sudo ufw allow "Apache Full"' >> add_ufw_rules.sh
echo "sudo ufw enable" >> add_ufw_rules.sh
Then you less your file add_ufw_rules.sh to see everything is Ok:
#!/bin/bash
ufw insert 1 deny from 40.79.250.88 to any
ufw insert 2 deny from 52.173.148.212 to any
ufw insert 3 deny from 94.103.85.175 to any
ufw insert 4 deny from 40.79.250.88 to any
ufw insert 5 deny from 78.85.208.240 to any
ufw insert 6 deny from 80.82.68.173 to any
ufw insert 7 deny from 188.165.230.118 to any
ufw insert 8 deny from 195.201.117.103 to any
ufw insert 9 deny from 40.79.250.88 to any
ufw insert 10 deny from 5.135.138.188 to any
ufw insert 11 deny from 51.116.189.135 to any
...
ufw insert 223 deny from 95.173.161.167 to any
ufw insert 224 deny from 95.84.228.227 to any
ufw status numbered
sudo ufw allow OpenSSH
sudo ufw allow 22/tcp
sudo ufw allow "Apache Full"
sudo ufw enable
Then you simply give permissions with chmod +x add_ufw_rules.sh and run the script to apply.
It’s up to you to turn on the Firewall logging:
sudo ufw logging on
Update: 2026-09-09 12:37 CEST
I created a commercial plugin for WordPress, modules for Drupal and PrestaShop named PHP Firewall that protects the sites against xmlrpc attacks, and many others, automatically and easily.
One of my Servers got heavily attacked for several days. I describe here the steps I took to stop this.
The attack consisted in several connections per second to the Server, to path /xmlrpc.php.
This is a WordPress file to control the pingback, when someone links to you.
My Server it is a small Amazon instance, a m1.small with only one core and 1,6 GB RAM, magnetic disks and that scores a discrete 203 CMIPS (my slow laptop scores 460 CMIPS).
Those massive connections caused the server to use more and more RAM, and while the xmlrpc requests were taking many seconds to reply, so more and more processes of Apache were spawned. That lead to more memory consumption, and to use all the available RAM and start using swap, with a heavy performance impact until all the memory was exhausted and the mysql processes stopped.
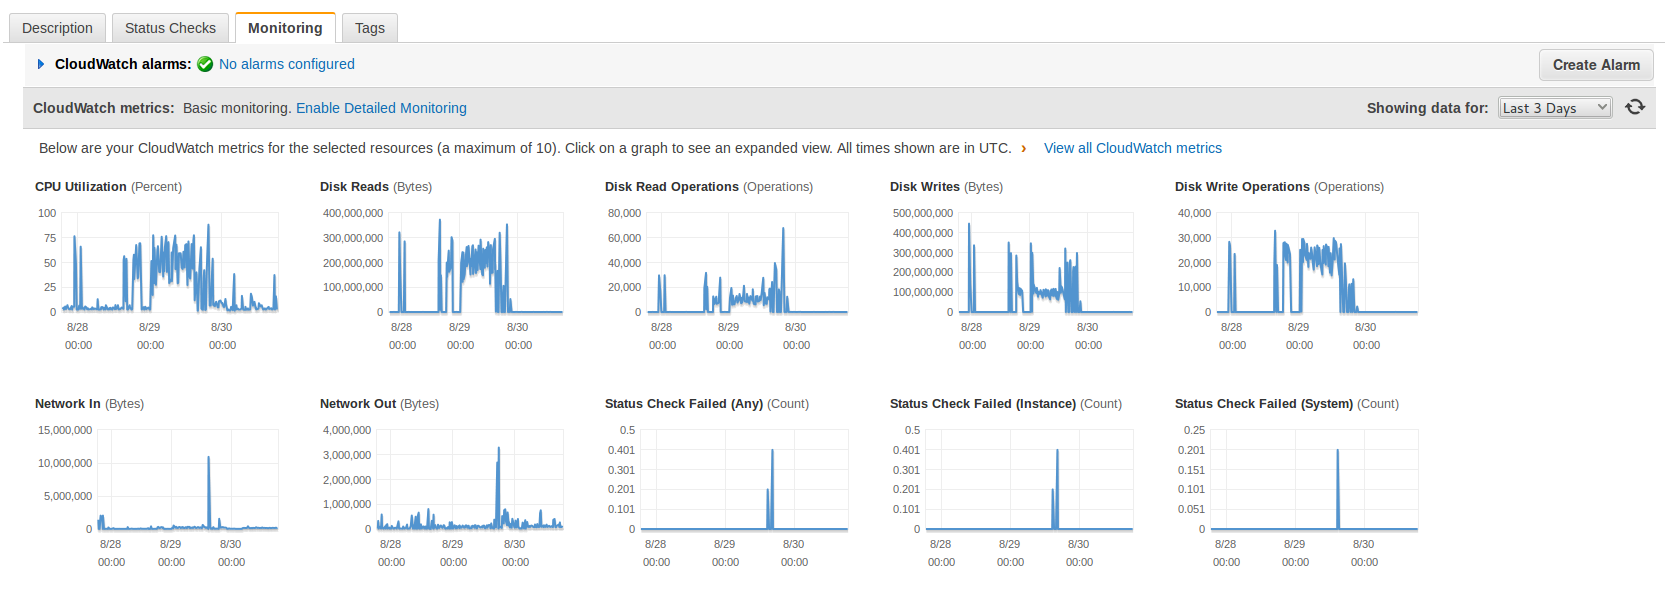
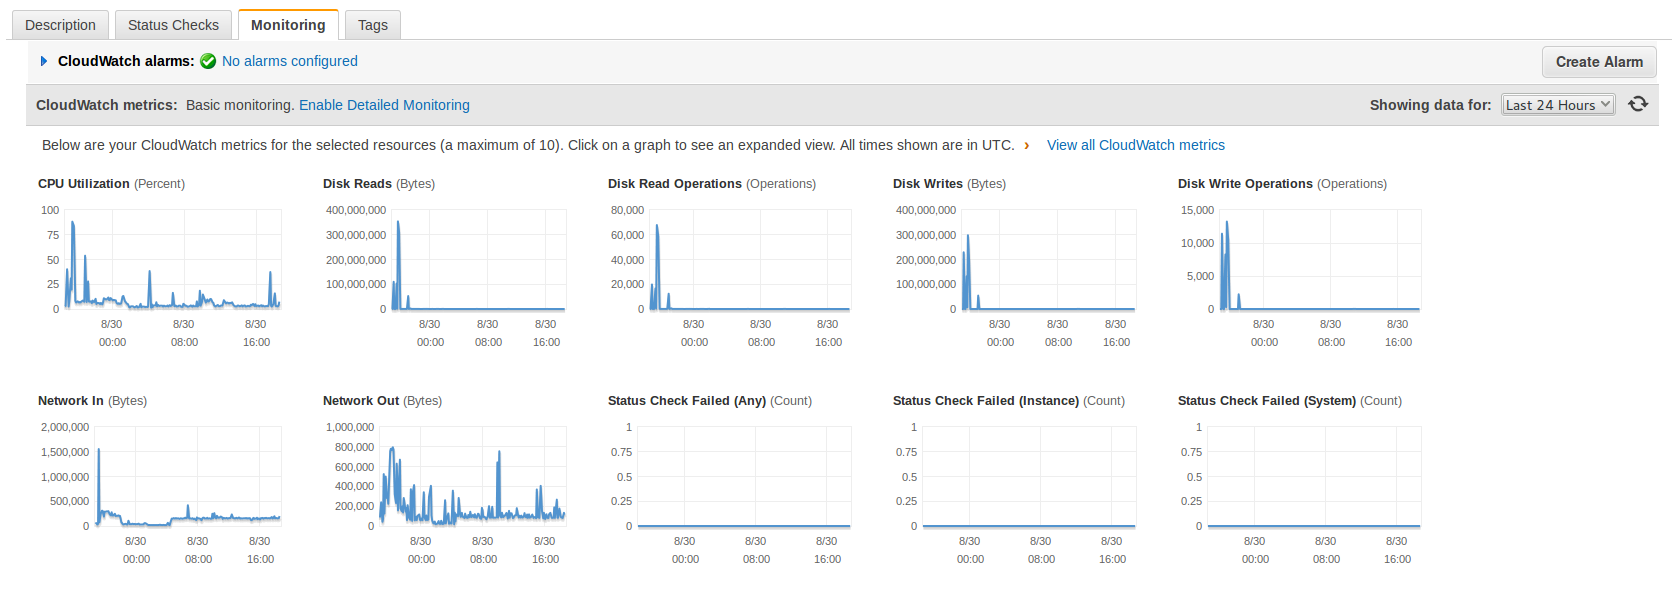
I saw that I was suffering an attack after the shutdown of MySql. I checked the CloudWatch Statistics from Amazon AWS and it was clear that I was receiving many -out of normal- requests. The I/O was really high too.
This statistics are from today to three days ago, look at the spikes when the attack was hitting hard and how relaxed the Server is now (plain line).
First I decided to simply rename the xmlrpc.php file as a quick solution to stop the attack but the number of http connections kept growing and then I saw very suspicious queries to the database.
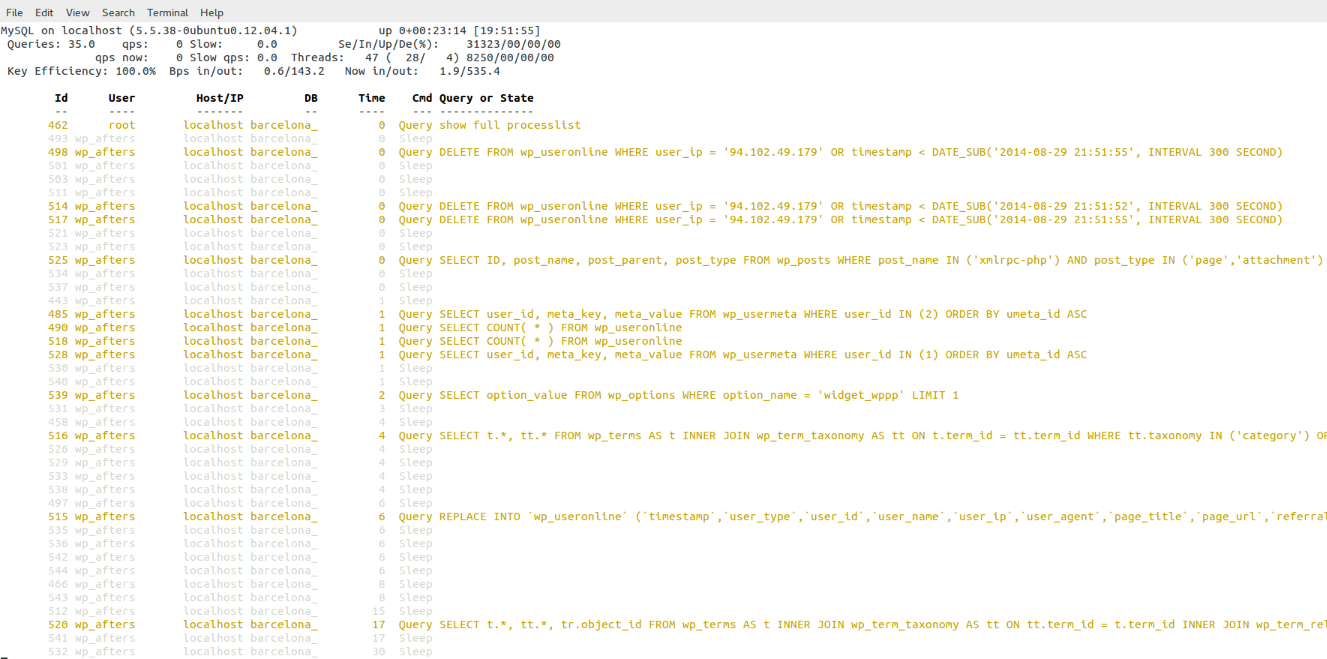
Those queries, in addition to what I’ve seen in the Apache’s error log suggested me that may be the Server was hacked by a WordPress/plugin bug and that now they were trying to hide from the database’s logs. (Specially the DELETE FROM wp_useronline WHERE user_ip = the Ip of the attacker)
[Tue Aug 26 11:47:08 2014] [error] [client 94.102.49.179] Error in WordPress Database Lost connection to MySQL server during query a la consulta SELECT option_value FROM wp_options WHERE option_name = 'uninstall_plugins' LIMIT 1 feta per include('wp-load.php'), require_once('wp-config.php'), require_once('wp-settings.php'), include_once('/plugins/captcha/captcha.php'), register_uninstall_hook, get_option
[Tue Aug 26 11:47:09 2014] [error] [client 94.102.49.179] Error in WordPress Database Lost connection to MySQL server during query a la consulta SELECT option_value FROM wp_options WHERE option_name = 'uninstall_plugins' LIMIT 1 feta per include('wp-load.php'), require_once('wp-config.php'), require_once('wp-settings.php'), include_once('/plugins/captcha/captcha.php'), register_uninstall_hook, get_option
[Tue Aug 26 11:47:10 2014] [error] [client 94.102.49.179] Error in WordPress Database Lost connection to MySQL server during query a la consulta SELECT option_value FROM wp_options WHERE option_name = 'widget_wppp' LIMIT 1 feta per include('wp-load.php'), require_once('wp-config.php'), require_once('wp-settings.php'), do_action('plugins_loaded'), call_user_func_array, wppp_check_upgrade, get_option
The error log was very ugly.
The access log was not reassuring, as it shown many attacks like that:
Was difficult to determine if the Server was receiving SQL injections so I wanted to be sure.
Note: The connection from 127.0.0.1 with OPTIONS is created by Apache when spawns another Apache.
As I had super fresh backups in another Server I was not afraid of the attack dropping the database.
I was a bit suspicious also because the /readme.html file mentioned that the version of WordPress is 3.6. In other installations it tells correctly that the version is the 3.9.2 and this file is updated with the auto-update. I was thinking about a possible very sophisticated trojan attack able to modify wp-includes/version.php and set fake $wp_version = ‘3.9.2’; Later I realized that this blog had WordPress in Catalan, my native language, and discovered that the guys that do the translations forgot to update this file (in new installations it comes not updated, and so showing 3.6). I have alerted them.
In fact later I did a diff of all the files of my WordPress installation against the official WordPress 3.9.2-ca and later a did a diff between the WordPress 3.9.2-ca and the WordPress 3.9.2 (English – default), and found no differences. My Server was Ok. But at this point, at the beginning of the investigation I didn’t know that yet.
With the info I had (queries, times, attack, readme telling v. 3.6…) I balanced the possibility to be in front of something and I decided that I had an unique opportunity to discover how they do to inject those Sql, or discover if my Server was compromised and how. The bad point is that it was the same Amazon’s Server where this blog resides, and I wanted the attack to continue so I could get more information, so during two days I was recording logs and doing some investigations, so sorry if you visited my blog and database was down, or the Server was going extremely slow. I needed that info. It was worth it.
First I changed the Apache config so the massive connections impacted a bit less the Server and so I could work on it while the attack was going on.
I informed my group of Senior friends on what’s going on and two SysAdmins gave me some good suggestions on other logs to watch and on how to stop the attack, and later a Developer joined me to look at the logs and pointed possible solutions to stop the attack. But basically all of them suggested on how to block the incoming connections with iptables and to do things like reinstalling WordPress, disabling xmlrpc.php in .htaccess, changing passwords or moving wp-admin/ to another place, but the point is that I wanted to understand exactly what was going on and how.
I checked the logs, certificates, etc… and no one other than me was accessing the Server. I also double-checked the Amazon’s Firewall to be sure that no unnecessary ports were left open. Everything was Ok.
I took a look at the Apache logs for the site and all the attacks were coming from the same Ip:
94.102.49.179
It is an Ip from a dedicated Servers company called ecatel.net. I reported them the abuse to the abuse address indicated in the ripe.net database for the range.
All the requests shown in the access.log pointed to requests to /xmlrpc.php. It was the only path requested by the attacker so that Ip did nothing more apparently.
I added some logging to WordPress xmlrpc.php file:
[Fri Aug 29 19:02:54 2014] [error] [client 94.102.49.179] XML POST: a:0:{}
[Fri Aug 29 19:02:54 2014] [error] [client 94.102.49.179] XML GET: a:0:{}
[Fri Aug 29 19:02:54 2014] [error] [client 94.102.49.179] XML REQUEST: a:0:{}
[Fri Aug 29 19:02:54 2014] [error] [client 94.102.49.179] XML SERVER: a:24:{s:9:"HTTP_HOST";s:24:"barcelona.afterstart.com";s:12:"CONTENT_TYPE";s:8:"text/xml";s:14:"CONTENT_LENGTH";s:3:"287";s:15:"HTTP_USER_AGENT";s:50:"Mozilla/4.0 (compatible: MSIE 7.0; Windows NT 6.0)";s:15:"HTTP_CONNECTION";s:5:"close";s:4:"PATH";s:28:"/usr/local/bin:/usr/bin:/bin";s:16:"SERVER_SIGNATURE";s:85:"<address>Apache/2.2.22 (Ubuntu) Server at barcelona.afterstart.com Port 80</address>\n";s:15:"SERVER_SOFTWARE";s:22:"Apache/2.2.22 (Ubuntu)";s:11:"SERVER_NAME";s:24:"barcelona.afterstart.com";s:11:"SERVER_ADDR";s:14:"[this-is-removed]";s:11:"SERVER_PORT";s:2:"80";s:11:"REMOTE_ADDR";s:13:"94.102.49.179";s:13:"DOCUMENT_ROOT";s:29:"/var/www/barcelona.afterstart.com";s:12:"SERVER_ADMIN";s:19:"webmaster@localhost";s:15:"SCRIPT_FILENAME";s:40:"/var/www/barcelona.afterstart.com/xmlrpc.php";s:11:"REMOTE_PORT";s:5:"40225";s:17:"GATEWAY_INTERFACE";s:7:"CGI/1.1";s:15:"SERVER_PROTOCOL";s:8:"HTTP/1.0";s:14:"REQUEST_METHOD";s:4:"POST";s:12:"QUERY_STRING";s:0:"";s:11:"REQUEST_URI";s:11:"/xmlrpc.php";s:11:"SCRIPT_NAME";s:11:"/xmlrpc.php";s:8:"PHP_SELF";s:11:"/xmlrpc.php";s:12:"REQUEST_TIME";i:1409338974;}
[Fri Aug 29 19:02:54 2014] [error] [client 94.102.49.179] XML FILES: a:0:{}
[Fri Aug 29 19:02:54 2014] [error] [client 94.102.49.179] XML ENV: a:0:{}
[Fri Aug 29 19:02:54 2014] [error] [client 94.102.49.179] XML RAW: <?xmlversion="1.0"?><methodCall><methodName>pingback.ping</methodName><params><param><value><string>http://seretil.me/</string></value></param><param><value><string>http://barcelona.afterstart.com/2013/09/27/afterstart-barcelona-2013-09-26/</string></value></param></params></methodCall>
[Fri Aug 29 19:02:54 2014] [error] [client 94.102.49.179] XML ALL_HEADERS: a:5:{s:4:"Host";s:24:"barcelona.afterstart.com";s:12:"Content-type";s:8:"text/xml";s:14:"Content-length";s:3:"287";s:10:"User-agent";s:50:"Mozilla/4.0 (compatible: MSIE 7.0; Windows NT 6.0)";s:10:"Connection";s:5:"close";}
So nothing in $_POST, nothing in $_GET, nothing in $_REQUEST, nothing in $_SERVER, no files submitted, but a text/xml Posted (that was logged by storing: $HTTP_RAW_POST_DATA):
I show you in a nicer formatted aspect:So basically they were trying to register a link to seretil dot me.
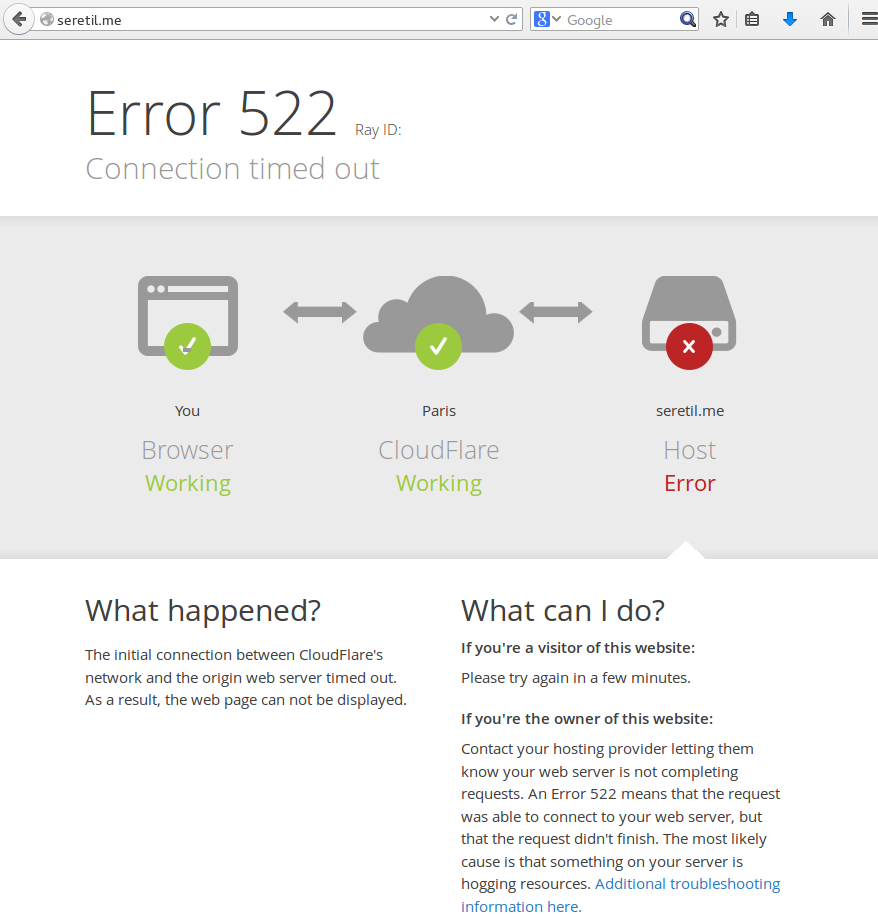
I tried and this page, hosted in CloudFare, is not working.
The problem is that responding to this spam xmlrpc request took around 16 seconds to the Server. And I was receiving several each second.
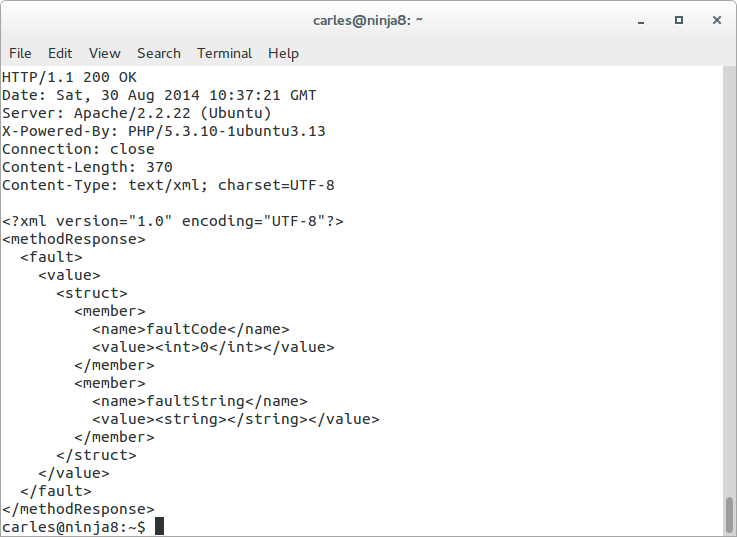
I granted access to my Ip only on the port 80 in the Firewall, restarted Apache, restarted MySql and submitted the same malicious request to the Server, and it even took 16 seconds in all my tests:
I checked and confirmed that the logs from the attacker were showing the same Content-Length and http code.
Other guys tried xml request as well but did one time or two and leaved.
The problem was that this robot was, and still sending many requests per second for days.
May be the idea was to knock down my Server, but I doubted it as the address selected is the blog of one Social Event for Senior Internet Talents that I organize: afterstart.com. It has not special interest, I do not see a political, hateful or other motivation to attack the blog from this project.
Ok, at this point it was clear that the Ip address was a robot, probably running from an infected or hacked Server, and was trying to publish a Spam link to a site (that was down). I had to clarify those strange queries in the logs.
I reviewed the WPUsersOnline plugin and I saw that the strange queries (and inefficient) that I saw belonged to WPUsersOnline plugin.
The thing was that when I renamed the xmlrpc.php the spamrobot was still posting to that file. According to WordPress .htaccess file any file that is not found on the filesystem is redirected to index.php.
So what was happening is that all the massive requests sent to xmlrpc.php were being attended by index.php, then showing an error message that page not found, but the WPUsersOnline plugin was deleting those connections. And was doing it many times, overloading also the Database.
Also I was able to reproduce the behaviour by myself, isolating by firewalling the WebServer from other Ips other than mine and doing the same post by myself many times per second.
I checked against a friend’s blog but in his Server xmlrpc.php responds in 1,5 seconds. My friend’s Server is a Digital Ocean Virtual Server with 2 cores and SSD Disks. My magnetic disks on Amazon only bring around 40 MB/second. I’ve to check in detail why my friend’s Server responds so much faster.
Checked the integrity of my databases, just in case, and were perfect. Nothing estrange with collations and the only errors in the /var/log/mysql/error.log was due to MySql crashing when the Server ran out of memory.
Rechecked in my Server, now it takes 12 seconds.
I disabled 80% of the plugins but the times were the same. The Statistics show how the things changed -see the spikes before I definitively patched the Server to block request from that Spam-robot ip, to the left-.
I checked against another WordPress that I have in the same Server and it only takes 1,5 seconds to reply. So I decided to continue investigating why this WordPress took so long to reply.
As I said before I checked that the files from my WordPress installation were the same as the original distribution, and they were. Having discarded different files the thing had to be in the database.
Even when I checked the MySql it told me that all the tables were OK, having seen that the WPUserOnline deletes all the registers older than 5 minutes, I guessed that this could lead to fragmentation, so I decided to do OPTIMIZE TABLE on all the tables of the database for the WordPress failing, with InnoDb it is basically recreating the Tables and the Indexes.
I tried then the call via RPC and my Server replied in three seconds. Much better.
Looking with htop, when I call the xmlrpc.php the CPU uses between 50% and 100%.
I checked the logs and the robot was gone. He leaved or the provider finally blocked the Server. I don’t know.
Everything became clear, it was nothing more than a sort of coincidences together. Deactivating the plugin the DELETE queries disappeared, even under heavy load of the Server.
It only was remain to clarify why when I send a call to xmlrpc to this blog, it replies in 1,5 seconds, and when I request to the Barcelona.afterstart.com it takes 3 seconds.
I activated the log of queries in mysql. To do that edit /etc/mysql/my.cnf and uncomment:
Then I checked the queries, and in the case of my blog it performs many less queries, as I was requesting to pingback to an url that was not existing, and WordPress does this query:
SELECT wp_posts.* FROM wp_posts WHERE 1=1 AND ( ( YEAR( post_date ) = 2013 AND MONTH( post_date ) = 9 AND DAYOFMONTH( post_date ) = 27 ) ) AND wp_posts.post_name = 'afterstart-barcelona-2013-09-26-meet' AND wp_posts.post_type = 'post' ORDER BY wp_posts.post_date DESC
As the url afterstart-barcelona-2013-09-26-meet with the dates indicated does not exist in my other blog, the execution ends there and does not perform the rest of the queries, that in the case of Afterstart blog were:
40 Query     SELECT post_id, meta_key, meta_value FROM wp_postmeta WHERE post_id IN (81) ORDER BY meta_id ASC
40 Query     SELECT ID, post_name, post_parent, post_type
FROM wp_posts
WHERE post_name IN ('http%3a','','seretil-me')
AND post_type IN ('page','attachment')
40 Query     SELECT   wp_posts.* FROM wp_posts  WHERE 1=1  AND (wp_posts.ID = '0') AND wp_posts.post_type = 'page'  ORDER BY wp_posts.post_date DESC
40 Query     SELECT * FROM wp_comments WHERE comment_post_ID = 81 AND comment_author_url = 'http://seretil.me/'
To confirm my theory I tried the request to my blog, with a valid url, and it lasted for 3-4 seconds, the same than Afterstart’s blog. Finally I double-checked with the blog of my friend and was slower than before. I got between 1,5 and 6 seconds, with a lot of 2 seconds response. (he has PHP 5.5 and OpCache that improves a bit, but the problem is in the queries to the database)
Honestly, the guys creating WordPress should cache this queries instead of performing 20 live queries, that are always the same, before returning the error message. Using Cache Lite or Stash, or creating an InMemory table for using as Cache, or of course allowing the use of Memcached would eradicate the DoS component of this kind of attacks. As the xmlrpc pingback feature hits the database with a lot of queries to end not allowing the publishing.
While I was finishing those tests (remember that the attacker ip has gone) another attacker from the same network tried, but I had patched the Server to ignore it:
94.102.52.157 - - [31/Aug/2014:02:06:16 +0000] "POST /xmlrpc.php HTTP/1.0" 200 189 "-" "Mozilla/4.0 (compatible: MSIE 7.0; Windows NT 6.0)"
This was trying to get a link published to a domain called socksland dot net that is a domain registered in Russia and which page is not working.
As I had all the information I wanted I finally blocked the network from the provider to access my Server ever again.
Unfortunatelly Amazon’s Firewall does not allow to block a certain Ip or range. So you can block at Iptables level or in .htaccess file or in the code. I do not recommend blocking at code level because sadly WordPress has many files accessible from outside so you would have to add your code at the beginning of all the files and because when there is a WordPress version update you’ll loss all your customizations. But I recommend proceeding to patch your code to avoid certain Ip’s if you use a CDN. As the POST will be sent directly to your Server, and the Ip’s are Ip’s from the CDN -and you can’t block them-. You have to look at the Header: X-Forwarded-For that indicates the Ip’s the proxies have passed by, and also the Client’s Ip.
I designed a program that is able to patch any PHP project to check for blacklisted Ip’s (even though a proxy) with minimal performance impact. It works with WordPress, drupal, joomla, ezpublish and Framework like Zend, Symfony, Catalonia… and I patched my code to block those unwanted robot’s requests.
A solution that will work for you probably is to disable the pingback functionality, there are several plugins that do that. Disabling completely xmlrpc is not recommended as WordPress uses it for several things (JetPack, mobile, validation…)
The same effect as adding the plugin that disables the xmlrpc pingback can be achieved by editing the functions.php from your Theme and adding:
Update: 2016-02-24 14:40 CEST I got also a heavy dictionary attack against wp-login.php .Despite having a Captcha plugin, that makes it hard to hack, it was generating some load on the system. What I did was to rename the wp-login.php to another name, like wp-login-carles.php and in wp-login.php having a simply exit();
<?php
exit();
Take in count that this will work only until WordPress is updated to the next version. Then you have to reapply the renaming trick.
Update: 2026-09-09 12:37 CEST
I created a commercial plugin for WordPress, modules for Drupal and PrestaShop named PHP Firewall that protects the sites against xmlrpc attacks, and many others, automatically and easily.