Some additional command-line tools that I use to install and use on my text client Systems. Initially here were not listed commands that are shipped with every Linux, but the additional tools I install in every Workstation or Server.
Apache benchmarks (ab)
To stress a Web Server
atop
A good complement to htop, iftop… monitoring tools
bzip2
Cool compressor better than gzip and that also accepts streams.
cfdisk
Nice tool to work with partitions through modern menus.
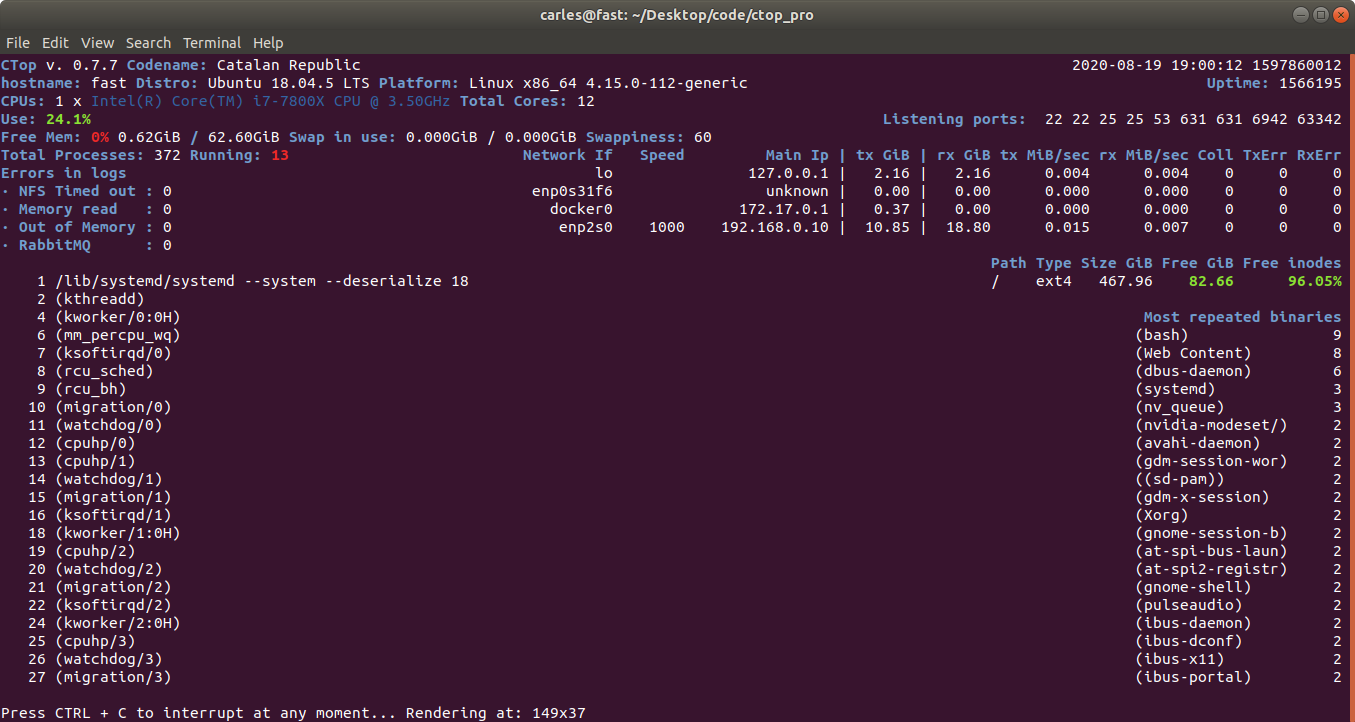
ctop
Command line / text based Linux Containers monitoring tool.
Very nice System Stats tool. You can specify individual stats, like a drive.
edac-util
Error reporting utility
edac-util --verbose
mc0: 0 Uncorrected Errors with no DIMM info
mc0: 0 Corrected Errors with no DIMM info
mc0: csrow0: 0 Uncorrected Errors
mc0: csrow0: CPU_SrcID#0_MC#0_Chan#0_DIMM#0: 0 Corrected Errors
mc0: csrow0: CPU_SrcID#0_MC#0_Chan#1_DIMM#0: 0 Corrected Errors
mc0: csrow0: CPU_SrcID#0_MC#0_Chan#2_DIMM#0: 0 Corrected Errors
mc1: 0 Uncorrected Errors with no DIMM info
mc1: 0 Corrected Errors with no DIMM info
mc1: csrow0: 0 Uncorrected Errors
mc1: csrow0: CPU_SrcID#0_MC#1_Chan#0_DIMM#0: 0 Corrected Errors
mc1: csrow0: CPU_SrcID#0_MC#1_Chan#1_DIMM#0: 0 Corrected Errors
mc1: csrow0: CPU_SrcID#0_MC#1_Chan#2_DIMM#0: 0 Corrected Errors
mc2: 0 Uncorrected Errors with no DIMM info
mc2: 0 Corrected Errors with no DIMM info
mc2: csrow0: 0 Uncorrected Errors
mc2: csrow0: CPU_SrcID#1_MC#0_Chan#0_DIMM#0: 0 Corrected Errors
mc2: csrow0: CPU_SrcID#1_MC#0_Chan#1_DIMM#0: 0 Corrected Errors
mc2: csrow0: CPU_SrcID#1_MC#0_Chan#2_DIMM#0: 0 Corrected Errors
mc3: 0 Uncorrected Errors with no DIMM info
mc3: 0 Corrected Errors with no DIMM info
mc3: csrow0: 0 Uncorrected Errors
mc3: csrow0: CPU_SrcID#1_MC#1_Chan#0_DIMM#0: 0 Corrected Errors
mc3: csrow0: CPU_SrcID#1_MC#1_Chan#1_DIMM#0: 0 Corrected Errors
mc3: csrow0: CPU_SrcID#1_MC#1_Chan#2_DIMM#0: 0 Corrected Errors
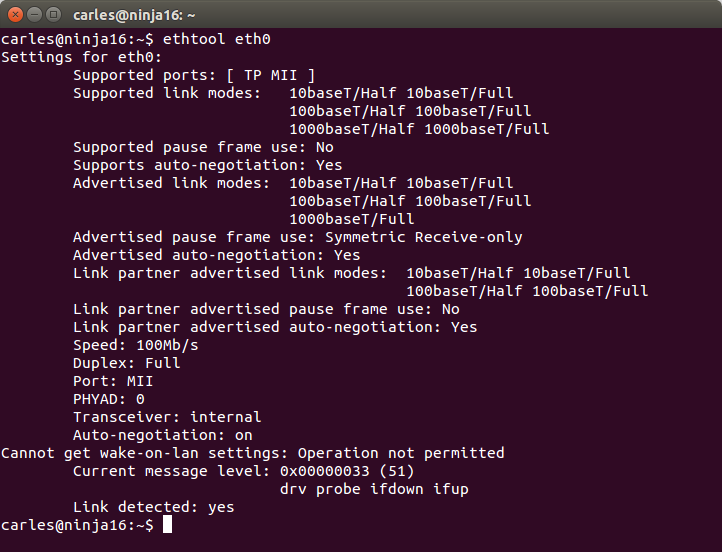
ethtool
fatrace Reports file access events from all running processes in real time.
flock With flock several processes can have a shared lock at the same time, or be waiting to acquire a write lock. With lslocks from util-linux package you can get a list of these processes.
fstrim
discard unused blocks on a mounted filesystem (local or remote). Is useful for freeing blocks no longer used in ZFS zvols. That can also be achieved by mount -o discard
fuser Show which processes use the named files, sockets, or filesystems.
To set the metrics of all IPV4 routes attached to a given network interface
ifstat
Pretty network interfaces stats.
iftop
To watch metrics for a network interface (or wireless)
iostat
CPU and IO devices stats. I modified some collectors for telegraf and influxdb consumed by grafana for fetching the Write KB/s, Read KB/s, Bandwidth of the Magnetic Spinning drives and SSD during declustered rebuild.
iotop
iperf
Perform network throughput tests
ipmitool
iptables
iscsiadm
java (jre Oracle and OpenJDK)
journalctl
ldap-utils
ldapsearch and the other tools to work with LDAP.
less According to manpages, the opposite of more. :) What it does is display a file, and you can scroll up/down, you can search for patterns… Examples: cat /etc/passwd | less less /etc/passwd # -n doesn’t count the lines, to save time # For a specific Offset less -n +500000000P /var/log/apache2/giant.log # For 50% point less -n +50p /var/log/apache2/giant.log
lrzip /lrztar
Compressor that compresses very efficiently big files, specially GB of of source code.
lrzsz (Zmodem)
An utility to send files to the Server through a terminal.
Very useful when you don’t want to scp or rsftp, for example because that requires MFA (Multi Factor Authentication) to be performed again and you already have a session open.
Moba xTerm for Windows is one of the Terminal clients that accepts Upload/Download of Z-modem
apt install lrzsz
lsblk
List the block devices. Also is handy blkid but you can get this from /dev/disk/by-id/
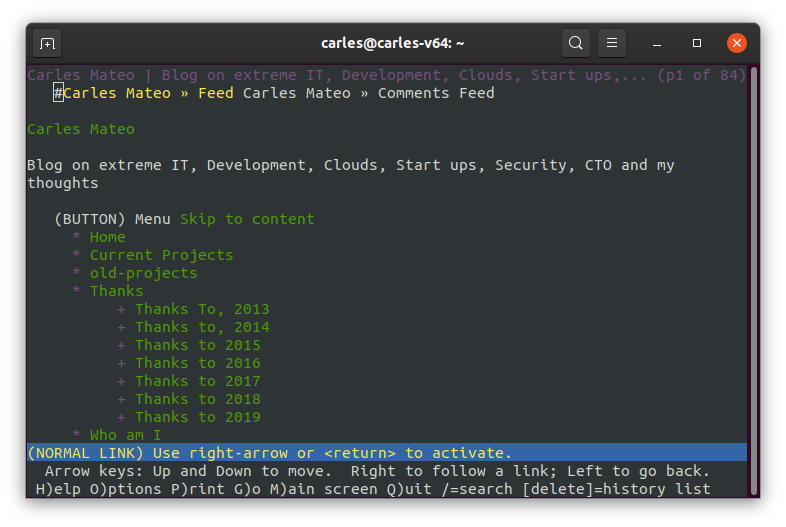
lynx
Text browser. really handy.
ltrace To trace library calls.
mc
Midnight Commander
md5sum
memtester
Basically for testing Memory.
This will allocate 4GB of RAM and run the test 10 times.
sudo memtester 4096 10
mtr
Network tool mix between ping and traceroute.
mytop
To see in real time queries and slow queries to mysql
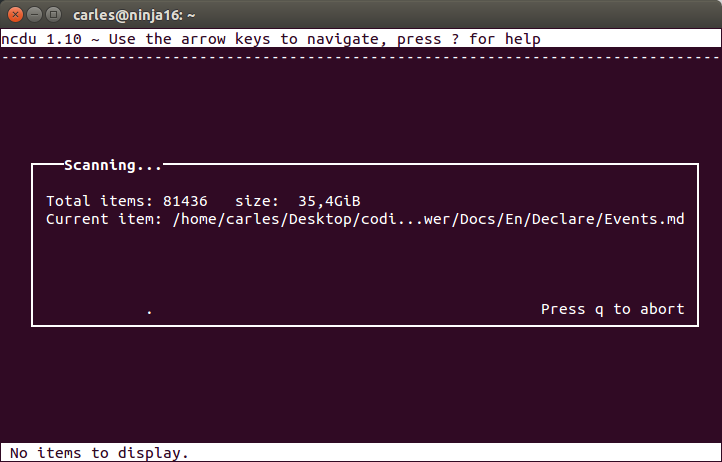
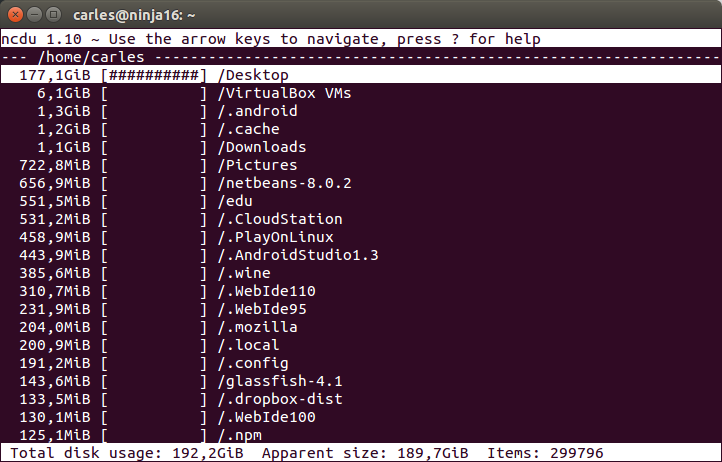
ncdu
Show the space used by any directory and subdirectory
nginx (fpm-php) and apache
The webservers
nfs client
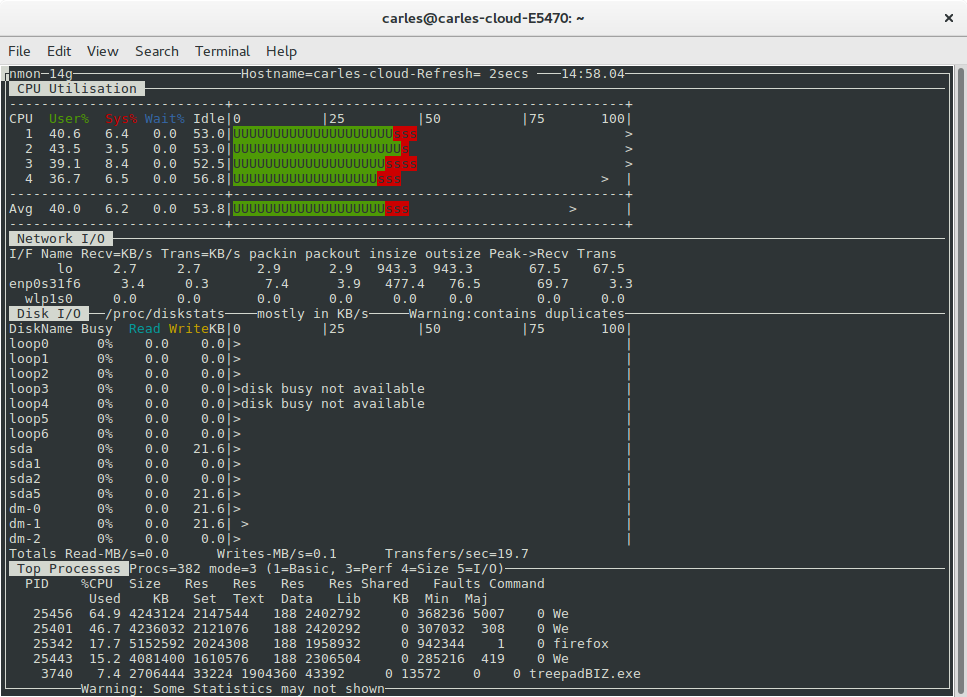
nmon
Offers monitoring of different aspects: Network, Disk, Processes…
open-vpn
openssh-server
parted
Partition manipulation
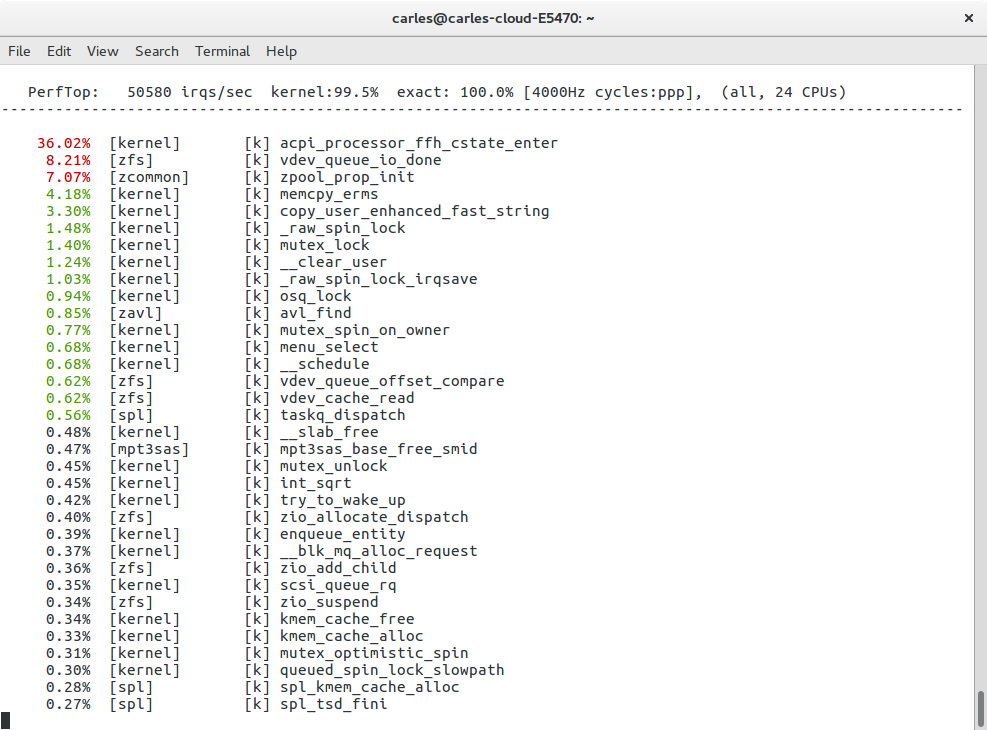
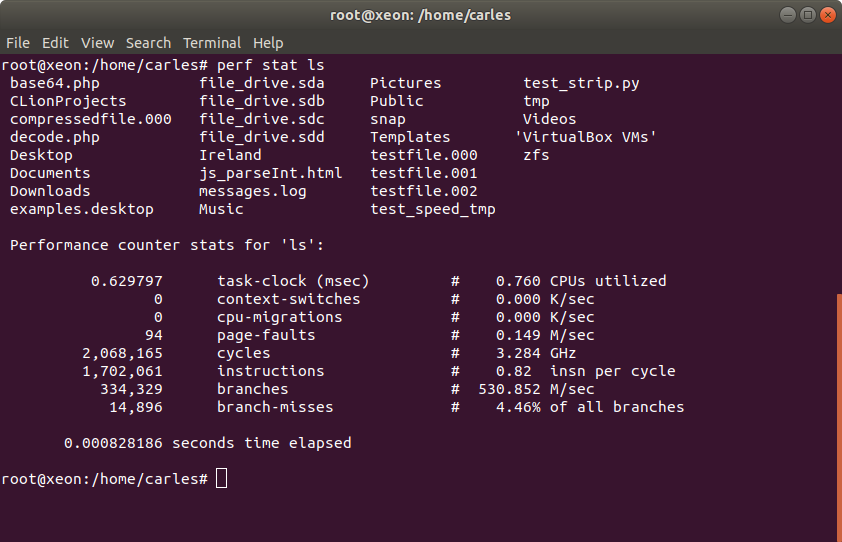
perf
Performance profiler.
Ie: perf top perf stat ls
PHP + curl + mysql (hhvm)
pixz
A parallel, multiprocessor, variant of gzip/bzip2 that can leverage several processors to speed up the compression over files.
If the input looks like a tar archive, it also creates an index of all the files in the archive. This allows the extraction of only a small segment of the tarball, without needing to decompress the entire archive.
postcat
postcat -q ID shows the details of a message in the queue
python-pip and pypy
pv Pipe Viewer – is a terminal-based tool for monitoring the progress of data through a pipeline. It can be inserted into any normal pipeline between two processes to give a visual indication of how quickly data is passing through, how long it has taken, how near to completion it is, and an estimate of how long it will be until completion.
dd if=/dev/urandom | pv | dd of=/dev/null
Output:
1,74MB 0:00:09 [ 198kB/s] [ <=> ]
Probably you’ll prefer to use dd with status=progress option, it’s just a sample.
Utility to work with partitions that can export and import configs through STDIN and STDOUT to automate partitions operations.
slabtop Displays Kernel slab cache information in real time.
smartctl
Utility for dealing with the S.M.A.R.T. features of the disks, knowing errors…
split Split a file into several, based by text lines, or binary: number of bytes per file.
sha512sum
sshfs
Mount a mountpoint on a remote Server by using SSH.
sshpass SSH without typing the password. -f for reading it from a file. sshpass -p “mypassword” ssh -o StrictHostKeyChecking=no root@10.251.35.251
In this sample passing the command ls, so this will be executed, and logout. sshpass -p “mypassword” ssh -o StrictHostKeyChecking=no root@10.251.35.251 ls
sshuttle
A poor’s man VPN through SSH that is available for Linux and Mac OS X.
Tree simply shows the directory hierarchy in a graphical (text mode) way. Useful to see where files and subfolders are.
xxd Make a hexdump or do the reverse
sudo xxd /dev/nvme0n1p1 | less
zcat Just like cat, but for compressed filed.
zcat logs.tar.gz | grep "Error"
zcat logs.tar.gz | less
zless
zram-config
Sergey Davidoff stumbled upon a project called compcache that creates a RAM based block device which acts as a swap disk, but is compressed and stored in memory instead of swap disk (which is slow), allowing very fast I/O and increasing the amount of memory available before the system starts swapping to disk. compcache was later re-written under the name zRam and is now integrated into the Linux kernel.
Whatch allow you to execuate a command and what it (refresh it) at a given intervals, for example every two seconds. For example, if normally I would do:
while [ true ]; do zpool status | head -n10 ; sleep 10; done
while [ true ]; do df -h; sleep 60; done
while [ true ]; do ls -al /tmp | head -n5 ; sleep 2; done
Then I can do:
watch -n10 zpool status
Or:
watch -n60 df -h
Or
watch "ls -al /tmp | head -n5"
For my Dockers, and cloudinit with Ubuntu, my defaults are:
apt update; apt install htop mc ncdu strace git binutils
Notes on 2017-03-26 18:57 CEST – Unix time: 1490547518 :
As several of you have noted, it would be much better to use a random value, for example, read by disk. This will be an improvement done in the next benchmark. Good suggestion thanks.
Due to my lack of time it took more than expected updating the article. I was in a long process with google, and now I’m looking for a new job.
I note that most of people doesn’t read the article and comment about things that are well indicated on it. Please before posting, read, otherwise don’t be surprise if the comment is not published. I’ve to keep the blog clean of trash.
I’ve left out few comments cause there were disrespectful. Mediocrity is present in the society, so simply avoid publishing comments that lack the basis of respect and good education. If a comment brings a point, under the point of view of Engineering, it is always published.
Thanks.
(This article was last updated on 2015-08-26 15:45 CEST – Unix time: 1440596711. See changelog at bottom)
One may think that Assembler is always the fastest, but is that true?.
If I write a code in Assembler in 32 bit instead of 64 bit, so it can run in 32 and 64 bit, will it be faster than the code that a dynamic compiler is optimizing in execution time to benefit from the architecture of my computer?.
What if a future JIT compiler is able to use all the cores to execute a single thread developed program?.
This article shows some results and shares my conclusions. It is as a base to discuss with my colleagues. Is not an end, we are always doing tests, looking for the edge, and looking at the root of the things in detail. And often things change from one version to the other. This article shows not an absolute truth, but brings some light into interesting aspects.
It could show the performance for the certain case used in the test, although generic core instructions have been selected. Many more tests are necessary, and some functions differ in the performance. But this article is a necessary starting for the discussion with my IT-extreme-lover friends and a necessary step for the next upcoming tests.
It brings very important data for Managers and Decision Makers, as choosing the adequate performance language can save millions in hardware (specially when you use the Cloud and pay per hour of use) or thousand hours in Map Reduce processes.
Acknowledgements and thanks
Credit for the great Eduard Heredia, for porting my C source code to:
Go
Ruby
Node.js
And for the nice discussions of the results, an on the optimizations and dynamic vs static compilers.
Thanks to Juan Carlos Moreno, CTO of ECManaged Cloud Software for suggesting adding Python and Ruby to the languages tested when we discussed my initial results.
Thanks to Joel Molins for the interesting discussions on Java performance and garbage collection.
I was inspired to do my own comparisons by the benchmarks comparing different framework by techempower. It is amazing to see the results of the tests, like how C++ can serialize JSon 1,057,793 times per second and raw PHP only 180,147 (17%).
For the impatients
I present the results of the tests, and the conclusions, for those that doesn’t want to read about the details. For those that want to examine the code, and the versions of every compiler, and more in deep conclusions, this information is provided below.
Results
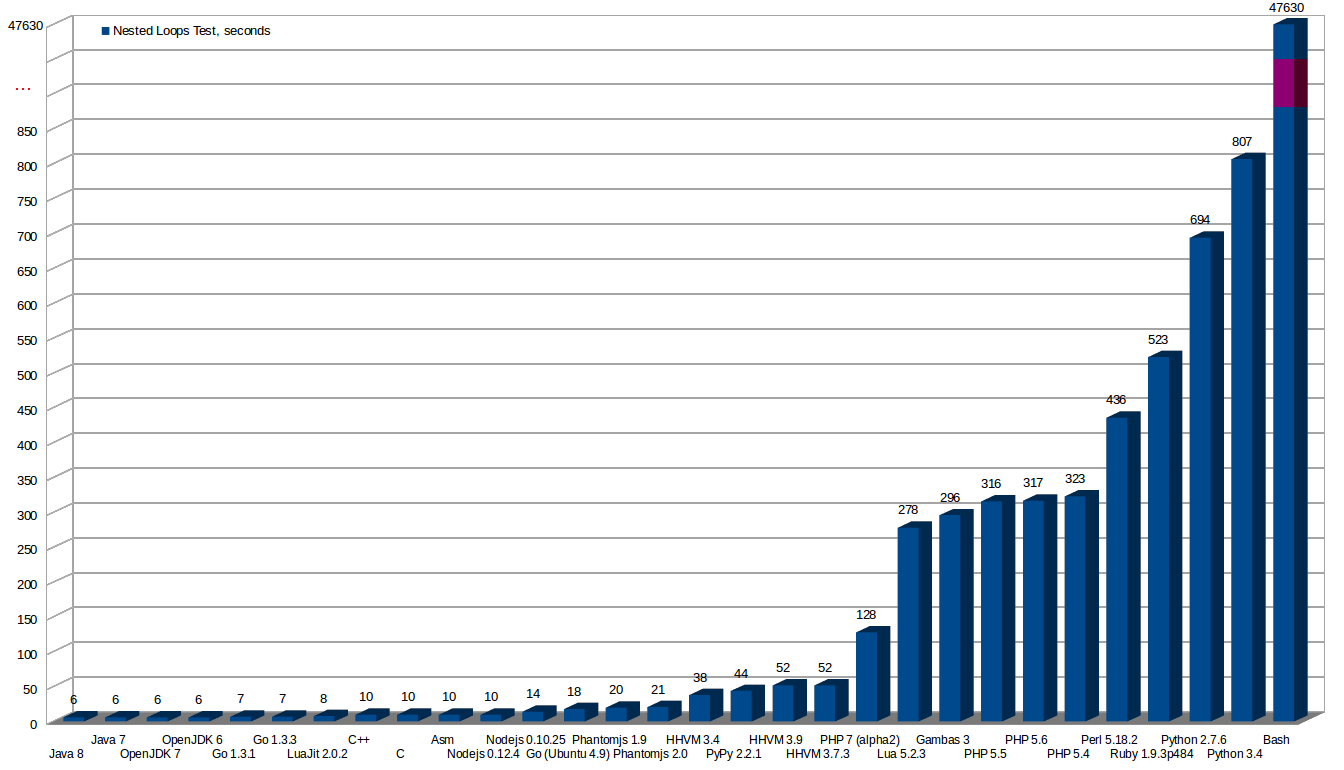
This image shows the results of the tests with every language and compiler.
All the tests are invoked from command line. All the tests use only one core. No tests for the web or frameworks have been made, are another scenarios worth an own article.
More seconds means a worst result. The worst is Bash, that I deleted from the graphics, as the bar was crazily high comparing to others.
* As later is discussed my initial Assembler code was outperformed by C binary because the final Assembler code that the compiler generated was better than mine.
After knowing why (later in this article is explained in detail) I could have reduced it to the same time than the C version as I understood the improvements made by the compiler.
Table of times:
Seconds executing
Language
Compiler used
Version
6 s.
Java
Oracle Java
Java JDK 8
6 s.
Java
Oracle Java
Java JDK 7
6 s.
Java
Open JDK
OpenJDK 7
6 s.
Java
Open JDK
OpenJDK 6
7 s.
Go
Go
Go v.1.3.1 linux/amd64
7 s.
Go
Go
Go v.1.3.3 linux/amd64
8 s.
Lua
LuaJit
Luajit 2.0.2
10 s.
C++
g++
g++ (Ubuntu 4.8.2-19ubuntu1) 4.8.2
10 s.
C
gcc
gcc (Ubuntu 4.8.2-19ubuntu1) 4.8.2
10 s.
(* first version was 13 s. and then was optimized)
Assembler
nasm
NASM version 2.10.09 compiled on Dec 29 2013
10 s.
Nodejs
nodejs
Nodejs v0.12.4
14 s.
Nodejs
nodejs
Nodejs v0.10.25
18 s.
Go
Go
go version xgcc (Ubuntu 4.9-20140406-0ubuntu1) 4.9.0 20140405 (experimental) [trunk revision 209157] linux/amd64
20 s.
Phantomjs
Phantomjs
phantomjs 1.9.0
21 s.
Phantomjs
Phantomjs
phantomjs 2.0.1-development
38 s.
PHP
Facebook HHVM
HipHop VM 3.4.0-dev (rel)
44 s.
Python
Pypy
Pypy 2.2.1 (Python 2.7.3 (2.2.1+dfsg-1, Nov 28 2013, 05:13:10))
GNU bash, version 4.3.11(1)-release (x86_64-pc-linux-gnu)
Conclusions and Lessons Learnt
There are languages that will execute faster than a native Assembler program, thanks to the JIT Compiler and to the ability to optimize the program at runtime for the architecture of the computer running the program (even if there is a small initial penalty of around two seconds from JIT when running the program, as it is being analysed, is it more than worth in our example)
Modern Java can be really fast in certain operations, it is the fastest in this test, thanks to the use of JIT Compiler technology and a very good implementation in it
Oracle’s Java and OpenJDK shows no difference in performance in this test
Script languages really sucks in performance. Python, Perl and Ruby are terribly slow. That costs a lot of money if you Scale as you need more Server in the Cloud
JIT compilers for Python: Pypy, and for Lua: LuaJit, make them really fly. The difference is truly amazing
The same language can offer a very different performance using one version or another, for example the go that comes from Ubuntu packets and the last version from official page that is faster, or Python 3.4 is much slower than Python 2.7 in this test
Bash is the worst language for doing the loop and inc operations in the test, lasting for more than 13 hours for the test
From command line PHP is much faster than Python, Perl and Ruby
Facebook Hip Hop Virtual Machine (HHVM) improves a lot PHP’s speed
It looks like the future of compilers is JIT.
Assembler is not always the fastest when executed. If you write a generic Assembler program with the purpose of being able to run in many platforms you’ll not use the most powerful instructions specific of an architecture, and so a JIT compiler can outperform your code. An static compiler can also outperform your code with very clever optimizations. People that write the compilers are really good. Unless you’re really brilliant with Assembler probably a C/C++ code beats the performance of your code. Even if you’re fantastic with Assembler it could happen that a JIT compiler notices that some executions can be avoided (like code not really used) and bring magnificent runtime optimizations. (for example a near JMP is much more less costly than a far JMP Assembler instruction. Avoiding dead code could result in a far JMP being executed as near JMP, saving many cycles per loop)
Optimizations really needs people dedicated to just optimizations and checking the speed of the newly added code for the running platforms
Node.js was a big surprise. It really performed well. It is promising. New version performs even faster
go is promising. Similar to C, but performance is much better thanks to deciding at runtime if the architecture of the computer is 32 or 64 bit, a very quick compilation at launch time, and it compiling to very good assembler (that uses the 64 bit instructions efficiently, for example)
Gambas 3 performed surprisingly fast. Better than PHP
You should be careful when using C/C++ optimization -O3 (and -O2) as sometimes it doesn’t work well (bugs) or as you may expect, for example by completely removing blocks of code if the compiler believes that has no utility (like loops)
Perl performance really change from using a for style or another. (See Perl section below)
Modern CPUs change the frequency to save energy. To run the tests is strictly recommended to use a dedicated machine, disabling the CPU governor and setting a frequency for all the cores, booting with a text only live system, without background services, not mounting disks, no swap, no network
(Please, before commenting read completely the article )
Explanations in details
Obviously an statically compiled language binary should be faster than an interpreted language.
C or C++ are much faster than PHP. And good code machine is much faster of course.
But there are also other languages that are not compiled as binary and have really fast execution.
For example, good Web Java Application Servers generate compiled code after the first request. Then it really flies.
For web C# or .NET in general, does the same, the IIS Application Server creates a native DLL after the first call to the script. And after this, as is compiled, the page is really fast.
With C statically linked you could generate binary code for a particular processor, but then it won’t work in other processors, so normally we write code that will work in all the processors at the cost of not using all the performance of the different CPUs or use another approach and we provide a set of different binaries for the different architectures. A set of directives doing one thing or other depending on the platform detected can also be done, but is hard, long and tedious job with a lot of special cases treatment. There is another approach that is dynamic linking, where certain things will be decided at run time and optimized for the computer that is running the program by the JIT (Just-in-time) Compiler.
Java, with JIT is able to offer optimizations for the CPU that is running the code with awesome results. And it is able to optimize loops and mathematics operations and outperform C/C++ and Assembler code in some cases (like in our tests) or to be really near in others. It sounds crazy but nowadays the JIT is able to know the result of several times executed blocks of code and to optimize that with several strategies, speeding the things incredible and to outperform a code written in Assembler. Demonstrations with code is provided later.
A new generation has grown knowing only how to program for the Web. Many of them never saw Assembler, neither or barely programmed in C++.
None of my Senior friends would assert that a technology is better than another without doing many investigations before. We are serious. There is so much to take in count, so much to learn always, that one has to be sure that is not missing things before affirming such things categorically. If you want to be taken seriously, you have to take many things in count.
Environment for the tests
Hardware and OS
Intel(R) Core(TM) i7-4770S CPU @ 3.10GHz with 32 GB RAM and SSD Disk.
Ubuntu Desktop 14.04 LTS 64 bit
Software base and compilers
PHP versions
Shipped with my Ubuntu distribution:
php -v
PHP 5.5.9-1ubuntu4.3 (cli) (built: Jul  7 2014 16:36:58)
Copyright (c) 1997-2014 The PHP Group
Zend Engine v2.5.0, Copyright (c) 1998-2014 Zend Technologies
with Zend OPcache v7.0.3, Copyright (c) 1999-2014, by Zend Technologies
LuaJIT 2.0.2 -- Copyright (C) 2005-2013 Mike Pall. http://luajit.org/
Nodejs
Installed with apt-get install nodejs:
nodejs --version
v0.10.25
Installed by compiling the sources:
node --version
v0.12.4
Phantomjs
Installed with apt-get install phantomjs:
phantomjs --version
1.9.0
Compiled from sources:
/path/phantomjs --version
2.0.1-development
Python 2.7
python --version
Python 2.7.6
Python 3
python3 --version
Python 3.4.0
Perl
perl -version
This is perl 5, version 18, subversion 2 (v5.18.2) built for x86_64-linux-gnu-thread-multi
(with 41 registered patches, see perl -V for more detail)
Bash
bash --version
GNU bash, version 4.3.11(1)-release (x86_64-pc-linux-gnu)
Copyright (C) 2013 Free Software Foundation, Inc.
License GPLv3+: GNU GPL version 3 or later <http://gnu.org/licenses/gpl.html>

This is free software; you are free to change and redistribute it.
There is NO WARRANTY, to the extent permitted by law.
Test: Time required for nested loops
This is the first sample. It is an easy-one.
The main idea is to generate a set of nested loops, with a simple counter inside.
When the counter reaches 51 it is set to 0.
This is done for:
Preventing overflow of the integer if growing without control
Preventing the compiler from optimizing the code (clever compilers like Java or gcc with -O3 flag for optimization, if it sees that the var is never used, it will see that the whole block is unnecessary and simply never execute it)
Doing only loops, the increment of a variable and an if, provides us with basic structures of the language that are easily transformed to Assembler. We want to avoid System calls also.
This is the base for the metrics on my Cloud Analysis of Performance cmips.net project.
Here I present the times for each language, later I analyze the details and the code.
Take in count that this code only executes in one thread / core.
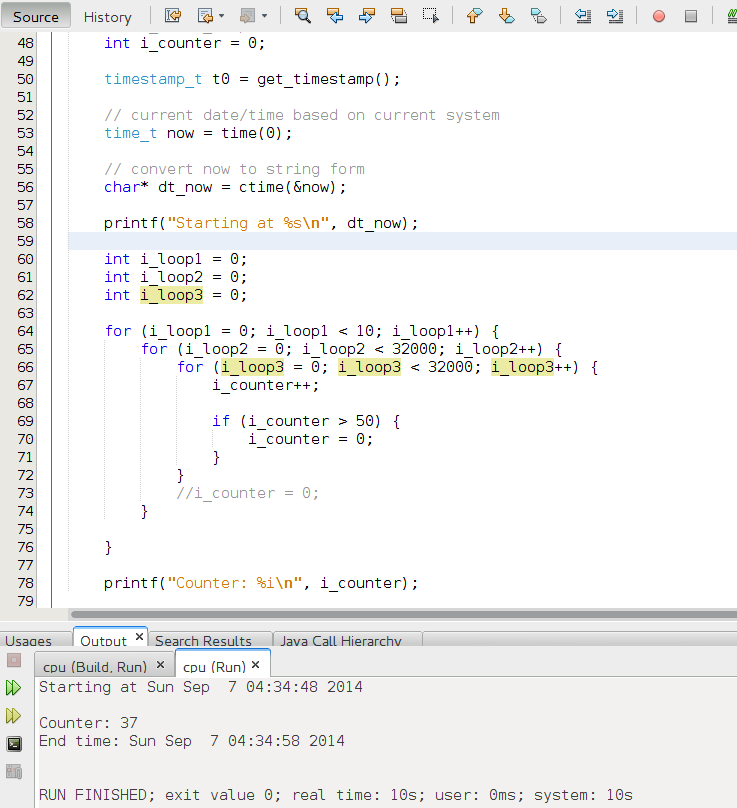
C++
C++ result, it takes 10 seconds.
Code for the C++:
/*
* File:   main.cpp
* Author: Carles Mateo
*
* Created on August 27, 2014, 1:53 PM
*/

#include <cstdlib>
#include <iostream>
#include <stdio.h>
#include <stdlib.h>
#include <sys/time.h>
#include <ctime>

using namespace std;

typedef unsigned long long timestamp_t;

static timestamp_t get_timestamp()
{
    struct timeval now;
    gettimeofday (&now, NULL);
    return  now.tv_usec + (timestamp_t)now.tv_sec * 1000000;
}

int main(int argc, char** argv) {

    timestamp_t t0 = get_timestamp();

    // current date/time based on current system
    time_t now = time(0);

    // convert now to string form
    char* dt_now = ctime(&now);

    printf("Starting at %s\n", dt_now);

    int i_loop1 = 0;
    int i_loop2 = 0;
    int i_loop3 = 0;


    for (i_loop1 = 0; i_loop1 < 10; i_loop1++) {
        for (i_loop2 = 0; i_loop2 < 32000; i_loop2++) {
            for (i_loop3 = 0; i_loop3 < 32000; i_loop3++) {
                i_counter++;

                if (i_counter > 50) {
                    i_counter = 0;
                }
            }
            // If you want to test how the compiler optimizes that, remove the comment
            //i_counter = 0;
         }
     }

    // This is another trick to avoid compiler's optimization. To use the var somewhere
    printf("Counter: %i\n", i_counter);

    timestamp_t t1 = get_timestamp();
    double secs = (t1 - t0) / 1000000.0L;
    time_t now_end = time(0);

    // convert now to string form
    char* dt_now_end = ctime(&now_end);

    printf("End time: %s\n", dt_now_end);

    return 0;
}
You can try to remove the part of code that makes the checks:
                /* if (i_counter > 50) {
                    i_counter = 0;
                }*/
And the use of the var, later:
//printf("Counter: %i\n", i_counter);
Note: And adding a i_counter = 0; at the beginning of the loop to make sure that the counter doesn’t overflows. Then the C or C++ compiler will notice that this result is never used and so it will eliminate the code from the program, having as result and execution time of 0.0 seconds.
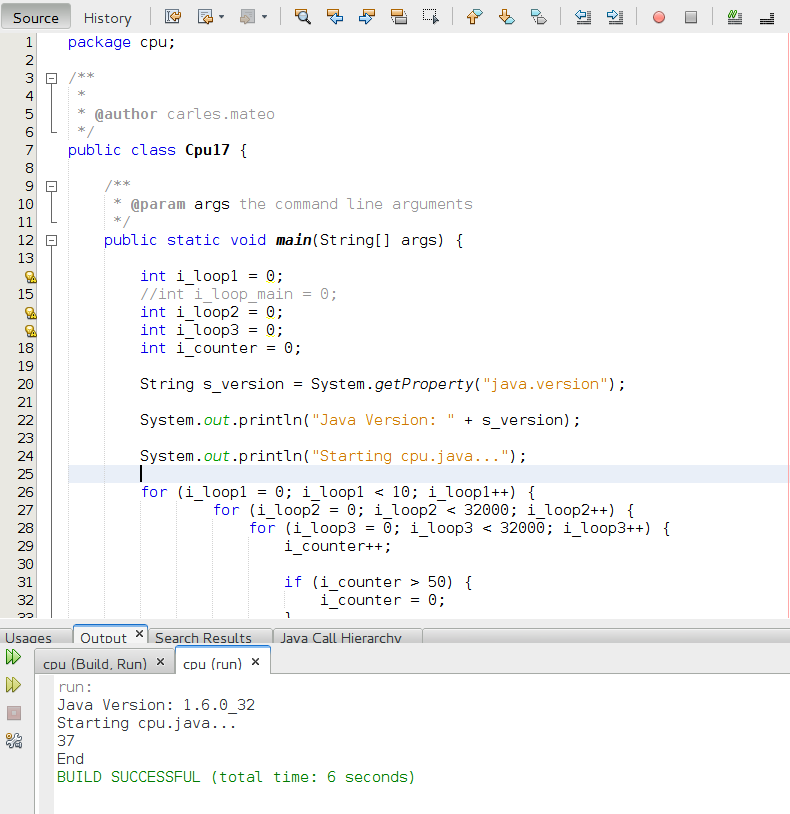
Java
The code in Java:
package cpu;

/**
 *
 * @author carles.mateo
 */
public class Cpu {

    /**
     * @param args the command line arguments
     */
    public static void main(String[] args) {

        int i_loop1 = 0;
        //int i_loop_main = 0;
        int i_loop2 = 0;
        int i_loop3 = 0;
        int i_counter = 0;

        String s_version = System.getProperty("java.version");

        System.out.println("Java Version: " + s_version);

        System.out.println("Starting cpu.java...");

        for (i_loop1 = 0; i_loop1 < 10; i_loop1++) {
                for (i_loop2 = 0; i_loop2 < 32000; i_loop2++) {
                    for (i_loop3 = 0; i_loop3 < 32000; i_loop3++) {
                        i_counter++;

                        if (i_counter > 50) {
                            i_counter = 0;
                        }
                    }
                }
        }

        System.out.println(i_counter);
        System.out.println("End");
    }

}
It is really interesting how Java, with JIT outperforms C++ and Assembler.
It takes only 6 seconds.
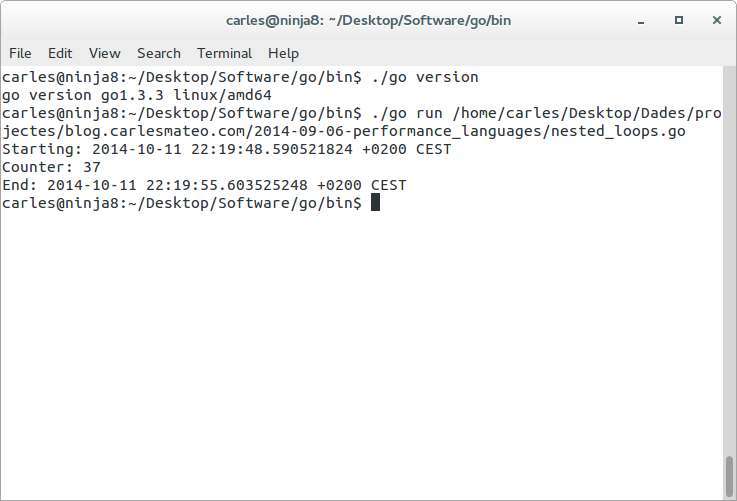
Go
The case of Go is interesting because I saw a big difference from the go shipped with Ubuntu, and the the go I downloaded from http://golang.org/dl/. I downloaded 1.3.1 and 1.3.3 offering the same performance. 7 seconds.
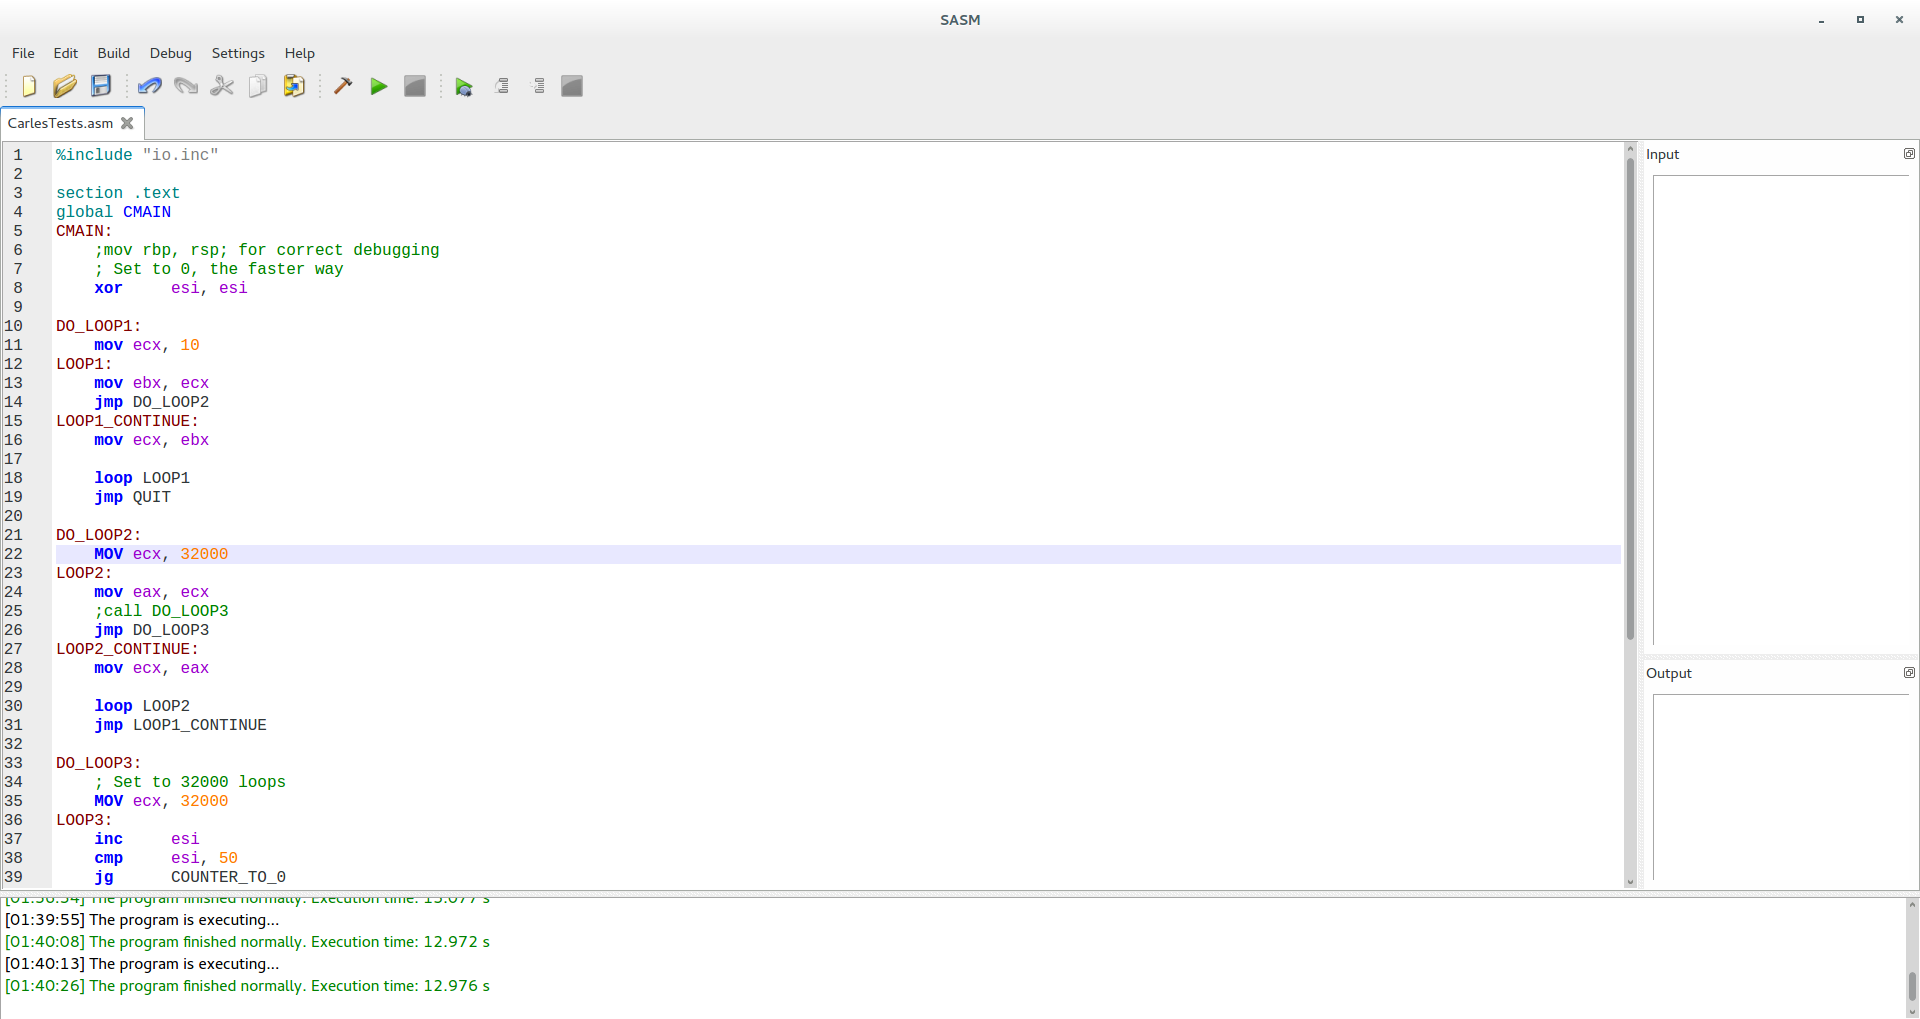
Here is the Assembler for Linux code, with SASM, that I created initially (bellow is optimized).
%include "io.inc"

section .text
global CMAIN
CMAIN:
    ;mov rbp, rsp; for correct debugging
    ; Set to 0, the faster way
    xor     esi, esi

DO_LOOP1:
    mov ecx, 10
LOOP1:
    mov ebx, ecx
    jmp DO_LOOP2
LOOP1_CONTINUE:
    mov ecx, ebx

    loop LOOP1
    jmp QUIT

DO_LOOP2:
    mov ecx, 32000
LOOP2:
    mov eax, ecx
    ;call DO_LOOP3
    jmp DO_LOOP3
LOOP2_CONTINUE:
    mov ecx, eax

    loop LOOP2
    jmp LOOP1_CONTINUE

DO_LOOP3:
    ; Set to 32000 loops
    MOV ecx, 32000
LOOP3:
    inc     esi
    cmp     esi, 50
    jg      COUNTER_TO_0
LOOP3_CONTINUE:

    loop LOOP3
    ;ret
    jmp LOOP2_CONTINUE

COUNTER_TO_0:
    ; Set to 0
    xor     esi, esi

    jmp LOOP3_CONTINUE

;    jmp QUIT

QUIT:
    xor eax, eax
    ret
It took 13 seconds to complete.
One interesting explanation on why binary C or C++ code is faster than Assembler, is because the C compiler generates better Assembler/binary code at the end. For example, the use of JMP is expensive in terms of CPU cycles and the compiler can apply other optimizations and tricks that I’m not aware of, like using faster registers, while in my code I use ebx, ecx, esi, etc… (for example, imagine that using cx is cheaper than using ecx or rcx and I’m not aware but the guys that created the Gnu C compiler are)
To be sure of what’s going on I switched in the LOOP3 the JE and the JMP of the code, for groups of 50 instructions, INC ESI, one after the other and the time was reduced to 1 second.
(In C also was reduced even a bit more when doing the same)
To know what’s the translation of the C code into Assembler when compiled, you can do:
objdump --disassemble nested_loops
Look for the section main and you’ll get something like:
Note: this is in the AT&T syntax and not in the Intel. That means that add $0x1,%edx is adding 1 to EDX registerg (origin, destination).
As you can see the C compiler has created a very differed Assembler version respect what I created.
For example at 400470 it uses EDI register to store 10, so to control the number of the outer loop.
It uses ESI to store 32000 (Hexadecimal 0x7D00), so the second loop.
And EAX for the inner loop, at 400480.
It uses EDX for the counter, and compares to 50 (Hexa 0x33) at 40048B.
In 40048E it uses the CMOVGE (Mov if Greater or Equal), that is an instruction that was introduced with the P6 family processors, to move the contents of ECX to EDX if it was (in the CMP) greater or equal to 50. As in 400475 a XOR ECX, ECX was performed, EXC contained 0.
And it cleverly used SUB and JNE (JNE means Jump if not equal and it jumps if ZF = 0, it is equivalent to JNZ Jump if not Zero).
It uses between 4 and 16 clocks, and the jump must be -128 to +127 bytes of the next instruction. As you see Jump is very costly.
Looks like the biggest improvement comes from the use of CMOVGE, so it saves two jumps that my original Assembler code was performing.
Those two jumps multiplied per 32000 x 32000 x 10 times, are a lot of Cpu clocks.
So, with this in mind, as this Assembler code takes 10 seconds, I updated the graph from 13 seconds to 10 seconds.
Lua
This is the initial code:
local i_counter = 0

local i_time_start = os.clock()

for i_loop1=0,9 do
    for i_loop2=0,31999 do
        for i_loop3=0,31999 do
            i_counter = i_counter + 1
            if i_counter > 50 then
                i_counter = 0
            end
        end
    end
end

local i_time_end = os.clock()
print(string.format("Counter: %i\n", i_counter))
print(string.format("Total seconds: %.2f\n", i_time_end - i_time_start))
In the case of Lua theoretically one could take great advantage of the use of local inside a loop, so I tried the benchmark with modifications to the loop:
for i_loop1=0,9 do
    for i_loop2=0,31999 do
        local l_i_counter = i_counter
        for i_loop3=0,31999 do
             l_i_counter = l_i_counter + 1
             if l_i_counter > 50 then
                 l_i_counter = 0
             end
        end
        i_counter = l_i_counter
    end
end
I ran it with LuaJit and saw no improvements on the performance.
Node.js
var s_date_time = new Date();
console.log('Starting: ' + s_date_time);

var i_counter = 0;

for (var $i_loop1 = 0; $i_loop1 < 10; $i_loop1++) {
   for (var $i_loop2 = 0; $i_loop2 < 32000; $i_loop2++) {
       for (var $i_loop3 = 0; $i_loop3 < 32000; $i_loop3++) {
           i_counter++;
           if (i_counter > 50) {
               i_counter = 0;
           }
       }
   }
}

var s_date_time_end = new Date();

console.log('Counter: ' + i_counter + '\n');

console.log('End: ' + s_date_time_end + '\n');
Execute with:
nodejs nested_loops.js
Phantomjs
The same code as nodejs adding to the end:
phantom.exit(0);
In the case of Phantom it performs the same in both versions 1.9.0 and 2.0.1-development compiled from sources.
PHP
The interesting thing on PHP is that you can write your own extensions in C, so you can have the easy of use of PHP and create functions that really brings fast performance in C, and invoke them from PHP.
from datetime import datetime
import time

print ("Starting at: " + str(datetime.now()))
s_unixtime_start = str(time.time())

i_counter = 0

# From 0 to 31999
for i_loop1 in range(0, 10):
    for i_loop2 in range(0,32000):
         for i_loop3 in range(0,32000):
             i_counter += 1
             if ( i_counter > 50 ) :
                 i_counter = 0

print ("Ending at: " + str(datetime.now()))
s_unixtime_end = str(time.time())

i_seconds = long(s_unixtime_end) - long(s_unixtime_start)
s_seconds = str(i_seconds)

print ("Total seconds:" + s_seconds)
Ruby
#!/usr/bin/ruby -w

time1 = Time.new

puts "Starting : " + time1.inspect

i_counter = 0;

for i_loop1 in 0..9
    for i_loop2 in 0..31999
        for i_loop3 in 0..31999
            i_counter = i_counter + 1
            if i_counter > 50
                i_counter = 0
            end
        end
    end
end

time1 = Time.new

puts "End : " + time1.inspect
Perl
The case of Perl was very interesting one.
This is the current code:
#!/usr/bin/env perl

print "$s_datetime Starting calculations...\n";
$i_counter=0;

$i_unixtime_start=time();

for my $i_loop1 (0 .. 9) {
    for my $i_loop2 (0 .. 31999) {
        for my $i_loop3 (0 .. 31999) {
            $i_counter++;
            if ($i_counter > 50) {
                $i_counter = 0;
            }
        }
    }
}

$i_unixtime_end=time();

$i_seconds=$i_unixtime_end-$i_unixtime_start;

print "Counter: $i_counter\n";
print "Total seconds: $i_seconds";
But before I created one, slightly different, with the for loops like in the C style:
I repeated this test, with the same version of Perl, due to the comment of a reader (thanks mpapec) that told:
“In this particular case perl style loops are about 45% faster than original code (v5.20)”
And effectively and surprisingly the time passed from 796 seconds to 436 seconds.
So graphics are updated to reflect the result of 436 seconds.
Bash
#!/bin/bash
echo "Bash version ${BASH_VERSION}..."
date

let "s_time_start=$(date +%s)"
let "i_counter=0"

for i_loop1 in {0..9}
do
     echo "."
     date
     for i_loop2 in {0..31999}
     do
         for i_loop3 in {0..31999}
         do
             ((i_counter++))
             if [[ $i_counter > 50 ]]
             then
                 let "i_counter=0"
             fi
         done
#((var+=1))
#((var=var+1))
#((var++))
#let "var=var+1"
#let "var+=1"
#let "var++"
     done
done

let "s_time_end=$(date +%2)"

let "s_seconds = s_time_end - s_time_start"
echo "Total seconds: $s_seconds"

# Just in case it overflows
date
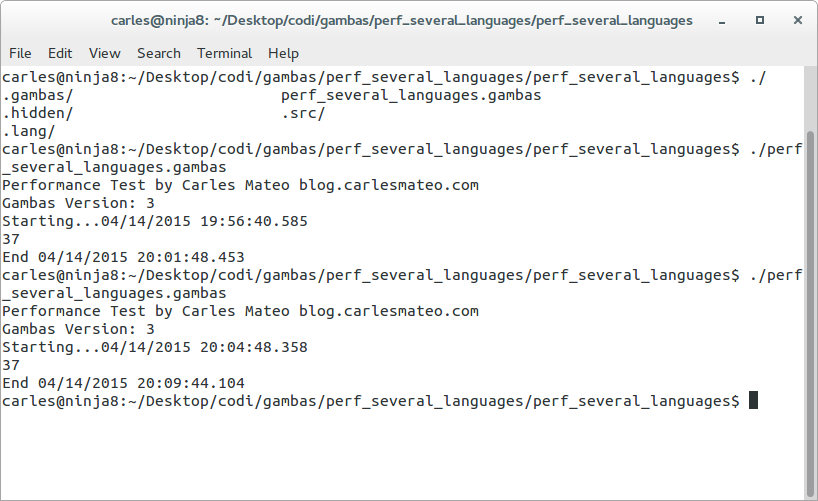
Gambas 3
Gambas is a language and an IDE to create GUI applications for Linux.
It is very similar to Visual Basic, but better, and it is not a clone.
I created a command line application and it performed better than PHP. There has been done an excellent job with the compiler.
Note: in the screenshot the first test ran for few seconds more than in the second. This was because I deliberately put the machine under some load and I/O during the tests. The valid value for the test, confirmed with more iterations is the second one, done under the same conditions (no load) than the previous tests.
' Gambas module file MMain.module

Public Sub Main()

    ' @author Carles Mateo http://blog.carlesmateo.com

    Dim i_loop1 As Integer
    Dim i_loop2 As Integer
    Dim i_loop3 As Integer
    Dim i_counter As Integer
    Dim s_version As String

    i_loop1 = 0
    i_loop2 = 0
    i_loop3 = 0
    i_counter = 0

    s_version = System.Version

    Print "Performance Test by Carles Mateo blog.carlesmateo.com"
    Print "Gambas Version: " & s_version

    Print "Starting..." & Now()

    For i_loop1 = 0 To 9
        For i_loop2 = 0 To 31999
            For i_loop3 = 0 To 31999
                i_counter = i_counter + 1

                If (i_counter > 50) Then
                    i_counter = 0
                Endif
            Next
        Next
    Next

    Print i_counter
    Print "End " & Now()

End
Changelog
2015-08-26 15:45
Thanks to the comment of a reader, thanks Daniel, pointing a mistake. The phrase I mentioned was on conclusions, point 14, and was inaccurate. The original phrase told “go is promising. Similar to C, but performance is much better thanks to the use of JIT“. The allusion to JIT is incorrect and has been replaced by this: “thanks to deciding at runtime if the architecture of the computer is 32 or 64 bit, a very quick compilation at launch time, and it compiling to very good assembler (that uses the 64 bit instructions efficiently, for example)”
2015-07-17 17:46
Benchmarked Facebook HHVM 3.9 (dev., the release date is August 3 2015) and HHVM 3.7.3, they take 52 seconds.
Re-benchmarked Facebook HHVM 3.4, before it was 72 seconds, it takes now 38 seconds. I checked the screen captures from 2014 to discard an human error. Looks like a turbo frequency issue on the tests computer, with the CPU governor making it work bellow the optimal speed or a CPU-hungry/IO process that triggered during the tests and I didn’t detect it. Thinking about forcing a fixed CPU speed for all the cores for the tests, like 2.4 Ghz and booting a live only text system without disk access and network to prevent Ubuntu launching processes in the background.
2015-07-05 13:16
Added performance of Phantomjs 1.9.0 installed via apt-get install phantomjs in Ubuntu, and Phantomjs 2.0.1-development.
Added performance of nodejs 0.12.04 (compiled).
Added bash to the graphic. It has so bad performance that I had to edit the graphic to fit in (color pink) in order prevent breaking the scale.
2015-07-03 18:32
Added benchmarks for PHP 7 alpha 2, PHP 5.6.10 and PHP 5.4.42.
2015-07-03 15:13
Thanks to the contribution of a reader (thanks mpapec!) I tried with Perl for style, resulting in passing from 796 seconds to 436 seconds.
(I used the same Perl version: Perl 5.18.2)
Updated test value for Perl.
Added new graphics showing the updated value.
Thanks to the contribution of a reader (thanks junk0xc0de!) added some additional warnings and explanations about the dangers of using -O3 (and -O2) if C/C++.
Updated the Lua code, to print i_counter and do the if i_counter > 50
This makes it take a bit longer, few cents, but passing from 7.8 to 8.2 seconds.
Updated graphics.
This year I was invited to speak at the PHP Conference at Berlin 2014.
It was really nice, but I had to decline as I was working hard in a Start up, and I hadn’t the required time in order to prepare the nice conference I wanted and that people deserves.
However, having time, I decided to write an article about what I would had speak at the conference.
I will cover improving performance in a single server, and Scaling out multi-Server architecture, focusing on the needs of growing and Start up projects. Many of those techniques can be used to improve performance with other languages, not just with PHP.
Many of my friends are very good Developing, but know nothing about Architecture and Scaling. Hope this approach the two worlds, Development ad Operatings, into a DevOps bridge.
Improving performance on a single server
Hosting
Choose a good hosting. And if you can afford it choose a dedicated server.
Shared hostings are really bad. Some of them kill your http and mysql instances if you reach certain CPU use (really few), while others share the same hardware between 100+ users serving your pages sloooooow. Others cap the amount of queries that your MySql will handle per hour at so ridiculous few amount that even Drupal or WordPress are unable to complete a request in development.
Other ISP (Internet Service Providers) have poor Internet bandwidth, and so you web will load slow to users.
Some companies invest hundreds of thousands in developing a web, and then spend 20 € a year in the hosting. Less than the cost of a dinner.
You can use a decent dedicated server from 50 to 99 €/month and you will celebrate this decision every day.
Take in count that virtualization wastes between 20% and 30% of the CPU power. And if there are several virtual machines the loss will be more because you loss the benefits of the CPU caching for optimizing parallel instructions execution and prediction. Also if the hypervisor host allows to allocate more RAM than physically available and at some point it swaps, the performance of all the VM’s will be much worst.
If you have a VM and it swaps, in most providers the swap goes over the network so there is an additional bottleneck and performance penalty.
To compare the performance of dedicated servers and instances from different Cloud Providers you can take a look at my project cmips.net
Improve your Server
If your Sever has few RAM, add more. And if your project is running slow and you can afford a better Server, do it.
Using SSD disk will incredibly improve the performance on I/O operations and on swap operations. (but please, do backups and keep them in another place)
If you use a CMS like ezpublish with http_cache enabled probably you will prefer to have a Server with faster cores, rather tan a Server with one or more CPU’s plenty of cores, but slower cores, and that last for a longer time to render the page to the http cache.
That may seem obvious but often companies invest 320 hours in optimizing the code 2%, at a cost of let’s say 50 €/h * 320 hours = 16.000 €, while hiring a better Server would had bring between a 20% to 1000% improvement at a cost of additional 50€/month only or at the cost of 100 € of increasing the RAM memory.
The point here is that the hardware is cheap, while the time of the Engineers is expensive. And good Engineers are really hard to find.
And you probably, as a CEO or PO, prefer to use the talent to warranty a nice time to market for your project, or adding more features, rather than wasting this time in refactorizing.
Even with the most optimal code in the universe, if your project is successful at certain point you’ll have to scale. So adding more Servers. To save a Server now at the cost of slowing the business has not any sense.
Upgrade you PHP version
Many projects still use PHP 5.3, and 5.4.
Latest versions of PHP bring more and more performance. If you use old versions of PHP you can have a Quick Win by just upgrading to the last PHP version.
Use OpCache (or other cache accelerator)
OpCache is shipped with PHP 5.5 by default now, so it is the recommended option. It is though to substitute APC.
To activate OpCache edit php.ini and add:
Linux/Unix:
zend_extension=/path/to/opcache.so
Windows:
zend_extension=C:\path\to\php_opcache.dll
It will greatly improve your PHP performance.
Ensure that OpCache in Production has the optimal config for Production, that will be different from Development Environment.
Note: If you plan to use it with XDebug in Development environments, load OpCache before XDebug.
Disable Profiling and xdebug in Production
In Production disable the profiling, xdebug, and if you use a Framework ensure the Development/Debug features are disabled in Production.
Ensure your logs are not full of warnings
Check that Production logs are not full of warnings.
I’ve seen systems were every seconds 200 warnings were written to logs, the same all the time, and that obviously was slowing down the system.
Typical warnings like this can be easily fixed:
Message: date() [function.date]: It is not safe to rely on the system’s timezone settings. You are required to use the date.timezone setting or the date_default_timezone_set() function. In case you used any of those methods and you are still getting this warning, you most likely misspelled the timezone identifier. We selected ‘UTC’ for ‘8.0/no DST’ instead
Profile in Development
To detect where your slow code is, profile it in Development to see where it is spent the most CPU/time.
Check the slow-queries if you use MySql.
Cache html to disk
Imagine you have a sort of craigslist and you are displaying all the categories, and the number of new messages in this landing page. To do that you are performing many queries to the database, SELECT COUNTs, etc… every time a user visits your page. That certainly will overload your database with actually few concurrent visitors.
Instead of querying the Database all the time, do cache the generated page for a while.
This can be achieved by checking if the cache html file exists, and checking the TTL, and generating a new page if needed.
A simple sample would be:
<?php
    // Cache pages for 5 minutes
    $i_cache_TTL = 300;

    $b_generate_cache = false;


    $s_cache_file = '/tmp/index.cache.html';


    if (file_exists($s_cache_file)) {
        // Get creation date
        $i_file_timestamp = filemtime($s_cache_file);
        $i_time_now = microtime(true);
        if ($i_time_now > ($i_file_timestamp + $i_cache_TTL)) {
            $b_generate_cache = true;
        } else {
            // Up to date, get from the disk
            $o_fh = fopen($s_cache_file, "rb");
            $s_html = stream_get_contents($o_fh);
            fclose($o_fh);

            // If the file was empty something went wrong (disk full?), so don't use it
            if (strlen($s_html) == 0) {
                $b_generate_cache = true;
            } else {
                // Print the page and exit
                echo $s_html;
                exit();
            }
        }
    } else {
        $b_generate_cache = true;
    }

    ob_start();

    // Render your page normally here
    // ....

    $s_html = ob_get_clean();

    if ($b_generate_cache == true) {
        // Create the file with fresh contents
        $o_fp = fopen($s_cache_file, 'w');
        if (fwrite($o_fp, $s_html) === false) {
            // Error. Impossible to write to disk
            // throw new Exception('CacheCantWrite');
        }
        fclose($o_fp);
    }

    // Send the page to the browser
    echo $s_html;
This sample is simple, and works for many cases, but presents problems.
Imagine for example that the page takes 5 seconds to be generated with a single request, and you have high traffic in that page, let’s say 500 requests per second.
What will happen when the cache expires is that the first user will trigger the cache generation, and the second, and the third…. so all of the 500 requests * 5 seconds will be hitting the database to generate the cache, but… if creating the page per one requests takes 5 seconds, doing this 2,500 times will not last 5 seconds… so your process will enter in a vicious state where the first queries have not ended after minutes, and more and more queries are being added to the queue until:
a) Apache runs out of childs/processes, per configuration
b) Mysql runs out of connections, per configuration
c) Linux runs out of memory, and processes crashes/are killed
Not to mention the users or the API client, waiting infinitely for the http request to complete, and other processes reading a partial file (size bigger than 0 but incomplete).
Different strategies can be used to prevent that, like:
a) using semaphores to lock access to the cache generation (only one process at time)
b) using a .lock file to indicate that the file is being generated, and so next requests serving from the cache until the cache generation process ends the task, also writing to a buffer like acachefile.buffer (to prevent incomplete content being read) and finally when is complete renaming to the final name and removing the .lock
c) using memcached, or similar, to keep an index in memory of what pages are being generated now, and why not, keeping the cached files there instead of a filesystem
d) using crons to generate the cache files, so they run hourly and you ensure only one process generates the cache files
If you use crons, a cheap way to generate the .html content is that the crons curls/wget your webpage. I don’t recommend this as has some problems, like if that web request fails for any reason, you’ll have cached an error instead of content.
I prefer preparing my projects to being able of rendering the content being invoked from HTTP/S or from command line. But if you use curl because is cheap and easy and time to market is important for your project, then be sure that you check that your backend code writes an Status OK in the HTML that the cron can check to ensure that the content has been properly generated. (some crons only check for http status, like 200, but if your database or a xml gateway you use fails you will likely get a 200 and won’t detect that you’re caching pages with “error I can’t connect to the database” instead)
Many Frameworks have their own cache implementation that prevent corruption that could come by several processes writing to the same file at the same time, or from PHP dying in the middle of the render.
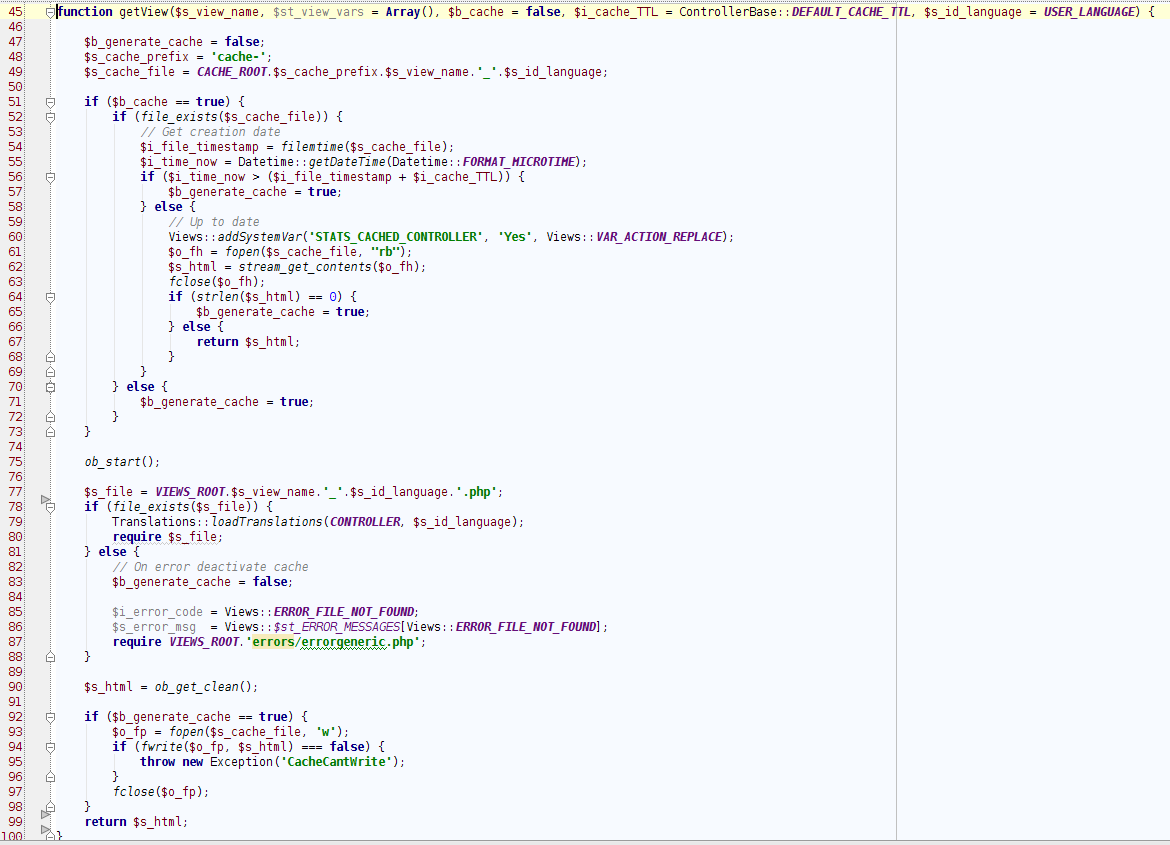
You can see a more complex MVC implementation, with Views, from my Framework Catalonia here:
By serving .html files instead of executing PHP with logic and performing queries to the database you will be able to serve hundreds of thousands requests per day with a single machine and really fast -that’s important for SEO also-.
I’ve done this in several Start ups with wonderful results, and my Framework Catalonia also incorporates this functionality very easily to use.
Note: This is only one of the techniques to save the load of the Database Servers. Many more come later.
Cache languages to disk
If you have an application that is multi-language, or if your point for the Strings (sections, pages, campaigns..) to be edited by Marketing is the Database, there is no need to query it all the time.
Simply provide a tool to “generate language files”.
Your languages files can be Javascript files loaded by the page, or can be PHP files generated.
For example, the file common_footer_en.php could be generated reading from Database and be like that:
<php
/* Autogenerated English translations file common_footer_en.php
   on 2014-08-10 02:22 from the database */
$st_translations['seconds']                = 'seconds';
$st_translations['Time']                   = 'Time';
$st_translations['Vars used']              = 'Vars used in these templates';
$st_translations['Total Var replacements'] = 'Total replaced';
$st_translations['Exec time']              = 'Execution time';
$st_translations['Cached controller']      = 'Cached controller';
So the PHP file is going to be generated when someone at your organization updates the languages, and your code is including it normally like with any other PHP file.
Use the Crons
You can set cron jobs to do many operations, like map reduce, counting in the database or effectively deleting the data that the user selected to delete.
Imagine that you have classified portal, and you want to display the number of announces for that category. You can have a table NUM_ANNOUNCES to store the number of announces, and update it hourly. Then your database will only do the counting once per hour, and your application will be reading the number from the table NUM_ANNOUNCES.
The Cron can also be used to make expire old announces. That way you can avoid a user having to wait for that clean up taking process when you have a http request to PHP.
A cron file can be invoked by:
php -f cron.php
By:
./cron.php
If you give permissions of execution with chmod +x and set the first line in cron.php as:
#!/usr/bin/env php
Or you can do a trick, that is emulate a http request from bash, by invoking a url with curl or with wget. Set the .htaccess so the folder for the cron tasks can only be executed from localhost for adding security.
This last trick has the inconvenient that the calling has the same problems as any http requests: restarting Apache will kill the process, the connection can be closed by timed out (e.g. if process is taking more seconds than the max. execution time, etc…)
Use Ramdisk for PHP files
With Linux is very easy to setup a RamDisk.
You can setup a RamDisk and rsync all your web .PHP files at system boot time, and when deploying changes, and config Apache to use the Ramdisk folder for the website.
That way for every request to the web, PHP files will be served from RAM directly, saving the slow disk access. Even with OpCache active, is a great improvement.
At these times were one Gigabyte of memory is really cheap there is a huge difference from reading files from disk, and getting them from memory. (Reading and writing to RAM memory is many many many times faster than magnetic disks, and many times faster than SSD disks)
Also .js, .css, images… can be served from a Ram disk folder, depending on how big your web is.
Ramdisk for /tmp
If your project does operations on disk, like resizing images, compressing files, reading/writing large CSV files, etcetera you can greatly improve the performance by setting the /tmp folder to a Ramdisk.
If your PHP project receives file uploads they will also benefit (a bit) from storing the temporal files to RAM instead to the disk.
Use Cache Lite
Cache Lite is a Pear extension that allows you to keep data in a local cache of the Web Server.
You can cache .html pages, or you can cache Queries and their result.
<?php
require_once "Cache/Lite.php";

$options = array(
    'cacheDir' => '/tmp/',
    'lifeTime' => 7200,
    'pearErrorMode' => CACHE_LITE_ERROR_DIE
);
$cache = new Cache_Lite($options);

if ($data = $cache->get('id_of_the_page')) {

    // Cache hit !
    // Content is in $data
    echo $data;

} else {

    // No valid cache found (you have to make and save the page)
    $data = '<html><head><title>test</title></head><body><p>this is a test</p></body></html>';
    echo $data;
    $cache->save($data);

}
It is nice that Cache Lite handles the TTL and keeps the info stored in different sub-directories in order to keep a decent performance. (As you may know many files in the same directory slows the access much).
Use HHVM (HipHop Virtual Machine) from Facebook
Facebook Engineers are always trying to optimize what is run on the Servers.
Faster code means, less machines. Even 1% of CPU use improvement means a lot of Servers less. Less Servers to maintain, less money wasted, less space on the Data Centers…
So they created the HHVM HipHop Virtual Machine that is able to run PHP code, much much faster than PHP. And is compatible with most of the Frameworks and Open Source projects.
They also created the Hack language that is an improved PHP, with type hinting.
So you can use HHVM to make your code run faster with the same Server and without investing a single penny.
Use C extensions
You can create and use your own C extensions.
C extensions will bring really fast execution. Just to get the idea:
I built a PHP extension to compare the performance from calculating the Bernoulli number with PHP and with the .so extension created in C.
In my Core i7 times were:
PHP:
Computed in 13.872583150864 s
PHP calling the C compiled extension:
Computed in 0.038495063781738 s
That’s 360.37 times faster using the C extension. Not bad.
Use Zephir
Zephir is a an Open Source language, very similar to PHP, that allows to create and maintain easily extensions for PHP.
Use Phalcon
Phalcon is a Web MVC Framework implemented as C extension, so it offers a high performance.
Check if you’re using the correct Engine for MySql
Many Developers create the tables and never worry about that. And many are using MyIsam by default. It was the by default Engine prior to MySql 5.5.
While MyIsam can bring good performance in some certain cases, my recommendation is to use InnoDb.
Normally you’ll have a gain in performance with MyIsam if you’ve a table were you only write or only read, but in all the other cases InnoDb is expected to be much more performant and safe.
MyIsam tables also get corruption from time to time and need manually fixing and writing to disks are not so reliable than InnoDb.
As MyIsam uses table-locking for updates and deletes to any existing row, it is easy to see that if you’re in a web environment with multiple users, blocking the table -so the other operations have to wait- will make things be slow.
If you have to use Joins clearly you will benefit from using InnoDb also.
Use InMemory Engine from MySql
MySql has a very powerful Engine called InMemory.
The InMemory Engine will store things in RAM and loss the data when MySql is restarted.
However is very fast and very easy to use.
Imagine that you have a travel application that constantly looks at which country belongs the city specified by user. A Quickwin would be to INSERT all this data in the InMemory Engine of MySql when it is started, and do just one change in your code: to use that Table.
Really easy. Quick improvement.
Use curl asynchronously
If your PHP has to communicate with other systems using curl, you can do the http/s call, and instead of waiting for a response let your PHP do more things in the meantime, and then check the results.
You can also call to multiple curl calls in parallel, and so avoid doing one by one in serial.
Guess that you have a query that returns 1000 results. Then you add one by one to an array.
Probably you’re going to have substantial gain if you keep in the database a single row, with the array serialized.
So an array like:
$st_places = Array(‘Barcelona’, ‘Dublin’, ‘Edinburgh’, ‘San Francisco’, ‘London’, ‘Berlin’, ‘Andorra la Vella’, ‘Prats de Lluçanès’);
Would be serialized to an string like:
a:8:{i:0;s:9:”Barcelona”;i:1;s:6:”Dublin”;i:2;s:9:”Edinburgh”;i:3;s:13:”San Francisco”;i:4;s:6:”London”;i:5;s:6:”Berlin”;i:6;s:16:”Andorra la Vella”;i:7;s:19:”Prats de Lluçanès”;}
This can be easily stored as String and unserialized later back to an array.
Note: In Internet we have a lot of encodings, Hebrew, Japanese… languages. Be careful with encodings when serializing, using JSon, XML, storing in databases without UTF support, etc…
Use Memcached to store common things
Memcached is a NoSql database in memory that can run in cluster.
The idea is to keep things there, in order to offload the load of the database. And as everything is in RAM it really runs fast.
You can use Memcached to cache Queries and their results also.
For example:
You have query SELECT * FROM translations WHERE section=’MAIN’.
Then you look if that String exists as key in the Memcached, and if it exists you fetch the results (that are serialized) and you avoid the query. If it doesn’t exist, you do normally the query to the database, serialize the array and store it in the Memcached with a TTL (Time to Live) using the Query (String) as primary key. For security you may prefer to hash the query with MD5 or SHA-1 and use the hash as key instead of using it plain.
When the TTL is reached the validity of the data would have expired and so it’s time to reinsert the contents in the next query.
Be careful, I’ve seen projects that were caching private data from users without isolating the key properly, so other users were getting the info from other users.
For example, if the key used was ‘Name’ and the value ‘Carles Mateo’ obviously the next user that fetch the key ‘Name’ would get my name and not theirs.
If you store private data of users in Memcache, it is a nice idea to append the owner of that info to the hash. E.g. using key: 10701577-FFADCEDBCCDFFFA10C
Where ‘10701577’ would be the user_id of the owner of the info, and ‘FFADCEDBCCDFFFA10C’ a hash of the query.
Before I suggested that you can keep a table of counting for the announces in a classified portal. This number can be stored in the Memcached instead.
You can store also common things, like translations, or cities like in the example before, rate of change for a currency exchanging website…
The most common way to store things there is serialized or Json encoded.
Be aware of the memory limits of Memcached and contrl the cache hitting ratio to avoid inserting data, and losing it constantly because is used few and Memcached has few memory.
Use jQuery for Production (small file) and minimized files for js
Use the Production jQuery library in Production, I mean do not use the bigger file Development jQuery library for Production.
There are product that eliminate all the necessary spaces in .js and .css files, and so are served much faster. These process is called minify.
It is important to know that in many emerging markets in the world, like Brazil, they have slow DSL lines. Many 512 Kbit/secons, and even modem connections!.
Activate compression in the Server
If you send large text files, or Jsons, you’ll benefit from activating the compression at the Server.
It consumes some CPU, but many times it brings an important improvement in speed serving the pages to the users.
Use a CDN
You can use a Content Delivery Network to offload your Servers from sending plain texts, html, images, videos, js, css…
You can delegate this to the CDN, they have very speedy Internet lines and Servers, so your Servers can concentrate into doing only BackEnd operations.
Please take attention to the documentation, a common mistake is to send Cache Headers to the CDN servers, while they’ll use this headers to set the cache TTL and ignore their web configuration parameters. (For example s-maxage, like: Cache-Control: public, s-maxage=600)
You can take a look at any website by telneting to the port 80 and doing the request manually or easily by using lynx:
lynx -mime_header http://blog.carlesmateo.com | less
Do you need a Framework?
If you’re processing only BackEnd petitions, like in the video games industry, serving API’s, RESTful, etc… you probably don’t need a Framework.
The Frameworks are generic and use much more resources than you’re really need for a fast reply.
Many times using a heavy Framework has a cost of factor times, compared to use simply PHP.
Save database connections until really needed
Many Frameworks create a connection to the Database Server by default. But certain parts of your code application do not require to connect to the database.
For example, validating the data from a form. If there are missing fields, the PHP will not operate with the Database, just return an error via JSon or refreshing the page, informing that the required field is missing.
If a not logged user is requesting the dashboard page, there is no need to open a connection to the database (unless you want to write the access try to an error log in the database).
In fact opening connections by default makes easier for attackers to do DoS attacks.
With a Singleton pattern you can easily implement a Db class that handles this transparently for you.
Scaling out / Multi Server Environment
Memcached session
When you have several Web Servers you’ll need something more flexible than the default PHP handler (that stores to a file in the Web Server).
The most common is to store the Session, serialized, in a Memcached Cluster.
Use Cassandra
Apache Cassandra is a NoSql database that allows to Scale out very easily.
The main advantage is that scales linearly. If you have 4 nodes and add 4 more, your performance will be doubled. It has no single point of failure, is also resilient to node failures, it replicates the data among the nodes, splits the load over the nodes automatically and support distributed datacenter architectures.
A easy way to split the load is to have a MySql primary Server, that handles the writes, and MySql secondary (or Slave) Servers handling the reads.
Every write sent to the Master is replicated into the Slaves. Then your application reads from the slaves.
You have to tell your code to do the writes to database to the primary Server, and the reads to the secondaries. You can have a Load Balancer so your code always ask the Load Balancer for the reads and it makes the connection to the less used server.
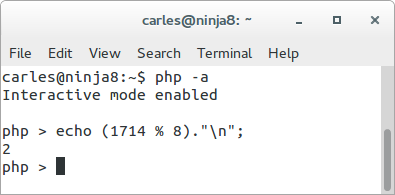
Do Database sharding
To shard the data consist into splitting the data according to a criteria.
For example, imagine we have 8 MySql Servers, named mysql0 to mysql7. If we want to insert or read data for user 1714, then the Server will be chosen from dividing the user_id, so 1714, between the number of Servers, and getting the MOD.
So 1714 % 8 gives 2. This means that the MySql Server to use is the mysql2.
For the user_id 16: 16 & 8 gives 0, so we would use mysql0. And so.
You can shard according to the email, or other fields as well. And you can have the same master and secondaries for the shards also.
When doing sharding in MySql you cannot do joins to data in other Servers. (but you can replicate all the data from the several shards in one big server in house, in your offices, and so query it and join if you need that for marketing purposes).
I always use my own sharding, but there is a very nice product from CodeFutures called dbshards. It handles the traffics transparently. I used it when in a video games Start up with very satisfying result.
Use Cassandra assync queries
Cassandra support asynchronous queries. That means you can send the query to the Server, and instead of waiting, do other jobs. And check for the result later, when is finished.
Consider using Hadoop + HBASE
A Cluster alternative to Cassandra.
Use a Load Balancer
You can put a Load Balancer or a Reverse Proxy in front of your Web Servers. The Load Balancer knows the state of the Web Servers, so it will remove a Web Server from the Array if it stops responding and everything will continue being served to the users transparently.
There are many ways to do Load Balancing: Round Robin, based on the load on the Web Servers, on the number of connections to each Web Server, by cookie…
To use a Cookie based Load Balancer is a very easy way to split the load for WordPress and Drupal Servers.
Imagine you have 10 Web Servers. In the .htaccess they set a rule to set a Cookie like:
SERVER_ID=WEB01
That was in the case of the first Web Server.
Second Server would have in the .htaccess to set a Cookie like:
SERVER_ID=WEB02
Etcetera
When for first time an user connects to the Load Balancer it sends the user to one of the 10 Web Servers. Then the Web Server sends its cookie to the browser of the Client. E.g. WEB07
After that, in the next requests from the client it will be redirected to the server by the Load Balancer to the Server that set the Cookie, so in this example WEB07.
The nice thing of this way of splitting the traffic is that you don’t have to change your code, nor handling the Sessions different.
If you use two Load Balancers you can have a heartbeat process in them and a Virtual Ip, and so in case your main Load Balancer become irresponsible the Virtual Ip will be mapping to the second Load Balancer in milliseconds. That provides HA.
Use http accelerators
Nginx, varnish, squid… to serve static content and offload the PHP Web Servers.
Auto-Scale in the Cloud
If you use the Cloud you can easily set Auto-Scaling for different parts of your core.
A quick win is to Scale the Web Servers.
As in the Cloud you pay per hour using a computer, you will benefit from cost reduction in you stop using the servers when you don’t need them, and you add more Servers when more users are coming to your sites.
Video game companies are a good example of hours of plenty use and valleys with few users, although as users come from all the planet it is most and most diluted.
Actually the Performance of the Google Cloud to Scale without any precedent is great.
Opposite to other Clouds that are based on instances, Google Cloud offers the platform, that will spawn your code across so many servers as needed, transparently to you. It’s a black box.
Schedule operations with RabbitMQ
Or other Queue Manager.
The idea is to send the jobs to the Queue Manager, the PHP will continue working, and the jobs will be performed asynchronously and notify the end.
RabbitMQ is cool also because it can work in cluster and HA.
Use GlusterFs for NAS
GlusterFs (and other products) allow you to have a Distributed File System, that splits the load and the data across the Servers, and resist node failures.
If you have to have a shared folder for the user’s uploads, for example for the profile pictures, to have the PHP and general files locally in the Servers and the Shared folder in a GlusterFs is a nice option.
Avoid NFS for PHP files and config files
As told before try to have the PHP files in a RAM disk, or in the local disk (Linux caches well and also OpCache), and try to not write code that reads files from disk for determining config setup.
I remember a Start up incubator that had a very nice Server, but the PHP files were read from a mounted NFS folder.
That meant that on every request, the Server had to go over the network to fetch the files.
Sadly for the project’s performance the PHP was reading a file called ENVIRONMENT that contained “PROD” or “DEVEL”. And this was done in every single request.
Even worst, I discovered that the switch connecting the Web Server and the NFS Server was a cheap 10 Mbit one. So all the traffic was going at 10 Mbit/s. Nice bottleneck.
Improve your network architecture
You can use 10 GbE (10 Gigabit Ethernet) to connect the Servers. The Web Servers to the Databases, Memcached Cluster, Load Balancers, Storage, etc…
You will need 10 GbE cards and 10 GbE switchs supporting bonding.
Use bonding to aggregate 10 + 10 so having 20 Gigabit.
You can also use Fibre Channel, for example 10 Gb and aggregate them, like 10 + 10 so 20 Gbit for the connection between the Servers and the Storage.
The performance improvements that your infrastructure will experiment are amazing.
When I first tried some years ago Amazon t1.micro Free Tier, I was really disappointed.
I moved one of my blogs there, from a vmware instance that I was running in a physical server of my own, hosted at Colt Telecom, and my deception was huge.
That instance frozen often! According to Amazon EC2 web it was Ok, but it was totally KO. No ping, unable to log by ssh.
The only solution then was to shutdown the instance from the EC2 console, what it takes some time, because in fact, machine was down but the console didn’t know.
Once down, then start again. Reassign the static Ip address (Amazon calls it Elastic Ip).
And once or twice per week I had one of those frozen.
I tried to found a pattern of why instance freezes, but no luck. It simply happen.
I was about to leave Amazon forever when I decided to try the next instance size, just in case, the Small, and problems disappeared forever.
Now, that I have started my project CMIPS to measure and compare the Cloud performance (different providers and instance types), I see how bad it was t1.micro.
Even without the freezes, my not-so-modern ultra-portable laptop performs several times faster (x9.39 times faster), so any project hosted in a t1.micro will suffer a pathetic performance.
Later I discovered that sometimes the Amazon servers where your instances are running have a hardware problem or die. A reboot doesn’t help, since when you reboot, you don’t change the server that hosts your instance (guest).
Only poweroff makes Amazon to assign you another physical server.
And as later I learned, from time to time, no matter how good your instances are -but with expensive instances it happens much less-, without a reason one of your instances can freeze. So if your Startup has 30 instances, monitor them, because one can freeze some day. It just happens. I guess hardware crashes. And it could be one of the databases that gets knock down.
If you’re lucky you’ll have no corruption in the network storage, if not you will loss data. So backup.
It has occurred to me twice with my private instances in Amazon (not counting the nightmare t1.micro), but we suffered it from time to time when I worked for a videogames company where we had many always-on servers and where we were creating on the fly, scaling the number of instances, according to the increasingly or decreasingly number of users.
Note 2019-05-28:This article was written in 2013. It is still valid, but since then 10Gbps have dropped in price a lot. In my DRAID Solution I’ve qualified 10GbE based in copper, RJ45, and for fiber: 10, 25, 40 and 100 Gbps. Mellanox switches and NICs are a reference. 10GbE based in copper are cheap and easy to deploy, as you can reuse existing infrastructure and grow your segments. https://en.wikipedia.org/wiki/10_Gigabit_Ethernet
I’ve found this problem in several companies, and I’ve had to show their error and convince experienced SysAdmins, CTOs and CEO about the erroneous approach. Many of them made heavy investments in NAS, that they are really wasting, and offering very poor performance.
Normally the rack servers have their local disks, but for professional solutions, like virtual machines, blade servers, and hundreds of servers the local disk are not used.
NAS – Network Attached Storage- Servers are used instead.
This NAS Servers, when are powerful (and expensive) offer very interesting features like hot backups, hot backups that do not slow the system (the most advanced), hot disk replacement, hot increase of total available space, the Enterprise solutions can replicate and copy data from different NAS in different countries, etc…
Smaller NAS are also used in configurations like Webservers’ Webfarms, were all the nodes has to have the same information replicated, and when a used uploads a new profile image, has to be available to all the webservers for example.
In this configurations servers save and retrieve the needed data from the NAS Servers, through LAN (Local Area Network).
The main error I have seen is that no one ever considers the pipe where all the data is travelling, so most configurations are simply Gigabit, and so are bottleneck.
Imagine a Dell blade server, like this in the image on the left.
This enclosure hosts 16 servers, hot plugable, with up to two CPU’s each blade, we also call those blade servers “pizza” (like we call before to rack servers).
A common use is to use those servers to have Vmware, OpenStack, Xen or other virtualization software, so the servers run instances of customers. In this scenario the virtual disks (the hard disk of the virtual machines) are stored in the NAS Server.
So if a customer shutdown his virtual server, and start it later, the physical server where its virtual machine is running will be another, but the data (the disk of the virtual server) is stored in the NAS and all the data is saved and retrieved from the NAS.
The enclosure is connected to the NAS through a Gigabit connection, as 10 Gigabit connections are still too expensive and not yet supported in many servers.
Once we have explained that, imagine, those 16 servers, each with 4 or 5 virtual machines, accessing to their disks through a Gigabit connection.
If only one of these 80 virtual machines is accessing to disk, the will be no problem, but if more than one is accessing the Gigabit connection, that’s a maximum of 125 MB (Megabytes) per second, will be shared among all the virtual machines.
So imagine, 70 virtual machines are accessing NAS to serve web pages, with not much traffic, OK, but the other 10 virtual machines are doing heavy data transmission: for example one is serving data through FTP server, the other is broadcasting video, the other is copying heavy log files, and so… Imagine that scenario.
The 125 MB per second is divided between the 80 servers, so those 10 servers using extensively the disk will monopolize the bandwidth, but even those 10 servers will have around 12,5 MB each, that is 100 Mbit each and is very slow.
Imagine one of the virtual machines broadcast video. To broadcast video, first it has to get it from the NAS (the chunks of data), so this node serving video will be able to serve different videos to few customers, as the network will not provide more than 12,5 MB under the circumstances provided.
This is a simplified scenario, as many other things has to be taken in count, like the SATA, SCSI and SAS disks do not provide sustained speeds, speed depends on locating the info, fragmentation, etc… also has to be considered that NAS use protocol iSCSI, a sort of SCSI commands sent through the Ethernet. And Tcp/Ip uses verifications in their protocol, and protocol headers. That is also an overhead. I’ve considered only traffic in one direction, so the servers downloading from the NAS, as assuming Gigabit full duplex, so Gigabit for sending and Gigabit for receiving.
So instead of 125 MB per second we have available around 100 MB per second with a Gigabit or even less.
Also the virtualization servers try to handle a bit better the disk access, by keeping a cache in memory, and not writing immediately to disk.
So you can’t do dd tests in virtual machines like you would do in any Linux with local disks, and if you do go for big files, like 10 GB with random data (not just 0, they have optimizations for that).
Let’s recalculate it now:
70 virtual machines using as low as 0.10 MB/second each, that’s 7 MB/second. That’s really optimist as most webservers running PHP read many big files for attending a simple request and webservers server a lot of big images.
10 virtual machines using extensively the NAS, so sharing 100 MB – 7 MB = 93 MB. That is 9.3 MB each.
So under these circumstances for a virtual machine trying to read from disk a file of 1 GB (1000 MB), this operation will take 107 seconds, so 1:47 minutes.
So with this considerations in mind, you can imagine that the performance of the virtual machines under those configurations are leaved to the luck. The luck that nobody else of the other guests in the servers are abusing the disk I/O.
I’ve explained you in a theoretical plan. Sadly reality is worst. A lot worst. Those 70 web virtual machines with webservers will be so slow that they will leave your company very disappointed, and the other 10 will not even be happier.
One of the principal problems of Amazon EC2 has been always disk performance. Few months ago they released IOPS, high performance disks, that are more expensive, but faster.
It has to be recognized that in Amazon they are always improving.
They have also connection between your servers at 10 Gbit/second.
Returning to the Blades and NAS, an easy improvement is to aggregate two Gigabits, so creating a connection of 2 Gbit. This helps a bit. Is not the solution, but helps.
Probably different physical servers with few virtual machines and a dedicated 1 Gbit connection (or 2 Gbit by 1+1 aggregated if possible) to the NAS, and using local disks as much as possible would be much better (harder to maintain at big scale, but much much better performance).
But if you provide infrastructure as a Service (IaS) go with 2 x 10 Gbit Fibre aggregated, so 20 Gigabit, or better aggregate 2 x 20 Gbit Fibre. It’s expensive, but crucial.
Now compare the 9.3 MB per second, or even the 125 MB theoretical of Gigabit of the average real sequential read of 50 MB/second that a SATA disk can offer when connected on local, or nearly the double for modern SAS 15.000 rpm disks… (writing is always slower)
… and the 550 MB/s for reading and 550 MB/s for writing that some SSD disks offer when connected locally. (I own two OSZ SSD disks that performs 550 MB).
I’ve seen also better configuration for local disks, like a good disk controller with Raid 5 and disks SSD. With my dd tests I got more than 900 MB per second for writing!.
So if you are going to spend 30.000 € in your NAS with SATA disks (really bad solution as SATA is domestic technology not aimed to work 24×7 and not even fast) or SAS disks, and 30.000 € more in your blade servers, think very well what you need and what configuration you will use. Contact experts, but real experts, not supposedly real experts.
Otherwise you’ll waste your money and your customers will have very very poor performance on these times where applications on the Internet demand more and more performance.