This article covers the desperate situation where you had generated one or more instances, instructed Amazon to use a SSH Key Pair certs where only you have the Private Key, your instances are running, for example, an eCommerce site, running for months, and then you loss your Private Key (.pem file), and with it the SSH access to your instances’ Data.
Actually I’ve seen this situation happening several times, in actual companies. Mainly Start ups. And I solved it for them.
Assuming that you didn’t have a secondary method to access, which is another combination of username/password or other user/KeyPairs, and so you completely lost the access to the Database, the Webservers, etc… I’m going to show you how to recover the data.
For this article I will consider an scenario where there is only one Instance, which contains everything for your eCommerce: Webserver, code, and Database… and is a simple config, with a single persistent drive.
Warning: be very careful as if you use ephemeral drives, contents will be lost is you power off the instance.
Method 1: Quicker, launching a new instance from the previous
Step1: The first step you will take is to close the access from outside, using the Firewall, to avoid any new changes going to the disk. You can allow access to the instance only from your static Ip in the office/home.
Step 2: You’ll wait for 5 minutes to allow any transaction going on to conclude, and pending writes to be flushed to disk.
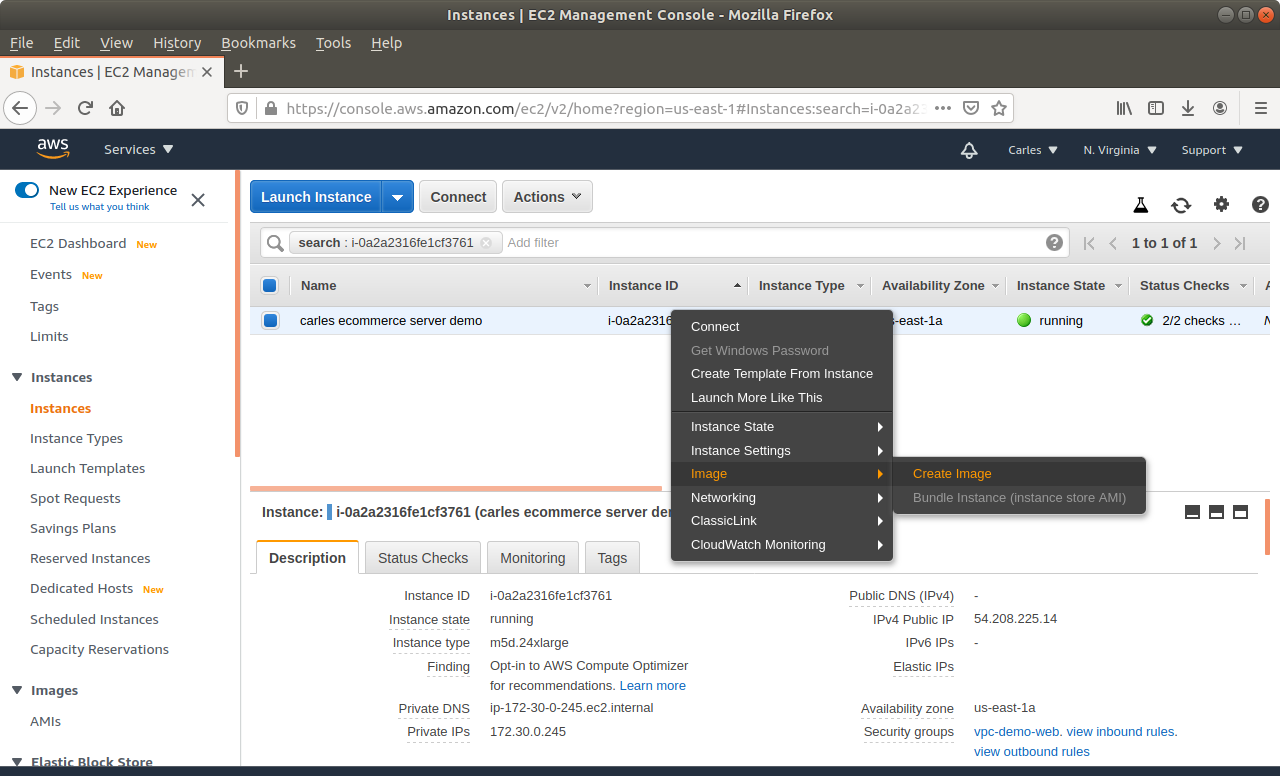
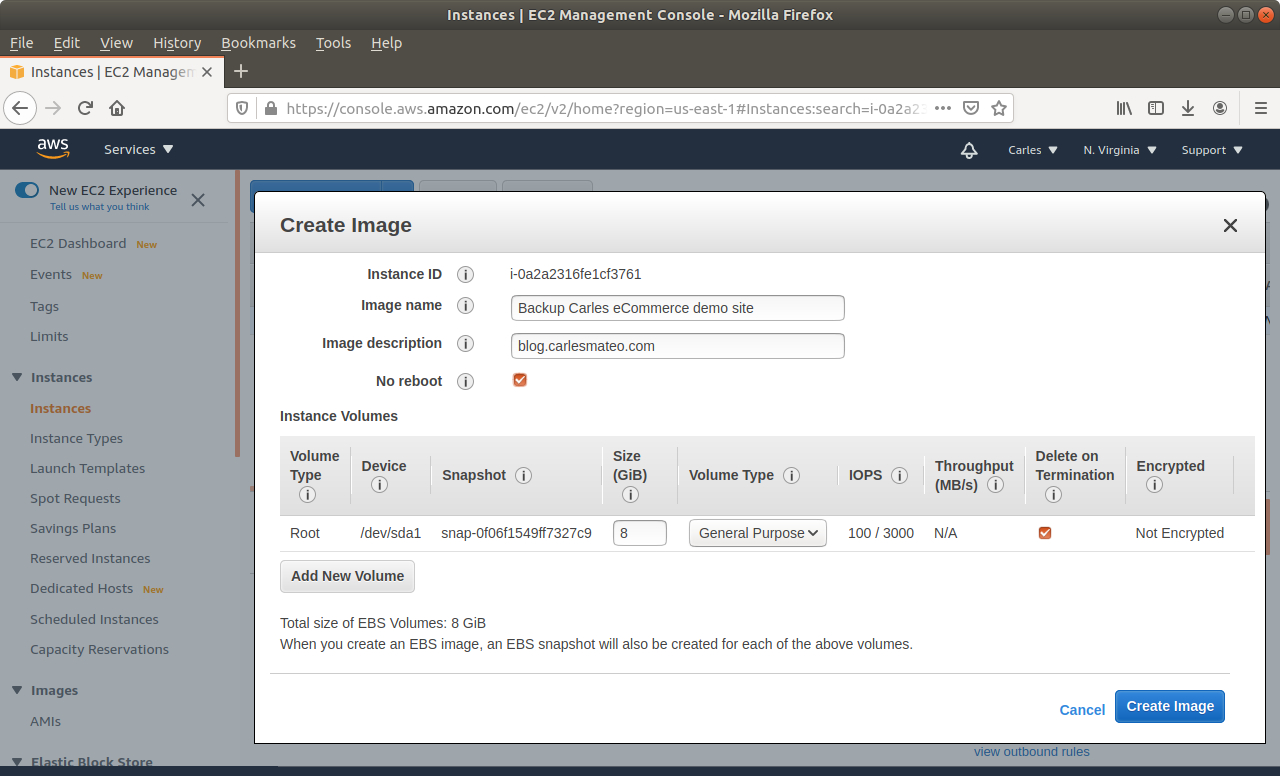
Step 3: From Amazon AWS Console, EC2, you’ll request an Snapshot. That step is to try to get extra security. Taking an Snapshot from a live, mounted, filesystem, is not the best of ideas, specially of a Database, but we are facing a desperate situation so we’re increasing the numbers of leaving this situation without Data loss. This is just for extra security and if everything goes well at the end you will not need this snapshot.
Make sure you select No reboot.
Step 4: Be very careful if you have extra drives and ephemeral drives.
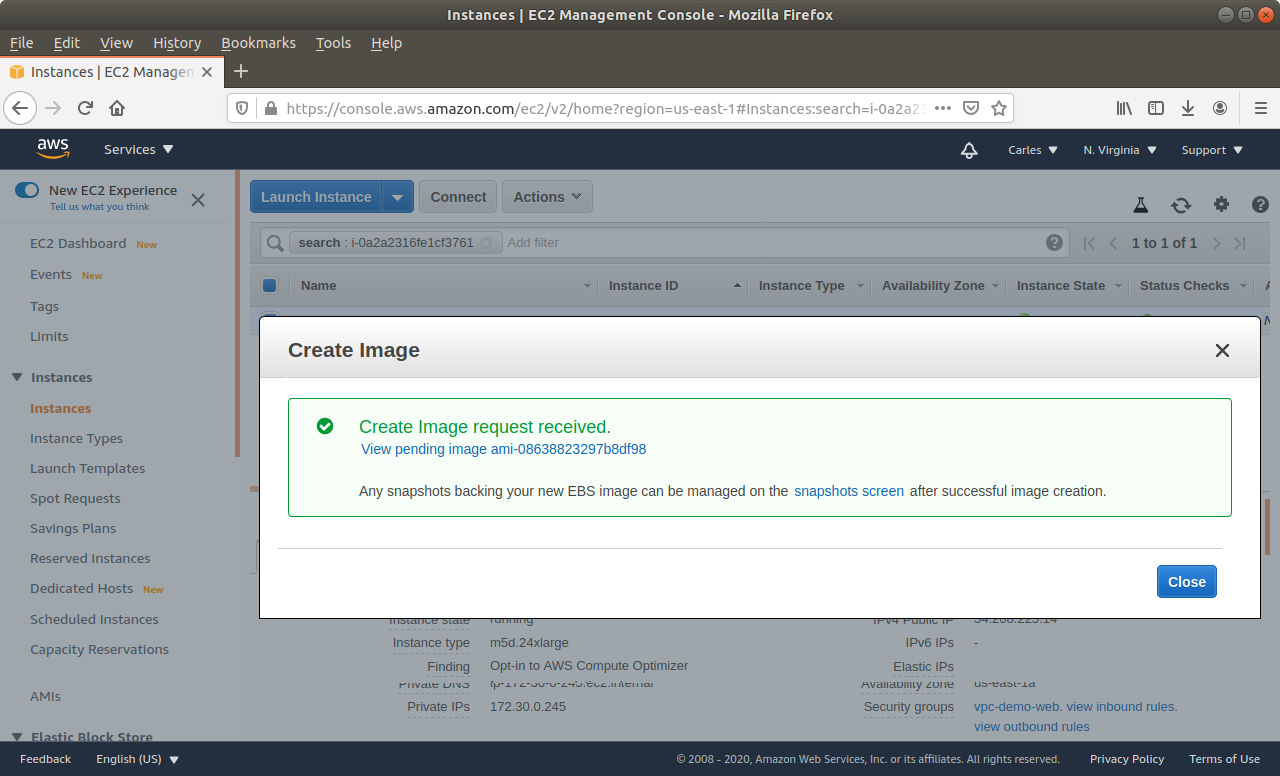
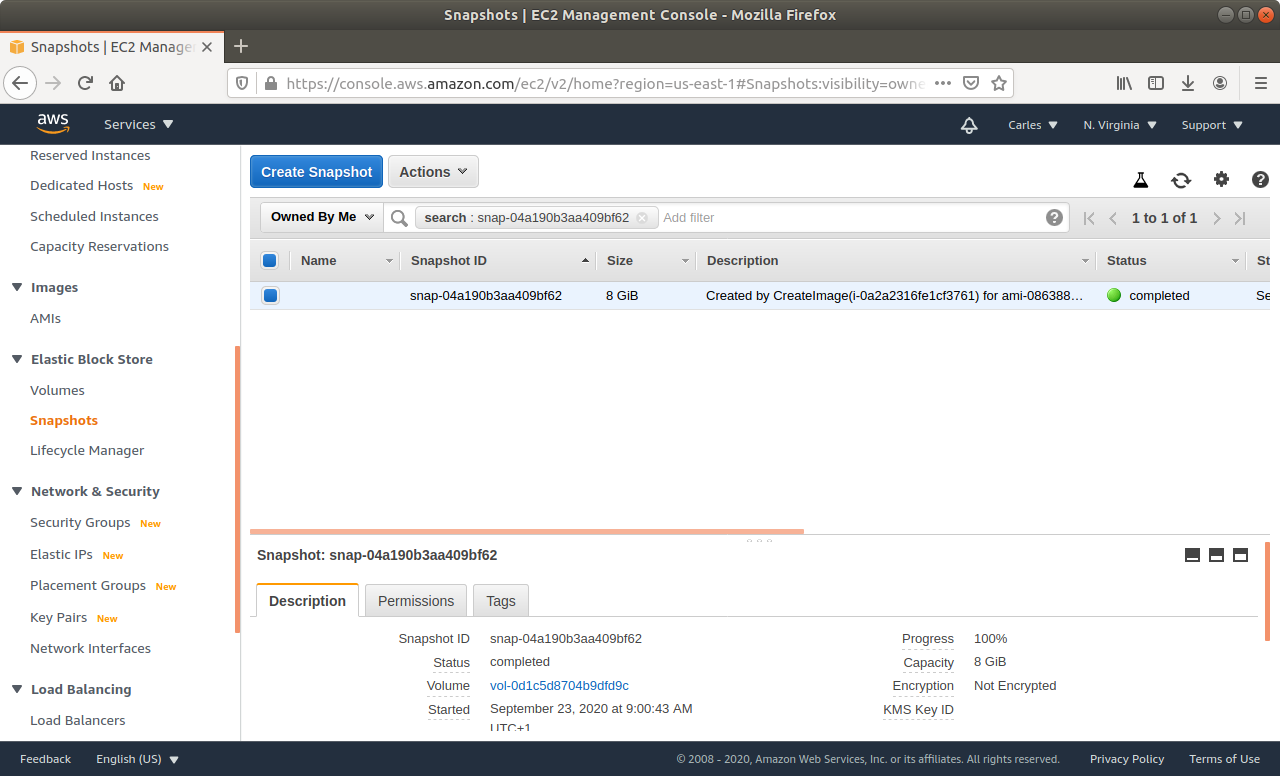
Step 5: Wait till the Snapshot completes.
Step 6: Then request a graceful poweroff. Amazon will try to poweroff the Server in a gentle way. This may take two minutes.
Step 7: When the instance is powered off, request a new Snapshot. This is the one we really want. The other was just to be more safe. If you feel confident you can just unclick No Reboot on the previous Step and do only one Snapshot.
Step 8: Wait till the Snapshot completes.
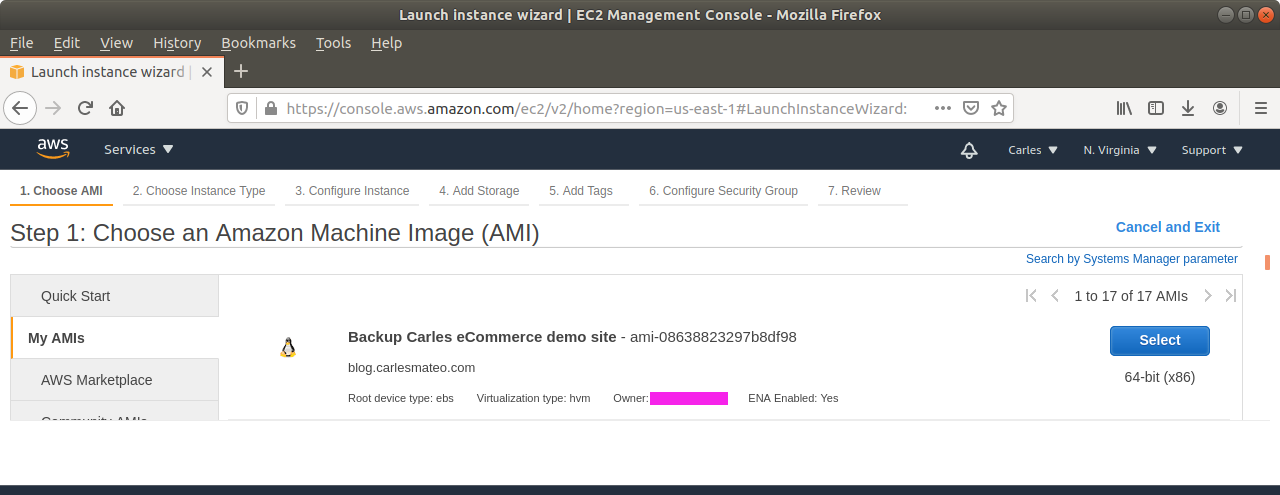
Step 9: Generate and upload the new key you will use to AWS Console, or ask Amazon to generate a key pair for you. You can do it while creating the new instance through the wizard.
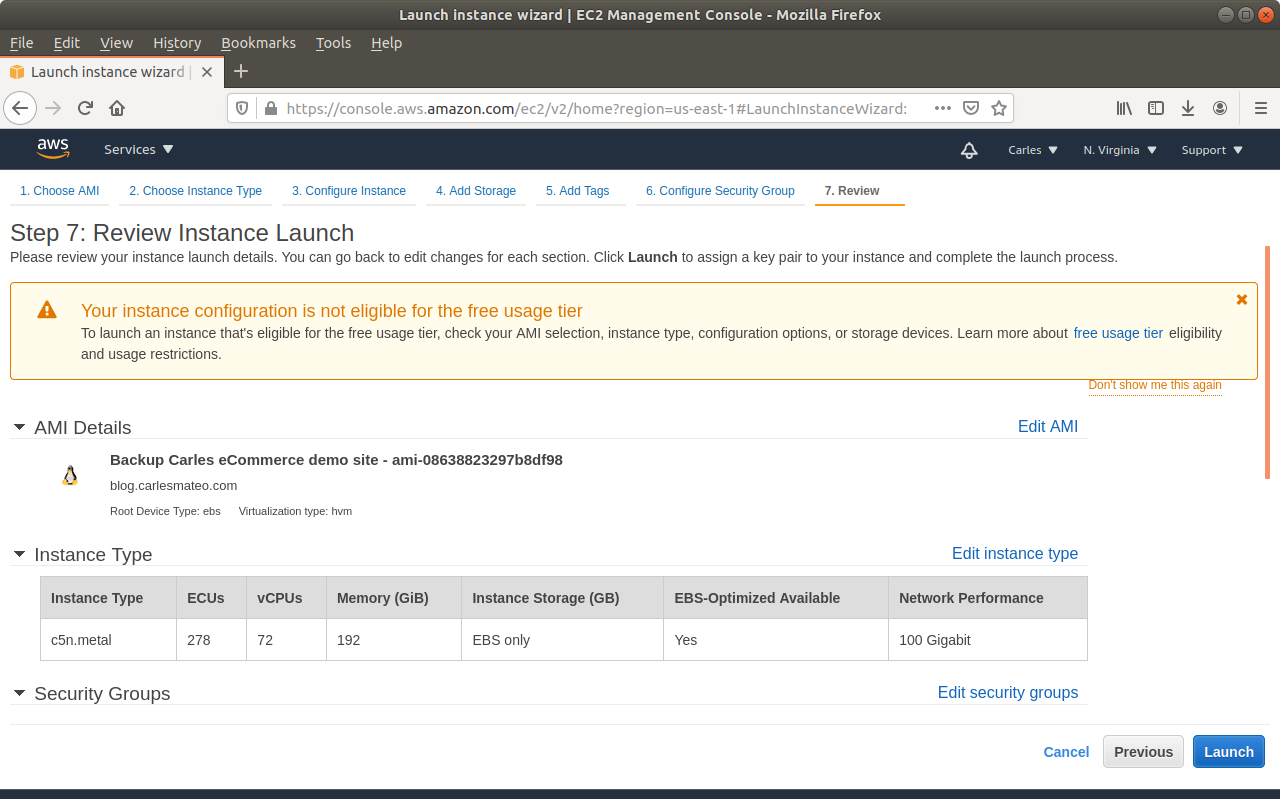
Step 10: Launch a new instance, based on your snapshot AMI. This will generate a copy of your previous instance (using the Snapshot) for the new one. Select the new Key pair. Finish assigning the Security groups, the elastic ip…
Step 11: Start the new instance. You can select a different flavor, like a more powerful instance, if you prefer. (scale vertically)
Step 12: Test your access by login via SSH with the new pair keys and from your static Ip which has access in the Firewall.
Step 13: Check that the web Starts correctly, check the Database logs to see if there is any corruption. Should not have any if graceful shutdown went well.
Step 14: Reopen the access from the Firewall, so the world can connect to your instance.
Method 2: Slower, access the Data and rebuild whatever you need
The second method is exactly the same until Step 6 included.
Step 7: After this, you will create a new instance based on your favorite OS, with a new pair of Keys.
Step 8: You’ll detach the Volume from the eCommerce previous instance (the one you lost access).
Step 9: You’ll attach the Volume to the new instance.
Step 10: You’ll have access to the Data from the previous instance in the new volume. type cat /proc/partitions or df -h to see the mountpoints available. You can then download or backup, or install the Software again and import the Database…
Step 11: Check that everything works, and enable the access worldwide to the Web in the Firewall (Security Group Inbound Rules).
If you are confident enough, you can use this method to upgrade the OS or base Software of your instance, making it part of your maintenance window. For example, to get the last version of Ubuntu or CentOS, MySQL, Python or PHP, etc…
I wanted to automate certain operations that we do very often, and so I decided to do a PoC of how handy will it be to create GUI applications that can automate tasks.
As locating information in several repositories of information (ldap, databases, websites, etc…) can be tedious I decided to create a small program that queries LDAP for the information I’m interested, in this case a Location. This small program can very easily escalated to launch the VPN, to query a Database after querying LDAP if no results are found, etc…
I share with you the basic application as you may find interesting to create GUI applications in Python, compatible with Windows, Linux and Mac.
I’m super Linux fan but this is important, as many multinationals still use Windows or Mac even for Engineers and SRE positions.
With the article I provide a Dockerfile and a docker-compose.yml file that will launch an OpenLDAP Docker Container preloaded with very basic information and a PHPLDAPMIN Container.
This article is more an exercise, like a game, so you get to know certain things about Linux, and follow my mental process to uncover this. Is nothing mysterious for the Senior Engineers but Junior Sys Admins may enjoy this reading. :)
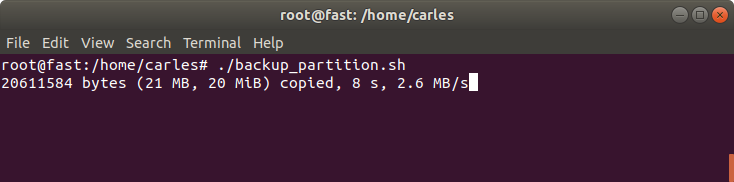
Ok, so the first thing is I wrote an script in order to completely backup my NVMe hard drive to a gziped file and then I will use this, as a motivation to go deep into investigations to understand.
So basically, we are going to restart the computer, boot with Linux Live USB Key, mount the Seagate Hard Drive, and run the script.
We are booting with a Live Linux Cd in order to have our partition unmounted and unmodified while we do the backup. This is in order to avoid corruption or data loss as a live Filesystem is getting modifications as we read it.
The problem with this first script is that it will generate a big gzip file.
By big I mean much more bigger than 2GB. Not all physical supports support files bigger than 2GB or 4GB, but even if they do, it’s a pain to transfer this over the Network, or in USB files, so we are going to do a slight modification.
Then one may ask himself, wait, if pipes use STDOUT and STDIN and dd is displaying into the screen, then will our gz file get corrupted?.
I like when people question things, and investigate, so let’s answer this question.
If it was a young member of my Team I would ask:
Ok, try,it. Check the output file to see if is corrupted.
So they can do zcat or zless to inspect the file, see if it has errors, and to make sure:
gzip -v -t nvme.img.gz
nvme.img.gz:        OK
Ok, so what happened?, because we were seeing output in the screen.
Assuming the young Engineer does not know the answer I would had told:
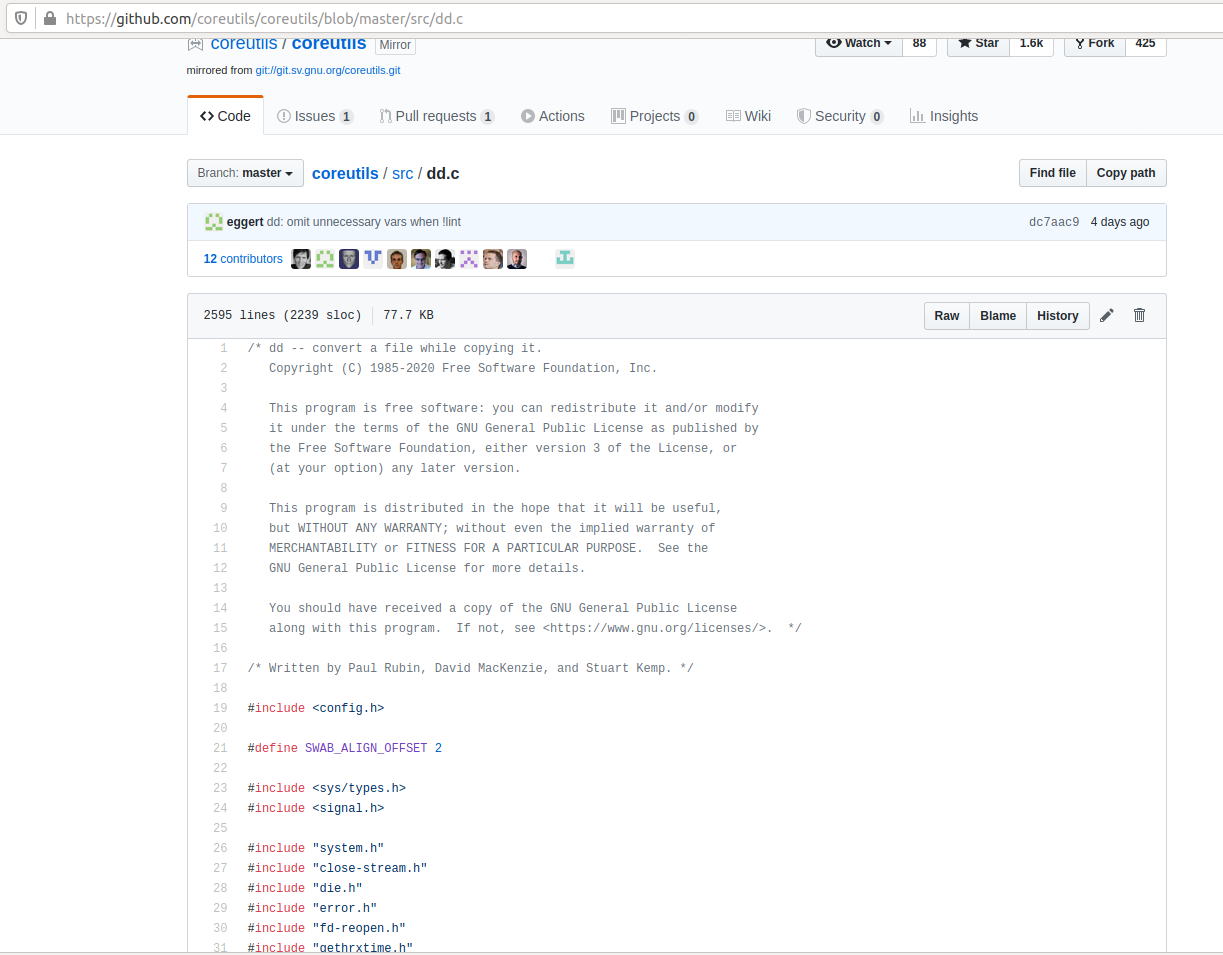
Ok, so you know that if dd would print to STDOUT, then you won’t see it, cause it would be sent to the pipe, so there is something more you’re missing. Let’s check the source code of dd to see what status=progress does
And then look for “progress”.
Soon you’ll find things like everywhere:
  if (progress_time)
    fputc ('\r', stderr);
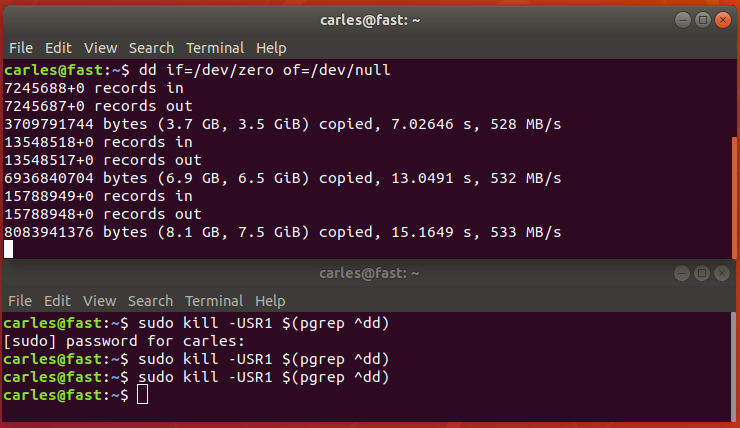
Ok, pay attention to where is the data written: stderr. So basically the answer is: dd status=progress does not corrupt STDOUT and prints into the screen because it uses STDERR.
Other funny ways to get the progress would be to use:
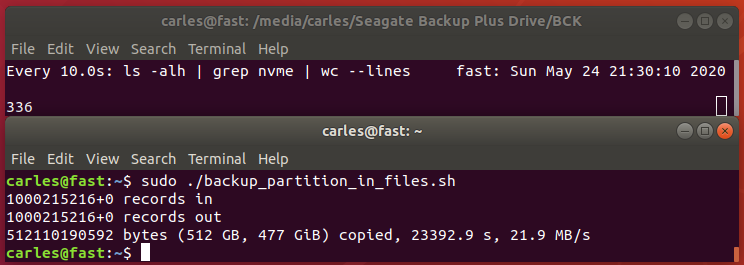
So you would see in real time what was the advance and finally 512GB where compressed to around 336GB in 336 files of 1 GB each (except the last one)
Another funny way would had been sending USR1 signal to the dd process:
Hope you enjoyed this little exercise about the importance of going deep, to the end, to understand what’s going on on the system. :)
Instead of gzip you can use bzip2 or pixz. pixz is very handy if you want to just compress a file, as it uses multiple processors in parallel for the tasks.
xz or lrzip are other compressors. lrzip aims to compress very large files, specially source code.
You do df -h or ls / and the terminal freezes and not even CTRL + C works, you have a lock.
Normally this is due to a lock of the system trying to perform an IO.
Could be a physical spinning disk failing, but the most probably nowadays is that you have a network mount point and it is timing out.
If you execute mount and you get a timeout, and when you finally see the list you see a NFS, iSCSI or another kind of Network mount (you will see an Ip Address), check for errors.
To do this in CentOS/RHEL you can do as root:
dmesg | grep -i "timed"
or depending on the System
cat /var/log/messages | grep -i "timed"
You’ll get something like this:
[root@compute01 carles]# dmesg -T | grep timed | head -n5
[Fri Mar 20 02:27:44 2020] nfs: server storage07 not responding, timed out
[Fri Mar 20 02:27:44 2020] nfs: server storage07 not responding, timed out
[Fri Mar 20 02:27:44 2020] nfs: server storage07 not responding, timed out
[Fri Mar 20 02:27:44 2020] nfs: server storage07 not responding, timed out
[Fri Mar 20 02:27:45 2020] nfs: server storage07 not responding, timed out
Please note I use dmesg -T in order to have human readable date instead of Unix Epoch.
In this example I will show how to use ufw to block tow specific Ip’s, execute as root or with sudo:
ufw insert 1 deny from 89.35.39.60 to any
ufw insert 2 deny from 85.204.246.240 to any
ufw allow OpenSSH
ufw allow 22/tcp
ufw allow "Apache Full"
ufw enable
ufw status numbered
You can do ufw status numbered to see the status of ufw and the rules order.
root@ip-111-111-111-111:/home/ubuntu# ufw status numbered
 Status: active
  To                         Action      From
 --                         ------      ----
 [ 1] Anywhere                   DENY IN     89.35.39.60
 [ 2] Anywhere                   DENY IN     85.204.246.240
 [ 3] Apache Full                ALLOW IN    Anywhere
 [ 4] OpenSSH                    ALLOW IN    Anywhere
 [ 5] 22/tcp                     ALLOW IN    Anywhere
 [ 6] Apache Full (v6)           ALLOW IN    Anywhere (v6)
 [ 7] OpenSSH (v6)               ALLOW IN    Anywhere (v6)
 [ 8] 22/tcp (v6)                ALLOW IN    Anywhere (v6)
 root@ip-111-111-111-111:/home/ubuntu#
If you need to delete a rule, use the number on the left and, just type:
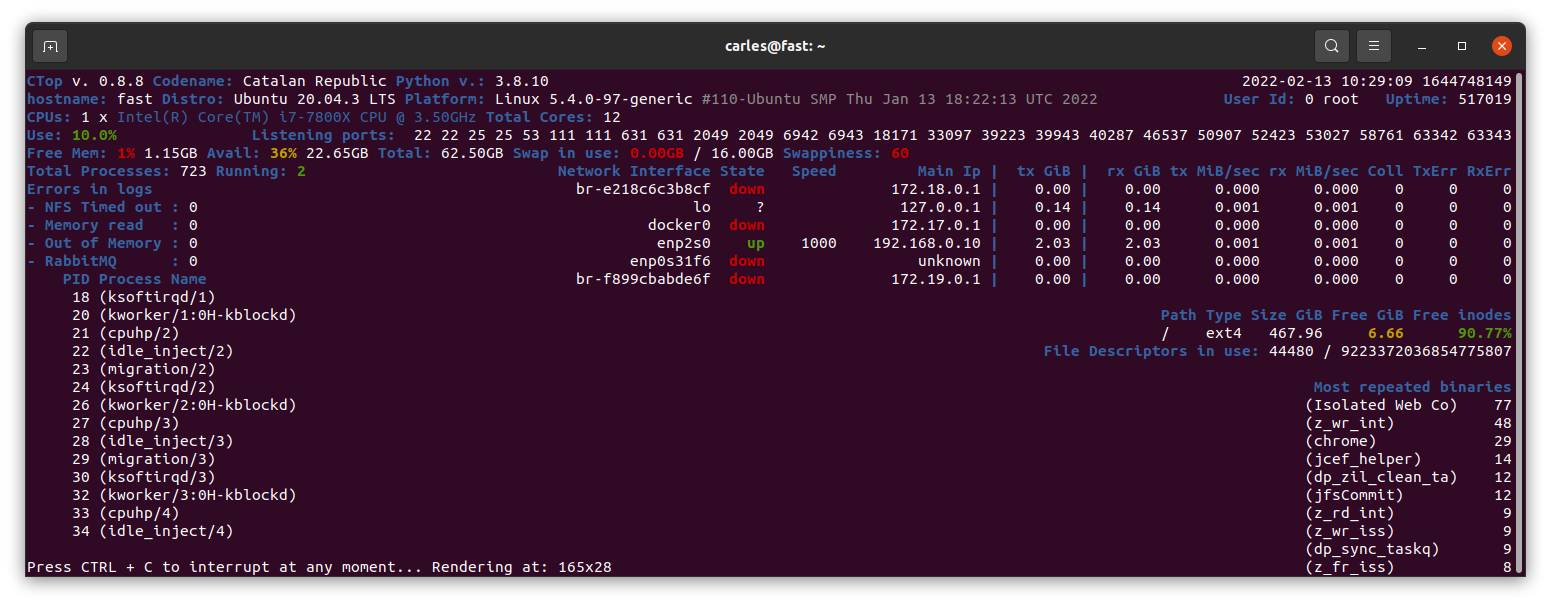
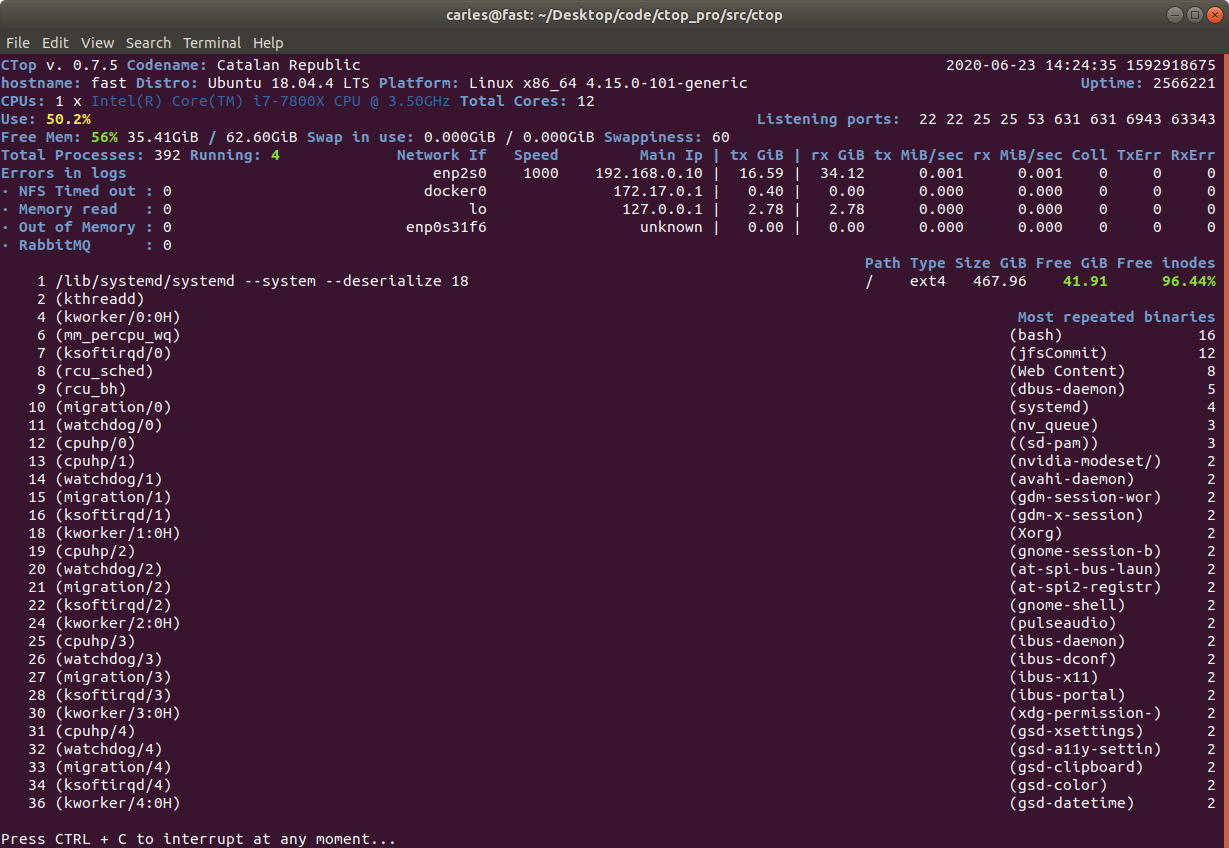
ctop.py is an Open Source tool for Linux System Administration that I’ve written in Python3. It uses only the System (/proc), and not third party libraries, in order to get all the information required. I use only this modules, so it’s ideal to run in all the farm of Servers and Dockers:
os
sys
time
shutil (for getting the Terminal width and height)
The purpose of this tool is to help to troubleshot and to identify problems with a single view to a single tool that has all the typical indicators.
It provides in a single view information that is typically provided by many programs:
top, htop for the CPU usage, process list, memory usage
meminfo
cpuinfo
hostname
uptime
df to see the free space in / and the free inodes
iftop to see real-time bandwidth usage
ip addr list to see the main Ip for the interfaces
netstat or lsof to see the list of listening TCP Ports
uname -a to see the Kernel version
Other cool things it does is:
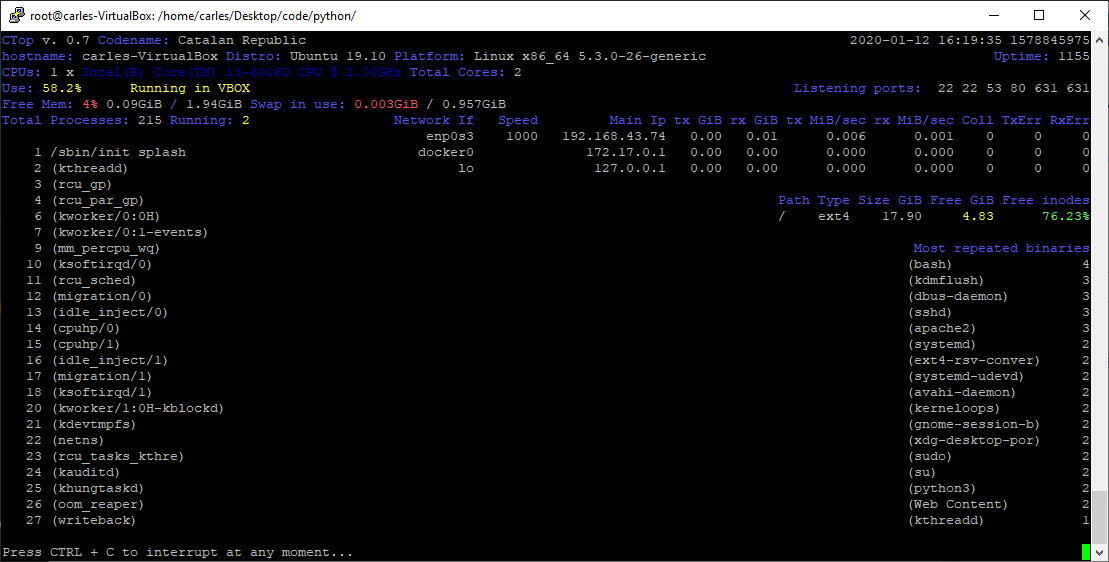
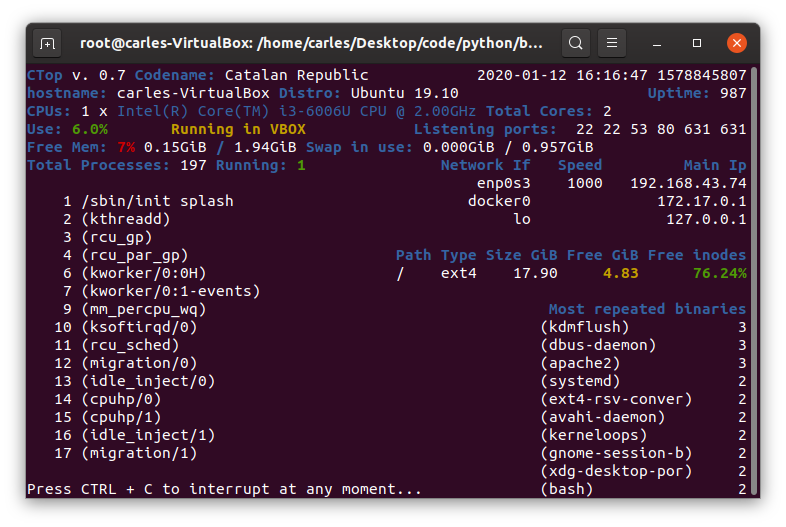
Identifying if you’re inside an Amazon VM, Google GCP, OpenStack VMs, Virtual Box VMs, Docker Containers or lxc.
Compatible with Raspberry Pi (tested on 3 and 4, on Raspbian and Ubuntu 20.04LTS)
Uses colors, and marks in yellow the warnings and in red the errors, problems like few disk space reaming or high CPU usage according to the available cores and CPUs.
Redraws the screen and adjust to the size of the Terminal, bigger terminal displays more information
It doesn’t use external libraries, and does not escape to shell. It reads everything from /proc /sys or /etc files.
Identifies the Linux distribution
Supports Plugins loaded on demand.
Shows the most repeated binaries, so you can identify DDoS attacks (like having 5,000 apache instances where you have normally 500 or many instances of Python)
Indicates if an interface has the cable connected or disconnected
Shows the Speed of the Network Connection (useful for Mellanox cards than can operate and 200Gbit/sec, 100, 50, 40, 25, 10…)
It displays the local time and the Linux Epoch Time, which is universal (very useful for logs and to detect when there was an issue, for example if your system restarted, your SSH Session would keep latest Epoch captured)
No root required
Displays recent errors like NFS Timed outs or Memory Read Errors.
You can enforce the output to be in a determined number of columns and rows, for data scrapping.
You can specify the number of loops (1 for scrapping, by default is infinite)
You can specify the time between screen refreshes, for long placed SSH sessions
You can specify to see the output in b/w or in color (default)
Plugins allow you to extend the functionality effortlessly, without having to learn all the code. I provide a Plugin sample for starting lights on a Raspberry Pi, depending on the CPU Load, and playing a message “The system is healthy” or “Warning. The CPU is at 80%”.
Limitations:
It only works for Linux, not for Mac or for Windows. Although the idea is to help with Server’s Linux Administration and Troubleshot, and Mac and Windows do not have /proc
The list of process of the System is read every 30 seconds, to avoid adding much overhead on the System, other info every second
It does not run in Python 2.x, requires Python 3 (tested on 3.5, 3.6, 3.7, 3.8, 3.9)
I decided to code name the version 0.7 as “Catalan Republic” to support the dreams and hopes and democratic requests of the Catalan people, to become and independent republic.
I created this tool as Open Source and if you want to help I need people to test under different versions of:
Atypical Linux distributions
If you are a Cloud Provider and want me to implement the detection of your VMs, so the tool knows that is a instance of the Amazon, Google, Azure, Cloudsigma, Digital Ocean… contact me through my LinkedIn.
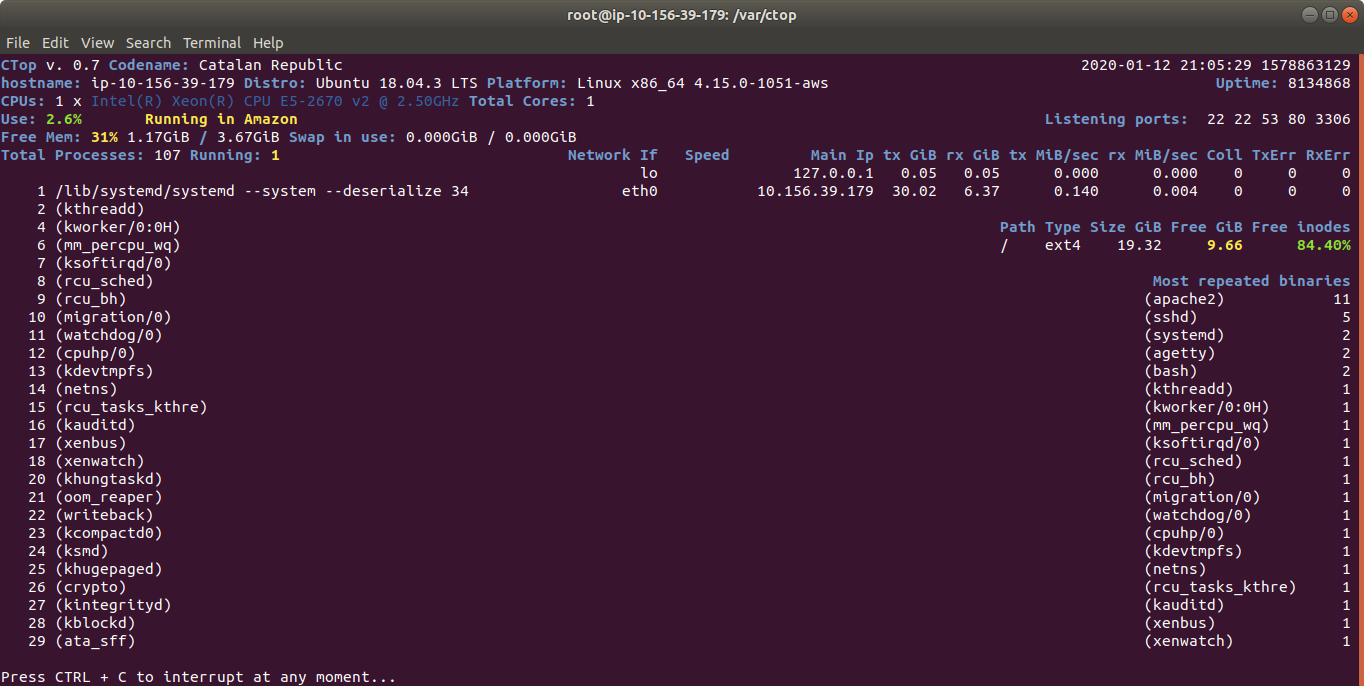
Monitoring an Amazon Instance, take a look at the amount of traffic sent and received
Some of the features I’m working on are parsing the logs checking for errors, kernel panics, processed killed due to lack of memory, iscsi disconnects, nfs errors, checking the logs of mysql and Oracle databases to locate errors
This is the history it happen to me some time ago, and so the commands I used to troubleshot. The purpose is to share knowledge in a interactive way. There are some hidden gems that you’ll acquire if you have the patience to go over all the document and read it all…
I had qualified Intel Xeon single processor platform to run my DRAID (ZFS Declustered RAID) project for my employer.
The platforms I qualified were:
1) single processor for Cold Storage (SAS Spinning drives): 4U60, newest models 4602
2) for multiprocessor: the 4U90 (90 Spinning drives) and Flash: All-Flash-Arrays.
The amounts of RAM I was using for my tests range for 64GB to 384GB.
Somebody in the company, at executive level, assembled an experimental config that was totally new for us and wanted to try by their own. It was the 4602 with multiprocessor and 32GB of RAM.
When they were unable to make it work at the expected speed, they required me to troubleshot and to make it work.
The 4602 single processor had two IOC (Input Output Controller, LSI Logic / Symbios Logic SAS3008 PCI-Express Fusion-MPT SAS-3 (rev 02) ), while the 4602 double processor had four IOC, so given that each of those IOC can perform at peaks of 6GB/s, with a maximum total of 24 GB/s, the performance when reading/writing from all the drives should be better.
But this Server was returning double times for Rebuilding, respect the single processor version, which didn’t make any sense.
I had to check everything. There was the commands I ran:
Check the upgrade of the CPU:
htop
lscpu
Changing the Zoning.
Those Servers use SAS drives dual ported, which means that two different computers can be connected to the same drive and operate at the same time. Is up to you to make sure you don’t introduce corruption. Those systems are used mainly for HA (High Availability).
Those Systems allow to be configured in different zoning modes. That’s the way on how each of the two servers (Controllers) see the disk. In one zoning each Controller sees only 30 drives, in another each IOC sees all the drives (for redundancy but performance constrained to 1 IOC Speed).
The config I set is each IOC will see 15 drives, so each one of the 4 IOC will have 6GB/s for 15 drives. Given that these spinning drives perform in the outtermost part of the cylinder at 265MB/s, that means that at maximum speed one IOC will be using 3.97 GB/s, will say 4GB/s. Plenty of bandwidth.
Note: Spinning drives have different performance depending on how close you’re to the cylinder. In the innermost part it goes under 145 MB/s, and if you read all of those drive sequentially with dd it will return an average speed of 145 MB/s.
With this command you can sive live how it performs and the average read speed in real time. Use skip to jump to that position (relative to bs) in the drive, so you can test directly the speed at the innermost close to the cylinder part of t.
dd if=/dev/sda of=/dev/null bs=1M status=progress
I saw that the zoning was not right one, so I set it correctly:
The sleeps after rebooting the expanders are recommended. Rebooting the Operating System too, to avoid problems with some Software as the expanders changed live.
If you have ZFS pools or workloads stop them and export the pool before messing with the expanders.
In order to check to which drives is connected each IOC:
I do this for all the drives at the same time and with iostat:
iostat -y 1 1
I check the status of the memory with:
slabtop
free
htop
I checked the memory and htop during a Rebuild. Memory was more than enough. However CPU usage was higher than expected.
The red bars in the image correspond to kernel processes, in this case is the DRAID Rebuild. I see that the load is higher than the usual with a single processor.
I capture all the parameters from ZFS with:
zfs get all
All this information is logged into my forensics document, so later can be checked by my Team or I can share with other Architects or other members of the company. I started this methodology after I knew how Google do their SRE forensics / postmortem documents. Also for myself is useful for the future to have a log of the commands I executed and a verbose output of the results.
I install the smp_utils
yum install smp_utils
Check things:
ls -al  /dev/bsg/
total 0drwxr-xr-x.  2 root root     3020 May 22 10:16 .
drwxr-xr-x. 20 root root     8680 May 22 10:16 ..
crw-------.  1 root root 248,  76 May 22 10:00 1:0:0:0
crw-------.  1 root root 248, 126 May 22 10:00 10:0:0:0
crw-------.  1 root root 248, 127 May 22 10:00 10:0:1:0
crw-------.  1 root root 248, 136 May 22 10:00 10:0:10:0
crw-------.  1 root root 248, 137 May 22 10:00 10:0:11:0
crw-------.  1 root root 248, 138 May 22 10:00 10:0:12:0
crw-------.  1 root root 248, 139 May 22 10:00 10:0:13:0
[...]
There are some errors, and I check with the Hardware Team, which pass a battery of tests on the machine and say that the machine passes. They tell me that if the errors counted were in order of millions then it would be a problem, but having few of them is usual.
My colleagues previously reported that the memory was performing well, and the CPU too. They told me that the speed was exactly double respect a platform with one single CPU of the same kind.
Even if they told me that, I ran cmips tests to make sure.
git clone https://github.com/cmips/cmips_bin
It scored 16,000. The performance was Ok in general terms but the problem is that I didn’t have a baseline for that processor in single processor, so I cannot make sure that the memory bandwidth was Ok. The performance was less that an Amazon c3.8xlarge. The system I was testing is a two processor system, but each CPU is cheap, around USD $400.
Still my gut feeling was telling me that this double processor server should score more.
lscpu
[root@DRAID-1135-14TB-2CPU ~]# lscpu
 Architecture:          x86_64
 CPU op-mode(s):        32-bit, 64-bit
 Byte Order:            Little Endian
 CPU(s):                32
 On-line CPU(s) list:   0-31
 Thread(s) per core:    2
 Core(s) per socket:    8
 Socket(s):             2
 NUMA node(s):          2
 Vendor ID:             GenuineIntel
 CPU family:            6
 Model:                 79
 Model name:            Intel(R) Xeon(R) CPU E5-2620 v4 @ 2.10GHz
 Stepping:              1
 CPU MHz:               2299.951
 CPU max MHz:           3000.0000
 CPU min MHz:           1200.0000
 BogoMIPS:              4199.73
 Virtualization:        VT-x
 L1d cache:             32K
 L1i cache:             32K
 L2 cache:              256K
 L3 cache:              20480K
 NUMA node0 CPU(s):     0-7,16-23
 NUMA node1 CPU(s):     8-15,24-31
 Flags:                 fpu vme de pse tsc msr pae mce cx8 apic sep mtrr pge mca cmov pat pse36 clflush dts acpi mmx fxsr sse sse2 ss ht tm pbe syscall nx pdpe1gb rdtscp lm constant_tsc arch_perfmon pebs bts rep_good nopl xtopology nonstop_tsc aperfmperf eagerfpu pni pclmulqdq dtes64 monitor ds_cpl vmx smx est tm2 ssse3 sdbg fma cx16 xtpr pdcm pcid dca sse4_1 sse4_2 x2apic movbe popcnt tsc_deadline_timer aes xsave avx f16c rdrand lahf_lm abm 3dnowprefetch epb cat_l3 cdp_l3 intel_ppin intel_pt ibrs ibpb stibp tpr_shadow vnmi flexpriority ept vpid fsgsbase tsc_adjust bmi1 hle avx2 smep bmi2 erms invpcid rtm cqm rdt_a rdseed adx smap xsaveopt cqm_llc cqm_occup_llc cqm_mbm_total cqm_mbm_local dtherm ida arat pln pts spec_ctrl intel_stibp
I check the memory configuration with:
dmidecode -t memory
I examined the results, I see that the processor can only operate the DDR4 ECC 2400 Memory at 2133 and… I see something!. This Controller before was a single processor with 2 Memory Sticks of 16GB each, dual rank.
I see that now I have the same number of sticks in that machine, but I have two CPU!. So 2 Memory sticks in total, for 2 CPU.
That’s no good. The memory must be in pairs and in the right slots to get the maximum performance.
1 memory module for 1 CPU doesn’t allow to have Dual Channel and probably is affecting the performance. Many Servers will not even boot if you add an odd number of memory sticks per CPU.
And many Servers can operate at full speed only if all the banks are filled.
I request to the Engineers in Silicon Valley to add 4 modules in the right slots. They did, and I repeated the tests and the performance was doubled then.
After some days I had some time with the machine, I repeated the test and I got a CMIPS Score of around 20,000.
Multiprocessor world is far more complicated than single processor. Some times things can work not as expected, and not be evident, for example cache pipeline can act diferent for a program working in multiprocessor and single processor. Or the QPI could be saturated.
After this I shared my forensics document with as many Engineers as I could, so they could learn how I did to troubleshot the problem, and what was the origin of it, and I asked them to do the same so we can track their steps and progress if something needs to be troubleshoot.
After proper intensive testing the Server was qualified. Lesson here is that changes cannot be commited quickly, need their time.
Nothing new, zombie computers, hackers, pirates, networks of computers… trying to abuse the system and to hack into it. Why? There could be many reasons, from storing pirate movies, trying to use your Server for sending Spam, try to phishing or to host Ransomware pages…
Most of those guys doesn’t know that is almost impossible to Spam from Amazon. Few emails per hour can come out from the Server unless you explicitly requests that update and configure everything.
But I thought it was a great opportunity to force myself to update the Operating System, core tools, versions of PHP and MySql.
Forensics / Postmortem of the incident
The task was divided in two parts:
Understanding the origin of the attack
Blocking the offending Ip addresses or disabling XMLRPC
Making the VM boot again (problems with Amazon AWS)
I didn’t know why it was not booting so.
Upgrading the OS
I disabled the access to the site while I was working using Amazon Web Services Firewall. Basically I turned access to my ip only. Example: 8.8.8.8/32
I changed 0.0.0.0/0 so the world wide mask to my_Ip/3
That way the logs were reflecting only what I was doing from my Ip.
Dealing with Snapshots and Volumes in AWS
Well the first thing was doing an Snapshot.
After, I tried to boot the original Blog Server (so I don’t stop offering service) but no way, the Server appeared to be dead.
So then I attached the Volume to a new Server with the same base OS, in order to extract (dump) the database. Later I would attach the same Volume to a new Server with the most recent OS and base Software.
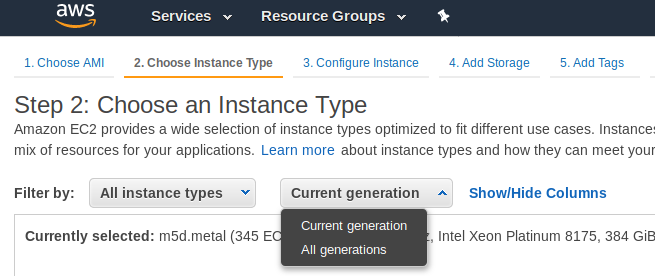
Something that is a bit annoying is that the new Instances, the new generation instances, run only in VPC, not in Amazon EC2 Classic. But my static Ip addresses are created for Amazon EC2 Classic, so I could not use them in new generation instances.
I choose the option to see all the All the generations.
Upgrading the system base Software had its own challenges too.
Upgrading the OS / Base Software
My approach was to install an Ubuntu 18.04 LTS, and install the base Software clean, and add any modification I may need.
I wanted to have all the supported packages and a recent version of PHP 7 and the latest Software pieces link Apache or MySQL.
Config files that before were working stopped working as the new Apache version requires the files or symlinks under /etc/apache2/sites-enabled/ to end with .conf extension.
Also some directives changed, so some websites will not able to work properly.
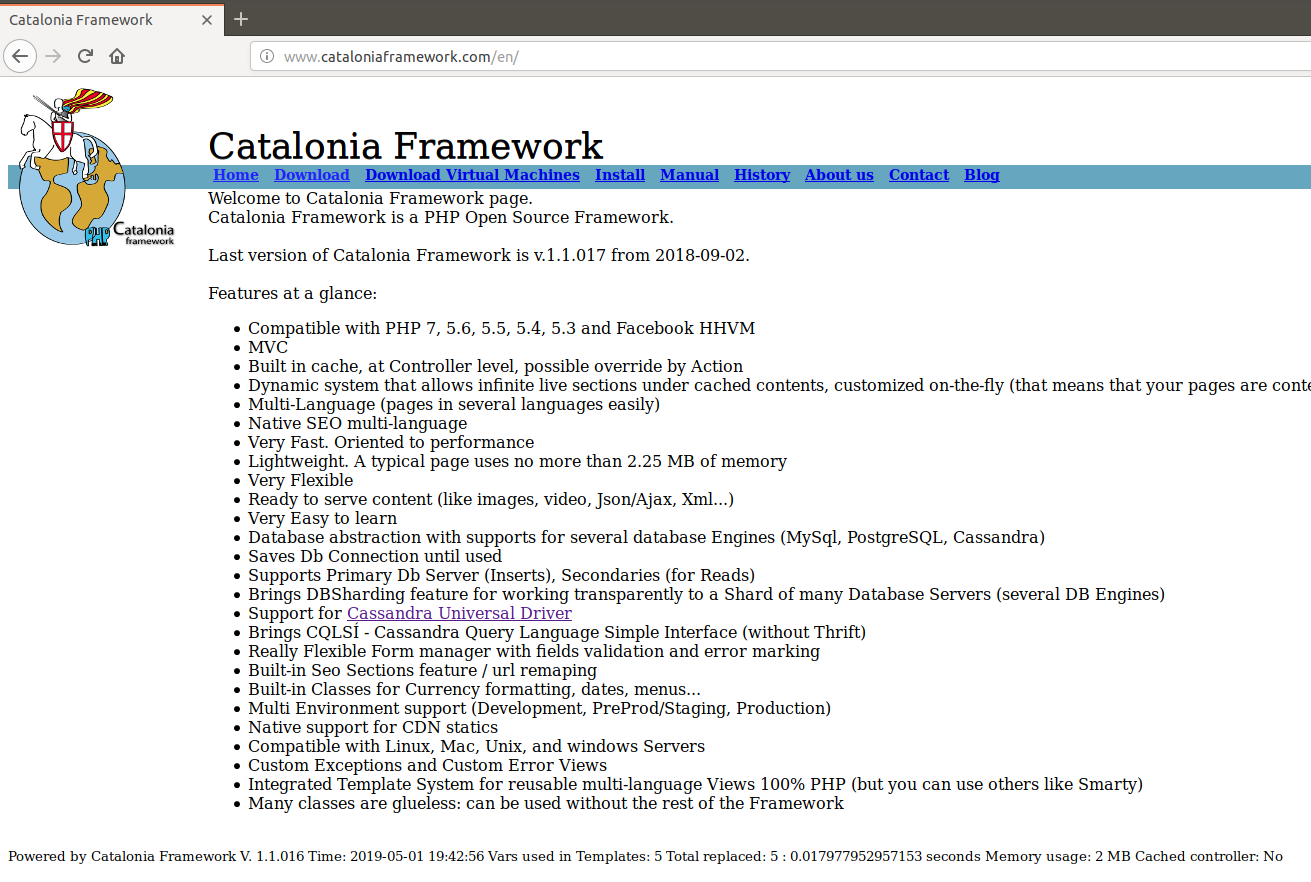
Those projects using my Catalonia Framework were affected, although I have this very well documented to make it easy to work with both versions of Apache Http Server, so it was a very straightforward change.
From the previous version I had to change my www.cataloniaframework.com.conf file and enable:
    <Directory /www/www.cataloniaframework.com>
             Options Indexes FollowSymLinks MultiViews
             AllowOverride All
             Order allow,deny
             allow from all
     </Directory>
Then Open the ports for the Web Server (443 and 80).
sudo ufw allow in "Apache Full"
Then service apache restart
Catalonia Framework Web Site, which is also created with Catalonia Framework itself once restored
MySQL
The problem was to use the most updated version of the Database. I could use one of the backups I keep, from last week, but I wanted more fresh data.
I had the .db files and it should had been very straightforward to copy to /var/lib/mysql/ … if they were the same version. But they weren’t. So I launched an instance with the same base Software as the old previous machine had, installed mysql-server, stopped it, copied the .db files, started it, and then I made a dump with mysqldump –all-databases > 2019-04-29-all-databases.sql
Note, I copied the .db files using the mythical mc, which is a clone from Norton Commander.
Then I stopped that instance and I detached that volume and attached it to the new Blog Instance.
I did a Backup of my original /var/lib/mysql/ files for the purpose of faster restoring if something went wrong.
I mounted it under /mnt/blog_old and did mysql -u root -p < /mnt/blog_old/home/ubuntu/2019-04-29-all-databases.sql
That worked well I had restored the blog. But as I was watching the /var/log/mysql/error.log I noticed some columns were not where they should be. That’s because inadvertently I overwritten the MySql table as well, which in MySQL 5.7 has different structure than in MySQL 5.5. So I screwed. As I previewed this possibility I restored from the backup in seconds.
So basically then I edited my .sql files and removed all that was for the mysql database.
I started MySql, and run the mysql import procedure again. It worked, but I had to recreate the users for all the Databases and Grant them permissions.
GRANT ALL PRIVILEGES ON db_mysqlproxycache.* TO 'wp_dbuser_mysqlproxy'@'localhost' IDENTIFIED BY 'XWy$&{yS@qlC|<¡!?;:-ç';
PHP7
Some modules in my blogs where returning errors in /var/log/apache2/mysite-error.log so I checked that it was due to lack of support of latest PHP versions, and so I patched manually the code or I just disabled the offending plugin.
WordPress
As seen checking the /var/log/apache2/blog.carlesmateo.com-error.log some URLs where not located by WordPress.
For example:
The requested URL /wordpress/wp-json/ was not found on this server
I had to activate modrewrite and then restart Apache.
a2enmod rewrite; service apache2 restart
Making the site more secure
Checking at the logs of Apache, /var/log/apache2/blog.carlesmateo.com-access.log I checked for Ip’s accessing Admin areas, I looked for 404 Errors pointing to intents to exploit any unsafe WP Plugin, I checked for POST protocol as well.
I added to the Ubuntu Uncomplicated Firewall (UFW) the offending Ip’s and patched the xmlrpc.php file to exit always.
I encountered that Server, Xeon, 128 GB of RAM, with those 58 Spinning drives 10 TB and 2 SSD of 2 TB each, where I was testing the latest version of my Software.
Monitoring long term tests, data validation, checking for memory leaks… I notice the Server is using 70 GB of RAM. Only 5.5 GB are used for buffers according to the usual tools (top, htop, free, cat /proc/meminfo, ps aux…) and no programs are eating that amount, so where is the RAM?. The rest of the Servers are working well, including models: same mode, 4U60 with 64 GB of RAM, 4U90 with 128 GB and All-Flash-Array with 256 GB of RAM, only using around 8 GB of RAM even under load. iSCSI sharings being used, with I/O, iSCSI initiators trying to connect and getting rejected, several requests for second, disk pulling, and that usual stuff. And this is the only unit using so many memory, so what?. I checked some modules to see memory consumption, but nothing clear. Ok, after a bit of investigation one member of the Team said “Oh, while you was on holidays we created a Ramdisk and filled it for some validations, we deleted that already but never rebooted the Server”. Ok. The easy solution would be to reboot, but that would had hidden a memory leak it that was the cause. No, I had to find the real cause.
I requested assistance of one my colleagues, specialist, Kernel Engineer. He confirmed that processes were not taking that memory, and ask me to try to drop the cache.
So I did:
sync
echo 3 > /proc/sys/vm/drop_caches
Then the memory usage drop to 11.4 GB and kept like that while I maintain sustained the load.
That’s more normal taking in count that we have 16 Volumes shared and one host is attempting to connect to Volumes that do not exist any more like crazy, Services and Cronjobs run in background and we conduct tests degrading the pool, removing drives, etc..
After tests concluded memory dropped to 2 GB, which is what we use when we’re not under load.
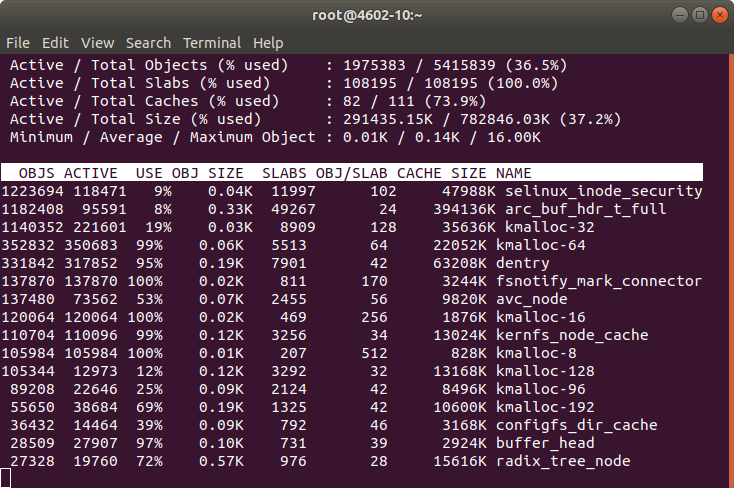
Note: In order to know about the memory being used by Kernel slab cache in real time you can use command:
This trick may be useful for you. Almost surely if you power cycle, completely powering down your Server you’ll fix booting too. Unfortunately we do not always have access to the Data Center or Remote Hands service available, so this trick may be useful for you.