Category Archives: Operations

Blocking some offending Ip’s easily with Ubuntu ufw

Ok, so we know that there are several ip’s that have attempted to hack the blog.

We know they try different urls looking for a exploit, or they try to hack a password by brute force…

We are using Amazon EC2 and the old infrastructure, not a VPC Network, so we cannot block a specific Ip to our Web Server.

In an article from 2015 I explained How to Stop a BitTorrent based DDoS attack, and was using iptables for that.

In this example I will show how to use ufw to block tow specific Ip’s, execute as root or with sudo:

ufw insert 1 deny from 89.35.39.60 to any
ufw insert 2 deny from 85.204.246.240 to any
ufw allow OpenSSH
ufw allow 22/tcp
ufw allow "Apache Full"
ufw enable
ufw status numbered

You can do ufw status numbered to see the status of ufw and the rules order.

root@ip-111-111-111-111:/home/ubuntu# ufw status numbered
Status: active
To Action From
-- ------ ----

[ 1] Anywhere DENY IN 89.35.39.60
[ 2] Anywhere DENY IN 85.204.246.240
[ 3] Apache Full ALLOW IN Anywhere
[ 4] OpenSSH ALLOW IN Anywhere
[ 5] 22/tcp ALLOW IN Anywhere
[ 6] Apache Full (v6) ALLOW IN Anywhere (v6)
[ 7] OpenSSH (v6) ALLOW IN Anywhere (v6)
[ 8] 22/tcp (v6) ALLOW IN Anywhere (v6)
root@ip-111-111-111-111:/home/ubuntu#

If you need to delete a rule, use the number on the left and, just type:

sudo ufw delete 2

CTOP.py

For updated information visit the main page for CTOP.py

Current stable version is v.0.8.9 updated on 2022-07-03.

Current branch under development is v.0.8.10 updated on 2022-07-03.

Version 0.8.0 added compatibility with Python 2, for older Systems.

Find the source code in: https://gitlab.com/carles.mateo/ctop

Clone it with:

git clone https://gitlab.com/carles.mateo/ctop.git

ctop.py is an Open Source tool for Linux System Administration that I’ve written in Python3. It uses only the System (/proc), and not third party libraries, in order to get all the information required.
I use only this modules, so it’s ideal to run in all the farm of Servers and Dockers:

  • os
  • sys
  • time
  • shutil (for getting the Terminal width and height)

The purpose of this tool is to help to troubleshot and to identify problems with a single view to a single tool that has all the typical indicators.

It provides in a single view information that is typically provided by many programs:

  • top, htop for the CPU usage, process list, memory usage
  • meminfo
  • cpuinfo
  • hostname
  • uptime
  • df to see the free space in / and the free inodes
  • iftop to see real-time bandwidth usage
  • ip addr list to see the main Ip for the interfaces
  • netstat or lsof to see the list of listening TCP Ports
  • uname -a to see the Kernel version

Other cool things it does is:

  • Identifying if you’re inside an Amazon VM, Google GCP, OpenStack VMs, Virtual Box VMs, Docker Containers or lxc.
  • Compatible with Raspberry Pi (tested on 3 and 4, on Raspbian and Ubuntu 20.04LTS)
  • Uses colors, and marks in yellow the warnings and in red the errors, problems like few disk space reaming or high CPU usage according to the available cores and CPUs.
  • Redraws the screen and adjust to the size of the Terminal, bigger terminal displays more information
  • It doesn’t use external libraries, and does not escape to shell. It reads everything from /proc /sys or /etc files.
  • Identifies the Linux distribution
  • Supports Plugins loaded on demand.
  • Shows the most repeated binaries, so you can identify DDoS attacks (like having 5,000 apache instances where you have normally 500 or many instances of Python)
  • Indicates if an interface has the cable connected or disconnected
  • Shows the Speed of the Network Connection (useful for Mellanox cards than can operate and 200Gbit/sec, 100, 50, 40, 25, 10…)
  • It displays the local time and the Linux Epoch Time, which is universal (very useful for logs and to detect when there was an issue, for example if your system restarted, your SSH Session would keep latest Epoch captured)
  • No root required
  • Displays recent errors like NFS Timed outs or Memory Read Errors.
  • You can enforce the output to be in a determined number of columns and rows, for data scrapping.
  • You can specify the number of loops (1 for scrapping, by default is infinite)
  • You can specify the time between screen refreshes, for long placed SSH sessions
  • You can specify to see the output in b/w or in color (default)

Plugins allow you to extend the functionality effortlessly, without having to learn all the code. I provide a Plugin sample for starting lights on a Raspberry Pi, depending on the CPU Load, and playing a message “The system is healthy” or “Warning. The CPU is at 80%”.

Limitations:

  • It only works for Linux, not for Mac or for Windows. Although the idea is to help with Server’s Linux Administration and Troubleshot, and Mac and Windows do not have /proc
  • The list of process of the System is read every 30 seconds, to avoid adding much overhead on the System, other info every second
  • It does not run in Python 2.x, requires Python 3 (tested on 3.5, 3.6, 3.7, 3.8, 3.9)

I decided to code name the version 0.7 as “Catalan Republic” to support the dreams and hopes and democratic requests of the Catalan people, to become and independent republic.

I created this tool as Open Source and if you want to help I need people to test under different versions of:

  • Atypical Linux distributions

If you are a Cloud Provider and want me to implement the detection of your VMs, so the tool knows that is a instance of the Amazon, Google, Azure, Cloudsigma, Digital Ocean… contact me through my LinkedIn.

Monitoring an Amazon Instance, take a look at the amount of traffic sent and received

Some of the features I’m working on are parsing the logs checking for errors, kernel panics, processed killed due to lack of memory, iscsi disconnects, nfs errors, checking the logs of mysql and Oracle databases to locate errors

Dealing with Performance degradation on ZFS (DRAID) Rebuilds when migrating from a single processor to a multiprocessor platform

This is the history it happen to me some time ago, and so the commands I used to troubleshot. The purpose is to share knowledge in a interactive way. There are some hidden gems that you’ll acquire if you have the patience to go over all the document and read it all…

I had qualified Intel Xeon single processor platform to run my DRAID (ZFS Declustered RAID) project for my employer.

The platforms I qualified were:

1) single processor for Cold Storage (SAS Spinning drives): 4U60, newest models 4602

2) for multiprocessor: the 4U90 (90 Spinning drives) and Flash: All-Flash-Arrays.

The amounts of RAM I was using for my tests range for 64GB to 384GB.

Somebody in the company, at executive level, assembled an experimental config that was totally new for us and wanted to try by their own. It was the 4602 with multiprocessor and 32GB of RAM.

When they were unable to make it work at the expected speed, they required me to troubleshot and to make it work.

The 4602 single processor had two IOC (Input Output Controller, LSI Logic / Symbios Logic SAS3008 PCI-Express Fusion-MPT SAS-3 (rev 02) ), while the 4602 double processor had four IOC, so given that each of those IOC can perform at peaks of 6GB/s, with a maximum total of 24 GB/s, the performance when reading/writing from all the drives should be better.

But this Server was returning double times for Rebuilding, respect the single processor version, which didn’t make any sense.

I had to check everything. There was the commands I ran:

Check the upgrade of the CPU:

htop
lscpu

Changing the Zoning.

Those Servers use SAS drives dual ported, which means that two different computers can be connected to the same drive and operate at the same time. Is up to you to make sure you don’t introduce corruption. Those systems are used mainly for HA (High Availability).

Those Systems allow to be configured in different zoning modes. That’s the way on how each of the two servers (Controllers) see the disk. In one zoning each Controller sees only 30 drives, in another each IOC sees all the drives (for redundancy but performance constrained to 1 IOC Speed).

The config I set is each IOC will see 15 drives, so each one of the 4 IOC will have 6GB/s for 15 drives. Given that these spinning drives perform in the outtermost part of the cylinder at 265MB/s, that means that at maximum speed one IOC will be using 3.97 GB/s, will say 4GB/s. Plenty of bandwidth.

Note: Spinning drives have different performance depending on how close you’re to the cylinder. In the innermost part it goes under 145 MB/s, and if you read all of those drive sequentially with dd it will return an average speed of 145 MB/s.

With this command you can sive live how it performs and the average read speed in real time. Use skip to jump to that position (relative to bs) in the drive, so you can test directly the speed at the innermost close to the cylinder part of t.

dd if=/dev/sda of=/dev/null bs=1M status=progress

I saw that the zoning was not right one, so I set it correctly:

[root@4602Carles ~]# sg_map -i | grep NEWISYS
/dev/sg30  NEWISYS   NDS-4602-CS       0112
/dev/sg61  NEWISYS   NDS-4602-CS       0112
/dev/sg63  NEWISYS   NDS-4602-CS       0112
/dev/sg64  NEWISYS   NDS-4602-CS       0112
[root@4602Carles10 ~]# sg_senddiag /dev/sg30  --pf --raw=04,00,00,01,53
[root@4602Carles10 ~]# sleep 50
[root@4602Carles10 ~]# sg_senddiag /dev/sg30 --pf -r 04,00,00,01,43
[root@4602Carles10 ~]# sleep 50
[root@4602Carles10 ~]# reboot

The sleeps after rebooting the expanders are recommended. Rebooting the Operating System too, to avoid problems with some Software as the expanders changed live.

If you have ZFS pools or workloads stop them and export the pool before messing with the expanders.

In order to check to which drives is connected each IOC:

[root@4602Carles10 ~]# sg_map -i -x
/dev/sg0  0 0 0 0  0  /dev/sda  TOSHIBA   MG07SCA14TA       0101
/dev/sg1  0 0 1 0  0  /dev/sdb  TOSHIBA   MG07SCA14TA       0101
/dev/sg2  0 0 2 0  0  /dev/sdc  TOSHIBA   MG07SCA14TA       0101
/dev/sg3  0 0 3 0  0  /dev/sdd  TOSHIBA   MG07SCA14TA       0101
/dev/sg4  0 0 4 0  0  /dev/sde  TOSHIBA   MG07SCA14TA       0101
/dev/sg5  0 0 5 0  0  /dev/sdf  TOSHIBA   MG07SCA14TA       0101
/dev/sg6  0 0 6 0  0  /dev/sdg  TOSHIBA   MG07SCA14TA       0101
/dev/sg7  0 0 7 0  0  /dev/sdh  TOSHIBA   MG07SCA14TA       0101
/dev/sg8  1 0 8 0  0  /dev/sdi  TOSHIBA   MG07SCA14TA       0101
/dev/sg9  1 0 9 0  0  /dev/sdj  TOSHIBA   MG07SCA14TA       0101
/dev/sg10  1 0 10 0  0  /dev/sdk  TOSHIBA   MG07SCA14TA       0101
/dev/sg11  1 0 11 0  0  /dev/sdl  TOSHIBA   MG07SCA14TA       0101
[...]
/dev/sg16  4 0 16 0  0  /dev/sdq  TOSHIBA   MG07SCA14TA       0101
/dev/sg17  4 0 17 0  0  /dev/sdr  TOSHIBA   MG07SCA14TA       0101
[...]
/dev/sg30  0 0 30 0  13  NEWISYS   NDS-4602-CS       0112
[...]

Still after setting the right zone the Rebuilds were slow, the scan rate half of the obtained with a single processor.

I tested that the system was able to provide the expected performance by reading from all the drives at the same time. This is done with:

dd if=/dev/sda of=/dev/null bs=1M status=progress &
dd if=/dev/sdb of=/dev/null bs=1M status=progress &
dd if=/dev/sdc of=/dev/null bs=1M status=progress &
dd if=/dev/sdd of=/dev/null bs=1M status=progress &
[...]

I do this for all the drives at the same time and with iostat:

iostat -y 1 1

I check the status of the memory with:

slabtop
free
htop

I checked the memory and htop during a Rebuild. Memory was more than enough. However CPU usage was higher than expected.

The red bars in the image correspond to kernel processes, in this case is the DRAID Rebuild. I see that the load is higher than the usual with a single processor.

I capture all the parameters from ZFS with:

zfs get all

All this information is logged into my forensics document, so later can be checked by my Team or I can share with other Architects or other members of the company. I started this methodology after I knew how Google do their SRE forensics / postmortem documents. Also for myself is useful for the future to have a log of the commands I executed and a verbose output of the results.

I install the smp_utils

yum install smp_utils

Check things:

ls -al  /dev/bsg/
total 0drwxr-xr-x.  2 root root     3020 May 22 10:16 .
drwxr-xr-x. 20 root root     8680 May 22 10:16 ..
crw-------.  1 root root 248,  76 May 22 10:00 1:0:0:0
crw-------.  1 root root 248, 126 May 22 10:00 10:0:0:0
crw-------.  1 root root 248, 127 May 22 10:00 10:0:1:0
crw-------.  1 root root 248, 136 May 22 10:00 10:0:10:0
crw-------.  1 root root 248, 137 May 22 10:00 10:0:11:0
crw-------.  1 root root 248, 138 May 22 10:00 10:0:12:0
crw-------.  1 root root 248, 139 May 22 10:00 10:0:13:0
[...]
[root@4602Carles10 ~]# smp_discover /dev/bsg/expander-1:0
[...]
[root@4602Carles10 ~]# smp_discover /dev/bsg/expander-1:1

I check for errors in the expander that could justify the problems of performance:

for i in `seq 0 64`; do smp_rep_phy_err_log -p $i /dev/bsg/expander-1\:0 ; done
Report phy error log response:
  Expander change count: 567
  phy identifier: 0
  invalid dword count: 0
  running disparity error count: 0
  loss of dword synchronization count: 0
  phy reset problem count: 0
[...]
Report phy error log response:
  Expander change count: 567
  phy identifier: 52
  invalid dword count: 168
  running disparity error count: 172
  loss of dword synchronization count: 5
  phy reset problem count: 0
Report phy error log response:
  Expander change count: 567
  phy identifier: 53
  invalid dword count: 6
  running disparity error count: 6
  loss of dword synchronization count: 0
  phy reset problem count: 0
Report phy error log response:
  Expander change count: 567
  phy identifier: 54
  invalid dword count: 267
  running disparity error count: 270
  loss of dword synchronization count: 4
  phy reset problem count: 0
Report phy error log response:
  Expander change count: 567
  phy identifier: 55
  invalid dword count: 127
  running disparity error count: 131
  loss of dword synchronization count: 5
  phy reset problem count: 0
Report phy error log result: Phy vacant

There are some errors, and I check with the Hardware Team, which pass a battery of tests on the machine and say that the machine passes. They tell me that if the errors counted were in order of millions then it would be a problem, but having few of them is usual.

My colleagues previously reported that the memory was performing well, and the CPU too. They told me that the speed was exactly double respect a platform with one single CPU of the same kind.

Even if they told me that, I ran cmips tests to make sure.

git clone https://github.com/cmips/cmips_bin

It scored 16,000. The performance was Ok in general terms but the problem is that I didn’t have a baseline for that processor in single processor, so I cannot make sure that the memory bandwidth was Ok. The performance was less that an Amazon c3.8xlarge. The system I was testing is a two processor system, but each CPU is cheap, around USD $400.

Still my gut feeling was telling me that this double processor server should score more.

lscpu
[root@DRAID-1135-14TB-2CPU ~]# lscpu
 Architecture:          x86_64
 CPU op-mode(s):        32-bit, 64-bit
 Byte Order:            Little Endian
 CPU(s):                32
 On-line CPU(s) list:   0-31
 Thread(s) per core:    2
 Core(s) per socket:    8
 Socket(s):             2
 NUMA node(s):          2
 Vendor ID:             GenuineIntel
 CPU family:            6
 Model:                 79
 Model name:            Intel(R) Xeon(R) CPU E5-2620 v4 @ 2.10GHz
 Stepping:              1
 CPU MHz:               2299.951
 CPU max MHz:           3000.0000
 CPU min MHz:           1200.0000
 BogoMIPS:              4199.73
 Virtualization:        VT-x
 L1d cache:             32K
 L1i cache:             32K
 L2 cache:              256K
 L3 cache:              20480K
 NUMA node0 CPU(s):     0-7,16-23
 NUMA node1 CPU(s):     8-15,24-31
 Flags:                 fpu vme de pse tsc msr pae mce cx8 apic sep mtrr pge mca cmov pat pse36 clflush dts acpi mmx fxsr sse sse2 ss ht tm pbe syscall nx pdpe1gb rdtscp lm constant_tsc arch_perfmon pebs bts rep_good nopl xtopology nonstop_tsc aperfmperf eagerfpu pni pclmulqdq dtes64 monitor ds_cpl vmx smx est tm2 ssse3 sdbg fma cx16 xtpr pdcm pcid dca sse4_1 sse4_2 x2apic movbe popcnt tsc_deadline_timer aes xsave avx f16c rdrand lahf_lm abm 3dnowprefetch epb cat_l3 cdp_l3 intel_ppin intel_pt ibrs ibpb stibp tpr_shadow vnmi flexpriority ept vpid fsgsbase tsc_adjust bmi1 hle avx2 smep bmi2 erms invpcid rtm cqm rdt_a rdseed adx smap xsaveopt cqm_llc cqm_occup_llc cqm_mbm_total cqm_mbm_local dtherm ida arat pln pts spec_ctrl intel_stibp

I check the memory configuration with:

dmidecode -t memory

I examined the results, I see that the processor can only operate the DDR4 ECC 2400 Memory at 2133 and… I see something!. This Controller before was a single processor with 2 Memory Sticks of 16GB each, dual rank.

I see that now I have the same number of sticks in that machine, but I have two CPU!. So 2 Memory sticks in total, for 2 CPU.

That’s no good. The memory must be in pairs and in the right slots to get the maximum performance.

1 memory module for 1 CPU doesn’t allow to have Dual Channel and probably is affecting the performance. Many Servers will not even boot if you add an odd number of memory sticks per CPU.

And many Servers can operate at full speed only if all the banks are filled.

I request to the Engineers in Silicon Valley to add 4 modules in the right slots. They did, and I repeated the tests and the performance was doubled then.

After some days I had some time with the machine, I repeated the test and I got a CMIPS Score of around 20,000.

Multiprocessor world is far more complicated than single processor. Some times things can work not as expected, and not be evident, for example cache pipeline can act diferent for a program working in multiprocessor and single processor. Or the QPI could be saturated.

After this I shared my forensics document with as many Engineers as I could, so they could learn how I did to troubleshot the problem, and what was the origin of it, and I asked them to do the same so we can track their steps and progress if something needs to be troubleshoot.

After proper intensive testing the Server was qualified. Lesson here is that changes cannot be commited quickly, need their time.

Upgrading the Blog after 5 years, AWS Amazon Web Services, under DoS and Spam attacks

Few days ago I was under a heavy DoS attack.

Nothing new, zombie computers, hackers, pirates, networks of computers… trying to abuse the system and to hack into it. Why? There could be many reasons, from storing pirate movies, trying to use your Server for sending Spam, try to phishing or to host Ransomware pages…

Most of those guys doesn’t know that is almost impossible to Spam from Amazon. Few emails per hour can come out from the Server unless you explicitly requests that update and configure everything.

But I thought it was a great opportunity to force myself to update the Operating System, core tools, versions of PHP and MySql.

Forensics / Postmortem of the incident

The task was divided in two parts:

  • Understanding the origin of the attack
  • Blocking the offending Ip addresses or disabling XMLRPC
  • Making the VM boot again (problems with Amazon AWS)
    • I didn’t know why it was not booting so.
  • Upgrading the OS

I disabled the access to the site while I was working using Amazon Web Services Firewall. Basically I turned access to my ip only. Example: 8.8.8.8/32

I changed 0.0.0.0/0 so the world wide mask to my_Ip/3

That way the logs were reflecting only what I was doing from my Ip.

Dealing with Snapshots and Volumes in AWS

Well the first thing was doing an Snapshot.

After, I tried to boot the original Blog Server (so I don’t stop offering service) but no way, the Server appeared to be dead.

So then I attached the Volume to a new Server with the same base OS, in order to extract (dump) the database. Later I would attach the same Volume to a new Server with the most recent OS and base Software.

Something that is a bit annoying is that the new Instances, the new generation instances, run only in VPC, not in Amazon EC2 Classic. But my static Ip addresses are created for Amazon EC2 Classic, so I could not use them in new generation instances.

I choose the option to see all the All the generations.

Upgrading the system base Software had its own challenges too.

Upgrading the OS / Base Software

My approach was to install an Ubuntu 18.04 LTS, and install the base Software clean, and add any modification I may need.

I wanted to have all the supported packages and a recent version of PHP 7 and the latest Software pieces link Apache or MySQL.

sudo apt update

sudo apt install apache2

sudo apt install mysql-server

sudo apt install php libapache2-mod-php php-mysql

Apache2

Config files that before were working stopped working as the new Apache version requires the files or symlinks under /etc/apache2/sites-enabled/ to end with .conf extension.

Also some directives changed, so some websites will not able to work properly.

Those projects using my Catalonia Framework were affected, although I have this very well documented to make it easy to work with both versions of Apache Http Server, so it was a very straightforward change.

From the previous version I had to change my www.cataloniaframework.com.conf file and enable:

    <Directory /www/www.cataloniaframework.com>
Options Indexes FollowSymLinks MultiViews
AllowOverride All
Order allow,deny
allow from all
</Directory>

Then Open the ports for the Web Server (443 and 80).

sudo ufw allow in "Apache Full"

Then service apache restart

Catalonia Framework Web Site, which is also created with Catalonia Framework itself once restored

MySQL

The problem was to use the most updated version of the Database. I could use one of the backups I keep, from last week, but I wanted more fresh data.

I had the .db files and it should had been very straightforward to copy to /var/lib/mysql/ … if they were the same version. But they weren’t. So I launched an instance with the same base Software as the old previous machine had, installed mysql-server, stopped it, copied the .db files, started it, and then I made a dump with mysqldump –all-databases > 2019-04-29-all-databases.sql

Note, I copied the .db files using the mythical mc, which is a clone from Norton Commander.

Then I stopped that instance and I detached that volume and attached it to the new Blog Instance.

I did a Backup of my original /var/lib/mysql/ files for the purpose of faster restoring if something went wrong.

I mounted it under /mnt/blog_old and did mysql -u root -p < /mnt/blog_old/home/ubuntu/2019-04-29-all-databases.sql

That worked well I had restored the blog. But as I was watching the /var/log/mysql/error.log I noticed some columns were not where they should be. That’s because inadvertently I overwritten the MySql table as well, which in MySQL 5.7 has different structure than in MySQL 5.5. So I screwed. As I previewed this possibility I restored from the backup in seconds.

So basically then I edited my .sql files and removed all that was for the mysql database.

I started MySql, and run the mysql import procedure again. It worked, but I had to recreate the users for all the Databases and Grant them permissions.

GRANT ALL PRIVILEGES ON db_mysqlproxycache.* TO 'wp_dbuser_mysqlproxy'@'localhost' IDENTIFIED BY 'XWy$&{yS@qlC|<¡!?;:-ç';

PHP7

Some modules in my blogs where returning errors in /var/log/apache2/mysite-error.log so I checked that it was due to lack of support of latest PHP versions, and so I patched manually the code or I just disabled the offending plugin.

WordPress

As seen checking the /var/log/apache2/blog.carlesmateo.com-error.log some URLs where not located by WordPress.

For example:

The requested URL /wordpress/wp-json/ was not found on this server

I had to activate modrewrite and then restart Apache.

a2enmod rewrite; service apache2 restart

Making the site more secure

Checking at the logs of Apache, /var/log/apache2/blog.carlesmateo.com-access.log I checked for Ip’s accessing Admin areas, I looked for 404 Errors pointing to intents to exploit any unsafe WP Plugin, I checked for POST protocol as well.

I added to the Ubuntu Uncomplicated Firewall (UFW) the offending Ip’s and patched the xmlrpc.php file to exit always.

Dropping caches in Linux, to check if memory is actually being used

I encountered that Server, Xeon, 128 GB of RAM, with those 58 Spinning drives 10 TB and 2 SSD of 2 TB each, where I was testing the latest version of my Software.

Monitoring long term tests, data validation, checking for memory leaks…
I notice the Server is using 70 GB of RAM. Only 5.5 GB are used for buffers according to the usual tools (top, htop, free, cat /proc/meminfo, ps aux…) and no programs are eating that amount, so where is the RAM?.
The rest of the Servers are working well, including models: same mode, 4U60 with 64 GB of RAM, 4U90 with 128 GB and All-Flash-Array with 256 GB of RAM, only using around 8 GB of RAM even under load.
iSCSI sharings being used, with I/O, iSCSI initiators trying to connect and getting rejected, several requests for second, disk pulling, and that usual stuff. And this is the only unit using so many memory, so what?.
I checked some modules to see memory consumption, but nothing clear.
Ok, after a bit of investigation one member of the Team said “Oh, while you was on holidays we created a Ramdisk and filled it for some validations, we deleted that already but never rebooted the Server”.
Ok. The easy solution would be to reboot, but that would had hidden a memory leak it that was the cause.
No, I had to find the real cause.

I requested assistance of one my colleagues, specialist, Kernel Engineer.
He confirmed that processes were not taking that memory, and ask me to try to drop the cache.

So I did:

sync
echo 3 > /proc/sys/vm/drop_caches

Then the memory usage drop to 11.4 GB and kept like that while I maintain sustained the load.

That’s more normal taking in count that we have 16 Volumes shared and one host is attempting to connect to Volumes that do not exist any more like crazy, Services and Cronjobs run in background and we conduct tests degrading the pool, removing drives, etc..

After tests concluded memory dropped to 2 GB, which is what we use when we’re not under load.

Note: In order to know about the memory being used by Kernel slab cache in real time you can use command:

 slabtop

You can also check:

sudo vmstat -m

Solving an infinite loop in CentOS after inducing a Kernel Panic in a Server

This trick may be useful for you.
Almost surely if you power cycle, completely powering down your Server you’ll fix booting too.
Unfortunately we do not always have access to the Data Center or Remote Hands service available, so this trick may be useful for you.

Just reset your BMC card with this:

ipmitool -H 172.30.30.7 -U admin -P thepassword bmc reset cold

After this use the remote control tool to request a reboot and it will do and power on normally.

This may not work in all the Servers, it depends on a lot of aspects (firmware, bmc manufacturer, etc…) but can do the trick for you maybe.

Create a small partition on the drives for tests

Ok, as you know I work with ZFS, DRAID, Erasure Coding… and Cold Storage.
I work with big disks, SAS, SSD, and NVMe.
Sometimes I need to conduct some tests that involve filling completely to 100% the pool.
That’s very slow having to fill 14TB drives, with Servers with 60, 90 and 104 drives, for obvious reasons. So here is a handy script for partitioning those drives with a small partition, then you use the small partition for creating a pool that will fill faster.

1. Get the list of drives in the system
For example this script can help

DRIVES=`ls -al /dev/disk/by-id/ | grep "sd" | grep -v "part" | grep "wwn" | tr "./" "  " | awk '{ print $11; }'`

If your drives had a previous partition this script will detect them, and will use only the drives with wwn identifier.
Warning: some M.2 booting drives have wwn where others don’t. Use with caution.

2. Identify the boot device and remove from the list
3. Do the loop with for DRIVE in $DRIVES or manually:

for DRIVE in sdar sdcd sdi sdj sdbp sdbd sdy sdab sdbo sdk sdz sdbb sdl sdcq sdbl sdbe sdan sdv sdp sdbf sdao sdm sdg sdbw sdaf sdac sdag sdco sds sdah sdbh sdby sdbn sdcl sdcf sdbz sdbi sdcr sdbj sdd sdcn sdr sdbk sdaq sde sdak sdbx sdbm sday sdbv sdbg sdcg sdce sdca sdax sdam sdaz sdci sdt sdcp sdav sdc sdae sdf sdw sdu sdal sdo sdx sdh sdcj sdch sdaw sdba sdap sdck sdn sdas sdai sdaa sdcs sdcm sdcb sdaj sdcc sdad sdbc sdb sdq
do
(echo g; echo n; echo; echo; echo 41984000; echo w;) | fdisk /dev/$DRIVE
done

Simulating a SAS physical pull out of a drive

Please, note:
Nothing is exactly the same as a physical disk pull.
A physical disk pull can trigger errors by the expander that will not be detected just emulating.
Hardware failures are complex, so you should not avoid testing physically.
If your company has the Servers in another location you should request them to have Servers next to you, or travel to the location and spend enough time hands on.

A set of commands very handy for simulating a physical drive pull, when you have not physical access to the Server, or working within a VM.

To delete a disk (Linux stop seeing it until next reboot/power cycle):

echo "1" > /sys/block/${device_name}/device/delete

Set a disk offline:

echo "offline" > /sys/block/${device_name}/device/state

Online the disk

echo "running" > /sys/block/${device_name}/device/state

Scan all hosts, rescan

for host in /sys/class/scsi_host/host*; do echo '- - -' > $host/scan; done

Disabling the port in the expander

This is more like physically pulling the drive.
In order to use the commands, install the package smp_utils. This is now
installed on the 4602 and the 4U60.

The command to disable a port on the expander:

smp_phy_control --phy=${phy_number} --op=dis /dev/bsg/${expander_id}

You will need to know the phy number of the drive. There may be a better
way, but to get it I used:

smp_discover /dev/bsg/${expander_id}

You need to look for the sas_address of the drive in the output from the
smp_discover command. You may need to try all the expanders to find it.

You can get the sas_address for your drive by:

cat /sys/block/${device_name}/device/sas_address

To re-enable the port use:

smp_phy_control --phy=${phy_number} --op=lr /dev/bsg/${expander_id}

Some handy scripts when working with ZFS

To kill one drive given the id (device name may change between reboots)

TO_REMOVE="wwn-0x5000c500a6134007"
DRIVE=`ls -al /dev/disk/by-id/ | grep ${TO_REMOVE} | grep -v "\-part" | awk '{ print $11 }' | tr --delete './'`; 

if [[ ! -z "${DRIVE}" ]];
then
    echo "1" > /sys/block/${DRIVE}/device/delete
else
    echo "Drive not found"
fi

Loop to see the status of the pool

while true; do zpool status carles-N58-C3-D16-P3-S1 | head --lines=20; sleep 5; done

Linux command-line tools I usually install

Some additional command-line tools that I use to install and use on my text client Systems. Initially here were not listed commands that are shipped with every Linux, but the additional tools I install in every Workstation or Server.

Apache benchmarks (ab)

To stress a Web Server

atop

A good complement to htop, iftop… monitoring tools

bzip2

Cool compressor better than gzip and that also accepts streams.

cfdisk

Nice tool to work with partitions through modern menus.

ctop

Command line / text based Linux Containers monitoring tool.

If you use docker stats, ctop is much better.

ctop.py

My own moniroring too.

dmidecode

Is the dmi Table decoder.

For example: dmidecode -t memory

dstat

Very nice System Stats tool. You can specify individual stats, like a drive.

edac-util

Error reporting utility

edac-util --verbose
mc0: 0 Uncorrected Errors with no DIMM info
mc0: 0 Corrected Errors with no DIMM info
mc0: csrow0: 0 Uncorrected Errors
mc0: csrow0: CPU_SrcID#0_MC#0_Chan#0_DIMM#0: 0 Corrected Errors
mc0: csrow0: CPU_SrcID#0_MC#0_Chan#1_DIMM#0: 0 Corrected Errors
mc0: csrow0: CPU_SrcID#0_MC#0_Chan#2_DIMM#0: 0 Corrected Errors
mc1: 0 Uncorrected Errors with no DIMM info
mc1: 0 Corrected Errors with no DIMM info
mc1: csrow0: 0 Uncorrected Errors
mc1: csrow0: CPU_SrcID#0_MC#1_Chan#0_DIMM#0: 0 Corrected Errors
mc1: csrow0: CPU_SrcID#0_MC#1_Chan#1_DIMM#0: 0 Corrected Errors
mc1: csrow0: CPU_SrcID#0_MC#1_Chan#2_DIMM#0: 0 Corrected Errors
mc2: 0 Uncorrected Errors with no DIMM info
mc2: 0 Corrected Errors with no DIMM info
mc2: csrow0: 0 Uncorrected Errors
mc2: csrow0: CPU_SrcID#1_MC#0_Chan#0_DIMM#0: 0 Corrected Errors
mc2: csrow0: CPU_SrcID#1_MC#0_Chan#1_DIMM#0: 0 Corrected Errors
mc2: csrow0: CPU_SrcID#1_MC#0_Chan#2_DIMM#0: 0 Corrected Errors
mc3: 0 Uncorrected Errors with no DIMM info
mc3: 0 Corrected Errors with no DIMM info
mc3: csrow0: 0 Uncorrected Errors
mc3: csrow0: CPU_SrcID#1_MC#1_Chan#0_DIMM#0: 0 Corrected Errors
mc3: csrow0: CPU_SrcID#1_MC#1_Chan#1_DIMM#0: 0 Corrected Errors
mc3: csrow0: CPU_SrcID#1_MC#1_Chan#2_DIMM#0: 0 Corrected Errors

ethtool

ethtool

fatrace
Reports file access events from all running processes in real time.

flock
With flock several processes can have a shared lock at the same time, or be waiting to acquire a write lock. With lslocks from util-linux package you can get a list of these processes.

fstrim

discard unused blocks on a mounted filesystem (local or remote). Is useful for freeing blocks no longer used in ZFS zvols. That can also be achieved by mount -o discard

fuser
Show which processes use the named files, sockets, or filesystems.

git

glances

A tool for monitoring similar to ctop and htop.

hdparm
Get/set SATA/IDE device parameters

htop

An improved top

httpie

A http client.

id (configure to query OpenLDAP)

ifmetrics

To set the metrics of all IPV4 routes attached to a given network interface

ifstat

Pretty network interfaces stats.

iftop

To watch metrics for a network interface (or wireless)

iftop-wlan0

iostat

CPU and IO devices stats. I modified some collectors for telegraf and influxdb consumed by grafana for fetching the Write KB/s, Read KB/s, Bandwidth of the Magnetic Spinning drives and SSD during declustered rebuild.

iotop

iperf

Perform network throughput tests

ipmitool

iptables

iscsiadm

java (jre Oracle and OpenJDK)

journalctl

ldap-utils

ldapsearch and the other tools to work with LDAP.

less
According to manpages, the opposite of more. :)
What it does is display a file, and you can scroll up/down, you can search for patterns…
Examples:
cat /etc/passwd | less
less /etc/passwd
# -n doesn’t count the lines, to save time
# For a specific Offset
less -n +500000000P /var/log/apache2/giant.log
# For 50% point
less -n +50p /var/log/apache2/giant.log

lrzip /lrztar

Compressor that compresses very efficiently big files, specially GB of of source code.

lrzsz (Zmodem)

An utility to send files to the Server through a terminal.

Very useful when you don’t want to scp or rsftp, for example because that requires MFA  (Multi Factor Authentication) to be performed again and you already have a session open.

Moba xTerm for Windows is one of the Terminal clients that accepts Upload/Download of Z-modem

Moba xTerm for Windows is one of the Terminal clients that accepts Upload/Download of Z-modem

apt install lrzsz

lsblk

List the block devices. Also is handy blkid but you can get this from /dev/disk/by-id/

lynx

Text browser. really handy.

ltrace
To trace library calls.

mc

Midnight Commander

mc


md5sum

memtester

Basically for testing Memory.

This will allocate 4GB of RAM and run the test 10 times.

sudo memtester 4096 10

mtr

Network tool mix between ping and traceroute.

mytop

To see in real time queries and slow queries to mysql

ncdu

Show the space used by any directory and subdirectory

ncdu

ncdu-2

nginx (fpm-php) and apache

The webservers

nfs client

nmon

Offers monitoring of different aspects: Network, Disk, Processes…

open-vpn

openssh-server

parted

Partition manipulation

perf

Performance profiler.

Ie:
perf top
perf stat ls

PHP + curl + mysql (hhvm)

pixz

A parallel, multiprocessor, variant of gzip/bzip2 that can leverage several processors to speed up the compression over files.

If the input looks like a tar archive, it also creates an index of all the files in the archive. This allows the extraction of only a small segment of the tarball, without needing to decompress the entire archive.

postcat

postcat -q ID shows the details of a message in the queue

python-pip and pypy

pv
Pipe Viewer – is a terminal-based tool for monitoring the progress of data through a pipeline. It can be inserted into any normal pipeline between two processes to give a visual indication of how quickly data is passing through, how long it has taken, how near to completion it is, and an estimate of how long it will be until completion.

dd if=/dev/urandom | pv | dd of=/dev/null

Output:

1,74MB 0:00:09 [ 198kB/s] [      <=>                               ]

Probably you’ll prefer to use dd with status=progress option, it’s just a sample.

qshape

It shows the composition of the mail queue.

screen

sdparm
Access SCSI modes pages; read VPD pages; send simple SCSI commands

sfdisk

Utility to work with partitions that can export and import configs through STDIN and STDOUT to automate partitions operations.

slabtop
Displays Kernel slab cache information in real time.

smartctl

Utility for dealing with the S.M.A.R.T. features of the disks, knowing errors…

split
Split a file into several, based by text lines, or binary: number of bytes per file.

sha512sum

sshfs

Mount a mountpoint on a remote Server by using SSH.

sshpass
SSH without typing the password. -f for reading it from a file.
sshpass -p “mypassword” ssh -o StrictHostKeyChecking=no root@10.251.35.251

In this sample passing the command ls, so this will be executed, and logout.
sshpass -p “mypassword” ssh -o StrictHostKeyChecking=no root@10.251.35.251 ls

sshuttle

A poor’s man VPN through SSH that is available for Linux and Mac OS X.

E.g.: sudo sshuttle -r carles@8.8.1.234:8275 172.30.0.0/16

Sshuttle forwards TCP and DNS but does not forward UDP or ICMP. So ping or ipmi protocol won’t work. But it does work for http, https, ssh…

Nice article on tunneling only certain things here.

strace

To trace the system calls and signals.
To redirect the output to another process use:
strace zpool status 2>&1 | less

stress-ng

Basically to stress Servers.

strings

Shows only strings from a file (normally a Binary)

From package binutils.

subversion svn

systemd-cgtop and systemd-analyze

tcpdump

To see the traffic to your NIC

tcptraceroute

TCP/IP Traceroure. Targets ports so you can use it to see if port is open too.

tee

Reads from sdtin and sends to a file and outputs to stdout as well.
For example:

find . -mtime -1 -print | grep -v "/logs/" 2>&1 | tee /var/log/results.log

timeout
Kills the process after the indicated timeout.

timeout 1000 dd if=/dev/urandom of=/dev/zvol/carles-N51-C5-D8-P2-S1/gb1000

tracepath

traceroute

tree

Tree simply shows the directory hierarchy in a graphical (text mode) way. Useful to see where files and subfolders are.

xxd
Make a hexdump or do the reverse

sudo xxd /dev/nvme0n1p1 | less

zcat
Just like cat, but for compressed filed.

zcat logs.tar.gz | grep "Error"
zcat logs.tar.gz | less

zless

zram-config

Sergey Davidoff stumbled upon a project called compcache that creates a RAM based block device which acts as a swap disk, but is compressed and stored in memory instead of swap disk (which is slow), allowing very fast I/O and increasing the amount of memory available before the system starts swapping to disk. compcache was later re-written under the name zRam and is now integrated into the Linux kernel.

http://www.webupd8.org/2011/10/increased-performance-in-linux-with.html

watch

Whatch allow you to execuate a command and what it (refresh it) at a given intervals, for example every two seconds.
For example, if normally I would do:

 while [ true ]; do zpool status | head -n10 ; sleep 10; done 
 while [ true ]; do df -h; sleep 60; done 
while [ true ]; do ls -al /tmp | head -n5 ; sleep 2; done 

Then I can do:

watch -n10 zpool status

Or:

watch -n60 df -h

Or

watch "ls -al /tmp | head -n5"

For my Dockers, and cloudinit with Ubuntu, my defaults are:

apt update; apt install htop mc ncdu strace git binutils

Stopping definitively the massive Distributed DoS attack

I explain some final information and tricks and definitive guidance so you can totally stop the DDoS attacks affecting so many sites.

After effectively mitigating the previous DDoS Torrent attack to a point that was no longer harmful, even with thousands of requests, I had another surprise.

It was the morning when I had a brutal increase of the attacks and a savage spike of traffic and requests of different nature, so in addition to the BitTorent attack that never stopped but was harmful. I was on route to the work when the alarms raised into my smartphone. I stopped in a gas station, and started to fix it from the car, in the parking area.

Service was irresponsible, so first thing I did was to close the Firewall (from the Cloud provider panel) to HTTP and HTTPS to the Front Web Servers.

Immediately after that I was able to log in via SSH to the Servers. I tried to open HTTPS for our customers and I was surprised that most of the traffic was going through HTTPS. So I closed both, I called the CEO of the company to give status, and added a rule to the Firewall so the staff on the company would be able to work against the Backoffice Servers and browse the web while I was fixing all the mess. I also instructed my crew and gave instructions to support team to help the business users and to deal with customers issues while I was stopping the attack.

I saw a lot of new attacks in the access logs.

For example, requests like coming from Android SDK. Weird.

I blocked those by modifying the index.php (code in the previous article)

// Patch urgency Carles to stop an attack based on Torrent and exploiting sdk's
// http://blog.carlesmateo.com
if (isset($_GET['info_hash']) || (isset($_GET['format']) && isset($_GET['sdk'])) || (isset($_GET['format']) && isset($_GET['id']))) {

(Note: If your setup allows it and the HOST requested is another (attacks to ip), you can just check requestes HOST and block what’s different, or if not also implement an Apache rule to divert all the traffic to that route (like /announce for Bittorrent attack) to another file.)

Then, with the cron blocking the ip addresses all improved.

Problem was that I was receiving thousands of requests per second, and so, adding those thousands of Ip’s to IPTABLES was not efficient, in fact was so slow, that the process was taking more than an hour. The server continued overwhelmed with thousands of new ip’s per second while it was able to manage to block few per second (and with a performance adding ip’s degraded since the ip number 5,000). It was not the right strategy to fight back this attack.

Some examples of weird traffic over the http logs:

119.63.196.31 - - [01/Feb/2015:06:54:12 +0100] "GET /video/iiiOqybRvsM/images/av
atar/0097.jpg HTTP/1.1" 404 499 "-" "Baiduspider-image+(+http://www.baidu.com/se
arch/spider.htm)\\nReferer: http://image.baidu.com/i?ct=503316480&z=0&tn=baiduim
agedetail"
119.63.196.126 - - [01/Feb/2015:07:15:48 +0100] "GET /video/Ig3ebdqswQI/images/avatar/0114.jpg HTTP/1.1" 404 499 "-" "Baiduspider-image+(+http://www.baidu.com/search/spider.htm)\\nReferer: http://image.baidu.com/i?ct=503316480&z=0&tn=baiduimagedetail"
180.153.206.20 - - [30/Jan/2015:06:34:34 +0100] "GET /contents/all/tokusyu/skin_detail.html HTTP/1.1" 404 492 "-" "Mozilla/4.0"
180.153.206.20 - - [30/Jan/2015:06:34:35 +0100] "GET /contents/gift/ban_gift/skin_gift.js HTTP/1.1" 404 490 "http://top.dhc.co.jp/contents/gift/ban_gift/skin_gift.js" "Mozilla/4.0"
180.153.206.20 - - [30/Jan/2015:06:34:36 +0100] "GET /contents/all/content/skin.js HTTP/1.1" 404 483 "http://top.dhc.co.jp/contents/all/content/skin.js" "Mozilla/4.0
220.181.108.105 - - [30/Jan/2015:06:35:22 +0100] "GET /image/DbLiteGraphic/201405/thumb_14773360.jpg?1414567871 HTTP/1.1" 404 505 "http://image.baidu.com/i?ct=503316480&z=0&tn=baiduimagedetail" "Baiduspider-image+(+http://www.baidu.com/search/spider.htm)"
118.249.207.5 - - [30/Jan/2015:06:39:26 +0100] "GET /widgets.js HTTP/1.1" 404 0 "http://www.javlibrary.com/cn/vl_star.php?&mode=&s=azgcg&page=2" "Mozilla/5.0 (MSIE 9.0; qdesk 2.4.1266.203; Windows NT 6.1; WOW64; Trident/7.0; rv:11.0; QQBrowser/8.0.3197.400) like Gecko"
120.197.109.101 - - [30/Jan/2015:06:57:20 +0100] "GET /ads/2015/20minutes/publishing/stval/3001.html?pos=6 HTTP/1.1" 404 542 "-" "20minv3/6 CFNetwork/609.1.4 Darwin/13.0.0"
101.226.33.221 - - [30/Jan/2015:07:00:04 +0100] "GET /?LR_PUBLISHER_ID=29877&LR_SCHEMA=vast2-vpaid&LR_PARTNERS=758858&LR_CONTENT=1&LR_AUTOPLAY=1&LR_URL=http://play.retroogames.com/penguin-hockey-lite/?pc1oibq9f5&utm_source=4207933&entId=7a6c6f60cd27700031f2802842eb2457b46e15c0 HTTP/1.1" 200 11783 "http://play.retroogames.com/penguin-hockey-lite/?pc1oibq9f5&utm_source=4207933&entId=7a6c6f60cd27700031f2802842eb2457b46e15c0" "Mozilla/4.0"
180.153.206.20 - - [30/Jan/2015:07:03:10 +0100] "GET /?metric=csync&p=3030&s=6109924323866574861 HTTP/1.1" 200 11783 "http://v.youku.com/v_show/id_XODYzNzA0NTk2.html" "Mozilla/4.0"
180.153.114.199 - - [30/Jan/2015:07:05:18 +0100] "GET /?LR_PUBLISHER_ID=78817&LR_SCHEMA=vast2-vpaid&LR_PARTNERS=763110&LR_CONTENT=1&LR_AUTOPLAY=1&LR_URL=http://www.dnd.com.pk/free-download-malala-malala-yousafzai HTTP/1.1" 200 11783 "http://www.dnd.com.pk/free-download-malala-malala-yousafzai" "Mozilla/4.0"
60.185.249.230 - - [30/Jan/2015:07:08:20 +0100] "GET /scrape.php?info_hash=8%e3Q%9a%9c%85%bc%e3%1d%14%213wNi3%28%e9%f0. HTTP/1.1" 404 459 "-" "Transmission/2.77"
180.153.236.129 - - [30/Jan/2015:07:11:10 +0100] "GET /c/lf-centennial-services-hong-kong-limited/hk041664/ HTTP/1.1" 404 545 "http://hk.kompass.com/c/lf-centennial-services-hong-kong-limited/hk041664/" "Mozilla/5.0 (compatible; MSIE 9.0; Windows NT 6.1; Trident/5.0); 360Spider(compatible; HaosouSpider; http://www.haosou.com/help/help_3_2.html)"
36.106.38.13 - - [30/Jan/2015:07:18:28 +0100] "GET /op/icon?id=com.wsw.en.gm.ArrowDefense HTTP/1.1" 404 0 "-" "Apache-HttpClient/UNAVAILABLE (java 1.4)"
180.153.114.199 - - [30/Jan/2015:07:19:12 +0100] "GET /?metric=csync&p=3030&s=6109985239380459533 HTTP/1.1" 200 11783 "http://vox-static.liverail.com/swf/v4/admanager.swf" "Mozilla/4.0"
180.153.206.20 - - [30/Jan/2015:07:39:56 +0100] "GET /?metric=csync HTTP/1.1" 20
0 11783 "http://3294027.fls.doubleclick.net/activityi;src=3294027;type=krde;cat=
krde_060;ord=94170148950.07014?" "Mozilla/4.0"
220.181.108.139 - - [30/Jan/2015:07:47:08 +0100] "GET /asset/assetId/5994450/size/large/ts/1408882797/type/library/client/WD-KJLAK/5994450_large.jpg?token=4e703a62ec08791e2b91ec1731be0d13&category=pres&action=thumb HTTP/1.1" 404 550 "http://www.passion-nyc.com/" "Baiduspider-image+(+http://www.baidu.com/search/spider.htm)"

And over HTTPS:

120.197.26.43 - - [29/Jan/2015:00:04:25 +0100] "GET /c/5356/cc.js?ns=_cc5356 HTTP/1.1" 404 11676 "http://m.accuweather.com/zh/cn/guangzhou/102255/current-weather/102255?p=huawei2" "HUAWEI Y325-T00_TD/V1 Linux/3.4.5 Android/2.3.6 Release/03.26.2013 Browser/AppleWebKit533.1 Mobile Safari/533.1;"
120.197.26.43 - - [29/Jan/2015:00:05:32 +0100] "GET /c/5356/cc.js?ns=_cc5356 HTTP/1.1" 404 11674 "http://m.accuweather.com/zh/cn/guangzhou/102255/weather-forecast/102255" "HUAWEI Y325-T00_TD/V1 Linux/3.4.5 Android/2.3.6 Release/03.26.2013 Browser/AppleWebKit533.1 Mobile Safari/533.1;"
117.136.1.106 - - [29/Jan/2015:06:35:05 +0100] "GET /v2.2/237613769760602?format=json&sdk=android&fields=supports_attribution%2Csupports_implicit_sdk_logging%2Cgdpv4_nux_content%2Cgdpv4_nux_enabled%2Candroid_dialog_configs HTTP/1.1" 404 6304 "-" "FBAndroidSDK.3.20.0"
117.136.1.106 - - [29/Jan/2015:06:35:11 +0100] "GET /v2.2/237613769760602?format=json&sdk=android&fields=supports_attribution%2Csupports_implicit_sdk_logging%2Cgdpv4_nux_content%2Cgdpv4_nux_enabled%2Candroid_dialog_configs HTTP/1.1" 404 6308 "-" "FBAndroidSDK.3.20.0"
117.136.1.107 - - [29/Jan/2015:06:35:36 +0100] "GET /v2.2/1493038024241481?fields=name,supports_implicit_sdk_logging,gdpv4_nux_enabled,gdpv4_nux_content,ios_dialog_configs,app_events_feature_bitmask&format=json&sdk=ios HTTP/1.1" 404 6731 "-" "FBiOSSDK.3.22.0"
180.175.55.177 - public [29/Jan/2015:07:40:23 +0100] "GET /public/checksum?a=8&t=p&v=2.5.0&c=d62c8d04f74057d51872d5dc5cdab098 HTTP/1.0" 404 39668 "https://rc-regkeytool.appspot.com/public/checksum?a=8&t=p&v=2.5.0&c=d62c8d04f74057d51872d5dc5cdab098" "Mozilla/5.0 (iPhone; U; CPU like Mac OS X; en) AppleWebKit/420+ (KHTML, like Gecko) Version/3.0 Mobile/1C28 Safari/419.3"

So, I was seeing requests that typically do applications like Facebook, smartphones with Android going to google store, and a lot of other applications and sites traffics, that was going diverted to my Ip.

So I saw that this attack was an attack associated to the ip address. I could change the ip in an extreme case and gain some hours to react.

So if those requests were coming from legitimate applications I saw two possibilities:

1. A zombie network controlled by pirates through malware/virus, that changes the /etc/hosts so those devices go to my ip address. Unlikely scenario, as there was a lot of mobile traffic and is not the easiest target of those attacks

2. A Dns Spoofing attack targeting our ip’s

That is an attack that cheats to Dns servers to make them believe that a name resolves to a different ip. (that’s why ssl certificates are so important, and the warnings that the browser raises if the server doesn’t send the right certificate, it allows you to detect that you’re connecting to a fake/evil server and avoid logging etc… if you have been directed a bad ip by a dns poisoned)

I added some traces to get more information, basically I dump the $_SERVER to a file:

$s_server_dump = var_export($_SERVER, true);

file_put_contents($s_debug_log_file, $s_server_dump.”\n”, FILE_APPEND | LOCK_EX);

array (
  'REDIRECT_SCRIPT_URL' => '/announce',
  'REDIRECT_SCRIPT_URI' => 'http://jonnyfavorite3.appspot.com/announce',
  'REDIRECT_STATUS' => '200',
  'SCRIPT_URL' => '/announce',
  'SCRIPT_URI' => 'http://jonnyfavorite3.appspot.com/announce',
  'HTTP_HOST' => 'jonnyfavorite3.appspot.com',
  'HTTP_USER_AGENT' => 'Bittorrent',
  'HTTP_ACCEPT' => '*/*',
  'HTTP_CONNECTION' => 'closed',
  'PATH' => '/usr/local/sbin:/usr/local/bin:/usr/sbin:/usr/bin:/sbin:/bin',
  'SERVER_SIGNATURE' => '<address>Apache/2.4.7 (Ubuntu) Server at jonnyfavorite3.appspot.com Port 80</address>',
  'SERVER_SOFTWARE' => 'Apache/2.4.7 (Ubuntu)',
  'SERVER_NAME' => 'jonnyfavorite3.appspot.com',
  'SERVER_ADDR' => 'deleted',
  'SERVER_PORT' => '80',
  'REMOTE_ADDR' => '60.219.115.77',
  'DOCUMENT_ROOT' => 'deleted',
  'REQUEST_SCHEME' => 'http',
  'CONTEXT_PREFIX' => '',
  'CONTEXT_DOCUMENT_ROOT' => 'deleted',
  'SERVER_ADMIN' => 'deleted',
  'SCRIPT_FILENAME' => 'deleted',
  'REMOTE_PORT' => '27361',
  'REDIRECT_QUERY_STRING' => 'info_hash=%26%27%0F%C2%EB%03J%E2%1F%B0%28%2B%29d%7C%8C%FE%C8l%E9&peer_id=%2DSD0100%2Dj%7E%C3%1C%14%FFsj%DA9%0B%27&ip=10.155.31.47&port=9978&uploaded=2244978664&downloaded=2244978664&left=2570039513&numwant=200&key=511&compact=1',
  'REDIRECT_URL' => '/announce',
  'GATEWAY_INTERFACE' => 'CGI/1.1',
  'SERVER_PROTOCOL' => 'HTTP/1.0',
  'REQUEST_METHOD' => 'GET',
  'QUERY_STRING' => 'info_hash=%26%27%0F%C2%EB%03J%E2%1F%B0%28%2B%29d%7C%8C%FE%C8l%E9&peer_id=%2DSD0100%2Dj%7E%C3%1C%14%FFsj%DA9%0B%27&ip=10.155.31.47&port=9978&uploaded=2244978664&downloaded=2244978664&left=2570039513&numwant=200&key=511&compact=1',
  'REQUEST_URI' => '/announce?info_hash=%26%27%0F%C2%EB%03J%E2%1F%B0%28%2B%29d%7C%8C%FE%C8l%E9&peer_id=%2DSD0100%2Dj%7E%C3%1C%14%FFsj%DA9%0B%27&ip=10.155.31.47&port=9978&uploaded=2244978664&downloaded=2244978664&left=2570039513&numwant=200&key=511&compact=1',
  'SCRIPT_NAME' => '/index.php',
  'PHP_SELF' => '/index.php',
  'REQUEST_TIME_FLOAT' => 1422528394.036,
  'REQUEST_TIME' => 1422528394,
)

Some fields were replaced with ‘deleted’ for security.

Ok, so the client was sending a HOST header

jonnyfavorite3.appspot.com

This address resolves as:

ping jonnyfavorite3.appspot.com
PING appspot.l.google.com (74.125.24.141) 56(84) bytes of data.
64 bytes from de-in-f141.1e100.net (74.125.24.141): icmp_seq=1 ttl=52 time=1.53 ms

So to google appspot.

Next one:

array (
  'REDIRECT_SCRIPT_URL' => '/v2.2/1493038024241481',
  'REDIRECT_SCRIPT_URI' => 'https://graph.facebook.com/v2.2/1493038024241481',
  'REDIRECT_HTTPS' => 'on',
  'REDIRECT_SSL_TLS_SNI' => 'graph.facebook.com',
  'REDIRECT_STATUS' => '200',
  'SCRIPT_URL' => '/v2.2/1493038024241481',
  'SCRIPT_URI' => 'https://graph.facebook.com/v2.2/1493038024241481',
  'HTTPS' => 'on',
  'SSL_TLS_SNI' => 'graph.facebook.com',
  'HTTP_HOST' => 'graph.facebook.com',
  'HTTP_ACCEPT_ENCODING' => 'gzip, deflate',
  'CONTENT_TYPE' => 'multipart/form-data; boundary=3i2ndDfv2rTHiSisAbouNdArYfORhtTPEefj3q2f',
  'HTTP_ACCEPT_LANGUAGE' => 'zh-cn',
  'HTTP_CONNECTION' => 'keep-alive',
  'HTTP_ACCEPT' => '*/*',
  'HTTP_USER_AGENT' => 'FBiOSSDK.3.22.0',
  'PATH' => '/usr/local/sbin:/usr/local/bin:/usr/sbin:/usr/bin:/sbin:/bin',
  'SERVER_SIGNATURE' => '<address>Apache/2.4.7 (Ubuntu) Server at graph.facebook.com Port 443</address>',
  'SERVER_SOFTWARE' => 'Apache/2.4.7 (Ubuntu)',
  'SERVER_NAME' => 'graph.facebook.com',
  'SERVER_ADDR' => 'deleted',
  'SERVER_PORT' => '443',
  'REMOTE_ADDR' => '223.100.159.96',
  'DOCUMENT_ROOT' => 'deletd',
  'REQUEST_SCHEME' => 'https',
  'CONTEXT_PREFIX' => '',
  'CONTEXT_DOCUMENT_ROOT' => 'deleted',
  'SERVER_ADMIN' => 'deleted',
  'SCRIPT_FILENAME' => 'deleted',
  'REMOTE_PORT' => '24797',
  'REDIRECT_QUERY_STRING' => 'fields=name,supports_implicit_sdk_logging,gdpv4_nux_enabled,gdpv4_nux_content,ios_dialog_configs,app_events_feature_bitmask&format=json&sdk=ios',
  'REDIRECT_URL' => '/v2.2/1493038024241481',
  'GATEWAY_INTERFACE' => 'CGI/1.1',
  'SERVER_PROTOCOL' => 'HTTP/1.1',
  'REQUEST_METHOD' => 'GET',
  'QUERY_STRING' => 'fields=name,supports_implicit_sdk_logging,gdpv4_nux_enabled,gdpv4_nux_content,ios_dialog_configs,app_events_feature_bitmask&format=json&sdk=ios',
  'REQUEST_URI' => '/v2.2/1493038024241481?fields=name,supports_implicit_sdk_logging,gdpv4_nux_enabled,gdpv4_nux_content,ios_dialog_configs,app_events_feature_bitmask&format=json&sdk=ios',
  'SCRIPT_NAME' => '/index.php',
  'PHP_SELF' => '/index.php',
  'REQUEST_TIME_FLOAT' => 1422528399.4159999,
  'REQUEST_TIME' => 1422528399,
)

So that was it, connections were arriving to the Server/Load Balancer requesting addresses from Google, Facebook, thepiratebay main tracker, etc… tens of thousands of users simultaneously.

Clearly there was a kind of DNS spoofing attack. And looking at the ACCEPT_LANGUAGE I saw that clients were using Chineses language (zh-cn).

Changing the ip address will take some time, as some dns have 1 hour or several hours of TTL to improve page speed of customers, and both ip’s have to coexist for a while until all the client’s dns have refreshed, browsers have refreshed their cache of dns names, and dns of partners consuming our APIs have refreshed.

You can have a virtual host just blank, but for some projects your virtual hosts needs to listen for all the request, for example, imagine that you serve contents like barcelona.yourdomain.com and for newyork.yourdomain.com and whatever-changing.yourdomain.com like carlesmateo.yourdomaincom, anotheruser.yourdomain.com, anyuserwilhaveownurl.yourdomain.com, that your code process to get the information and render the pages, so it is not always possible to have a default one.

First thing I had to do was, as the attack came from the ip, was to do not allow any host requests that did not belong to the hosts served. That way my framework will not process any request that was not for the exact domains that I expect, and I will save the 404 process time.

Also, if the servers return a white page with few bytes (header), this will harm less the bandwidth if under a DDoS. The bandwidth available is one of the weak points when suffering a DDoS.

To block hosts that are not expected there are several things that can be done, for example:

  • Nginx can easily block those requests not matching the hosts.
  • Modify my script to look at
    HTTP_HOST

    So:
    if (isset($_SERVER['HTTP_HOST']) && ($_SERVER['HTTP_HOST'] != 'www.mydomain.com' && $_SERVER['HTTP_HOST'] != 'mydomain.com') {
    exit();
    }

    That way any request that is not for the exact domain will be halted quickly.
    You can also check instead strpost($_SERVER['HTTP_HOST'], ‘mydomain.com’) for variable HTTP_HOST

  • Create an Apache default virtual host and default ssl. With a white page the load was so small that even tens of thousands ip’s cannot affect enough the server. (Max load was around 2.5%)

Optimization: If you want to save IOPS and network bandwidth to the storage you can create a ramdisk, and have the index.html of the default virtual host in there. This will increase server speed and reduce overhead.

If you’re in a hurry to stop the attack you can also:

  • Change the Ip, get a new ip address, and change the dns to the new ip, and hope this one is not attacked
  • An emergency solution, drastic but effective, would be to block entire China’s ip ranges.

Some of the webs I helped reported having attacks from outside China, but nothing related, the gross attacks, 99%, come from China.

Sadly Amazon’s Cloud Firewall does not allow to deny certain ip addresses, only allow services through a default deny policy.

I reopened the firewall in 80 and 443, so traffic to everyone, checked that the Service was Ok and continued my way to the office.

When later I spoke with some friends, one of them told me about the Chinese government firewall causing this sort of problems worldwide!. Look at this interesting article.

http://blog.sucuri.net/2015/01/ddos-from-china-facebook-wordpress-and-twitter-users-receiving-sucuri-error-pages.html

It is not clear if those DDoS attacks are caused by the Chinese Firewall, by a bug, or by pirates exploiting it to attack sites for money. But is clear that all those attacks and traffic comes from China ip addresses. Obviously this DNS issues are causing the guys browsing on China to not being able of browsing Facebook, WordPres, twitter, etc…

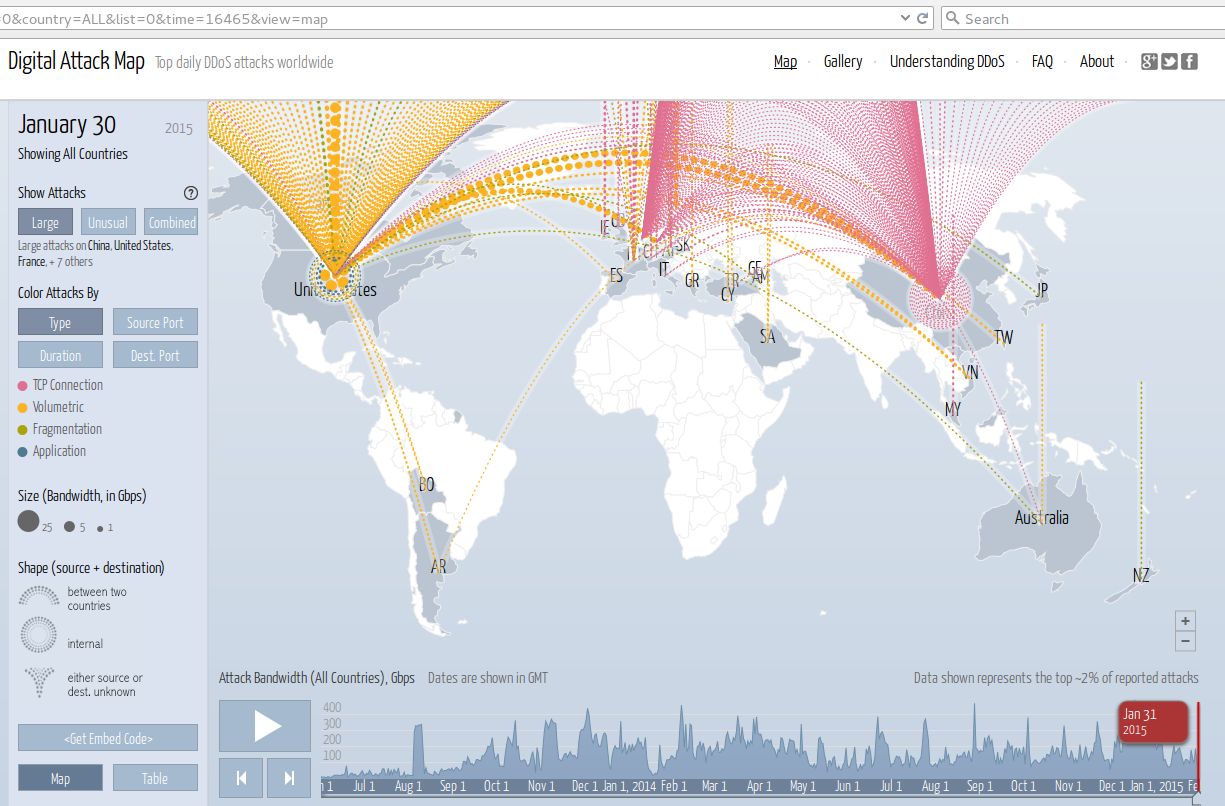
Here you can see live the origin of the world DDoS attacks:

http://www.digitalattackmap.com/#anim=1&color=0&country=ALL&list=0&time=16465&view=map

And China being the source of most of the DDoS attacks.

blog-carlesmateo-com-2015-02-01-15-23-33-china-source-of-attacks